ABSTRACT
Common bean (Phaseolus vulgaris L.) is the most important source of dietary protein in Uganda but current grain yields are low. Production is particularly low on the degraded Ferralsol soils that dominate the landscape because these soils are generally weathered, acidic and infertile. A study was done on a Ferralsol soil in Masaka District, Uganda to compare productivity and economic return to labor and management (ERLM) for four bean cultivars grown under three management systems. The experimental design was a randomized complete block in a split-plot arrangement. Management system was the whole-plot factor and included the Conventional Farmer (CFS), Improved Farmer (IFS), and High Input systems (HIS). Management systems differed for seed fungicide treatment (no vs. yes), seeding density (10 vs. 20 seed m-2), plant configuration (scatter vs. rows), fertilizer applications (P, K, Ca, Mg, Zn and S), rhizobium inoculation (no vs. yes), pesticide applications (no vs. yes), and frequency and timing of weeding. Subplots were four common bean cultivars that differed for resistance to foliar pathogens and the ability to tolerate low soil fertility. Increasing management level and planting bean cultivars tolerant to common bean diseases and low soil fertility improved bean grain yield. The only grain yield differences observed were between cultivars in the 2015A season; NABE 14 had greatest grain yield, 168% greater than that of NABE 15. The HIS with NABE 14 (1274 kg ha-1), the HIS with NABE 4 (1225 kg ha-1), and the IFS with NABE 14 (1025 kg ha-1) had the greatest grain yield. The ERLM was only profitable for the CFS ($40 ha-1); cultivars did not differ. Farmers planting bean on Ferralsol soil can improve yields with higher input systems but the tested systems were not profitable.
Key words: Phaseolus vulgaris L., soil fertility, crop management systems, improved cultivars, profitability.
Low soil fertility and acidity are the most important common bean (Phaseolus vulgaris L.) productivity constraints in East Africa (Lunze et al., 2007). Bean is an important crop worldwide but it is especially important in East Africa where it is a staple crop for dietary protein (Kweka, 2001). Despite its importance, bean needs more attention as an alternative to expensive red and white meat protein to meet the dietary needs of the ever-growing population of Uganda. Uganda’s population has increased very rapidly which has consequently increased the pressure on the land through continuous cultivation and reducing the frequency of traditional fallow periods (Ronner and Giller, 2012). Conventional management practices have resulted in infertile and degraded soils due to soil fertility mining (Nabhan et al., 1999).
Uganda’s population is estimated to be 34.9 million (Uganda Bureau of Statistics, 2014), with 80% living in rural areas. Average farm size in south-central Uganda is 1.2 ha in south-central Uganda. Due to low opportunities of employment, many people are living on subsistence agriculture and therefore desire a crop that is productive, profitable and nutritious (Kilimo Trust, 2012). However, due to limited land, beans are often grown on highly weathered soils and are rarely productive under conventional management practices.
Beans are grown on many types of soils in Uganda but the strongly weathered soils, such as Ferralsols, form more than 70% of the soil on which most of the farming is practiced (Wortmann et al., 1998). Beans are preferentially grown on darker, more fertile soils but most of the land favorable for row crop agriculture is already in production. This leaves the highly weathered and nutrient depleted, acidic soils to be utilized for crop production (Ronner and Giller, 2012). These soils require substantial inputs to improve both soil chemical fertility and pH (Nabhan et al., 1999)because they are strongly leached and have lost most of their weatherable minerals (Jones et al., 2013). These soils are dominated by stable minerals such as aluminum oxides, iron oxides and kaolinite, giving this soil its red color (Jones et al., 2013). These Al and Fe oxides often bind with P, making it unavailable for plant uptake. It is therefore important to lime these soils to increase the cation exchange capacity (CEC), neutralize Al, and to increase the supply of essential minerals such as Ca, K and Mg (Lunze et al., 2012). A target pH of 5.8 to 6.5 is favorable for bean production (Lunze et al., 2012)and when the pH is in this range minerals become more soluble, microorganisms are more active, and plant nutrient uptake improves.
Bean production on these red soils is poor but little research has suggested methods to increase yields on these acidic weathered soils. Ronner and Giller (2012)showed considerable improvements in bean yield and profitability when adding fertilizer but other research suggests it may be unwise to invest in high input agriculture because the yield increases may not be sufficient to cover the input costs (Ojiem et al., 2014). Currently, inorganic fertilizer is applied in very low quantities in Uganda, despite many soils being nutrient depleted (Ronner and Giller, 2012).
Soil amendments are effective at improving soil health
and productivity but smallholder farmers often cannot afford the amounts required to correct soil pH and nutrient deficiencies (Lunze et al., 2007). Alternatively, bean cultivars with tolerance to edaphic stresses can make it possible to improve bean yield and profitability on these low fertility and acidic soils by reducing the farmers’ dependency on fertilizers and therefore reduce production costs (Lunze et al., 2007; Singh et al., 2003). Disease resistant cultivars have been developed to avoid the risk of yield losses but adoption is low (Broughton et al., 2003). To address the constraints limiting bean production on Ferralsol soil in south-central Uganda, this study aims at comparing grain yield and profitability of four bean cultivars grown under a conventional and two improved management systems.
Experimental site
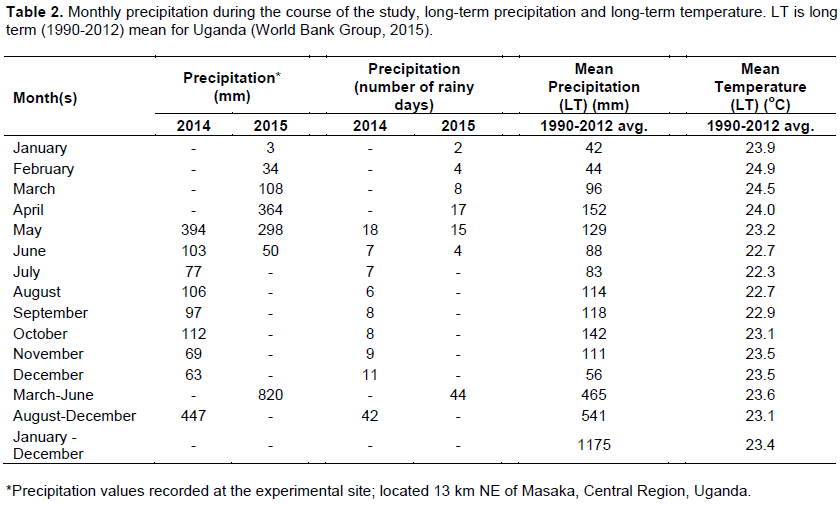
The experimental site was located approximately 13 km northeast of Masaka, Central Region, Uganda (latitude 0° 15’ 49.2552” S; longitude 31° 48’ 32.8752” E; altitude 1281 m). The climate is tropical and generally rainy with two dry seasons (Jones et al., 2013). Soil at the location was called Limyufumyufu (reddish) in the local language but is defined as a Ferralsol using the FAO-UNESCO soil legend and as a Eutrudox using USDA Soil Taxonomy (FAO, 1988; USDA NRCS, 1999). The soil at the experimental site was a sandy clay loam texture and formed from alluvial deposits. Prior to adding soil amendments, soil at the 0 to 15 cm depth had a pH range of 5.2 to 5.4, Mehlich-3 P ranged from 4 to 6 mg kg-1, and organic matter (OM) ranged from 41 to 43 g kg-1. Long term mean annual precipitation in Uganda is 1175 mm, with about 86% occurring during the crop growing seasons (World Bank Group, 2015). Precipitation data for the specific research site were not available before this project. According to the landowner, prior to the initiation of this study, the site had been in a maize (Zea mays L.), bean (Phaseolus vulgaris L.), groundnut (Arachis hypogaea L.), banana (Musa × paradisiaca L.) and cassava (Manihot esculenta Crantz) intercrop.
Experimental design
The experimental design and many of the materials and methodologies used in this study were similar or identical to those reported in a related study by Goettsch et al. (2016). The study was initiated in July 2014 and continued over two seasons, the second rainy season of 2014 (2014B), from the end of August through the beginning of December, and the first rainy season of 2015 (2015A), from the end of March through the middle of June. The experimental design was a randomized complete block in a split-plot arrangement. Management system was the whole-plot factor
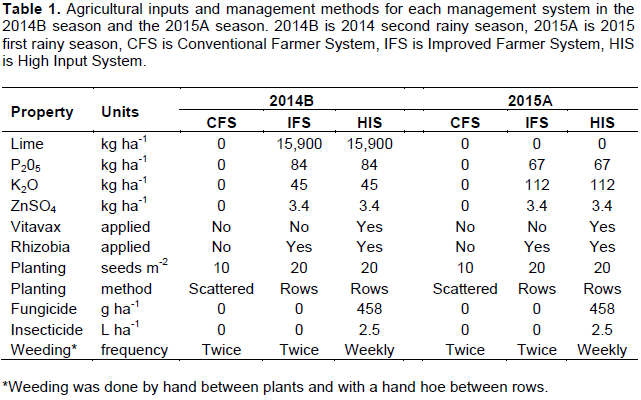
and included Conventional Farmer System (CFS), Improved Farmer System (IFS), and High Input System (HIS) (Table 1). The subplots were four common bean cultivars. Two cultivars, NABE 14 and NABE 15, were new and improved, and the other two, K132 and NABE 4, were conventional cultivars. The new cultivars were released 7 to 16 years later (2006 and 2010) than the older cultivars (1994 and 1999) and have greater resistance to several bean diseases prevalent in the south-central region of Uganda. Individual plot size measured six meters by four meters. There were four replications of each subplot combination.
Crop management practices
Perennial crops and residual weeds from the previous rainy season were removed more than one month prior to planting in the 2014B season and agricultural lime with 38% Ca and 68.85% effective calcium carbonate equivalent (ECCE) was applied at 15,900 kg ha-1 to neutralize the soil pH. Results from analysis of pre-plant soil samples showed available K was low, therefore, muriate of potash was broadcast by hand prior to tillage both seasons in the IFS and HIS. Potassium was applied at 44.8 kg ha-1 in the 2014B season and 112 kg ha-1 in the 2015A season. One to two weeks prior to planting, tillage was conducted with a hand hoe to a depth of 15-20 cm over a period of several days. Beans planted in the CFS were scatter planted at a density of 10 seeds m-2 while beans in the IFS and HIS were planted in rows 50 cm wide with seeds planted every 10 cm, which resulted in the recommended planting density of 20 seeds m-2 for both the IFS and HIS (UEPB, 2005). Bean seeds were from Community Enterprises Development Organisation (CEDO) located in Rakai, Uganda. Seed for HIS were treated with VITAVAX® (Bayer CropScience, Research Triangle Park, NC.) fungicide (carboxin: (5,6-Dihydro-2-methyl-N-phenyl-1,4-oxathiin-3-carboxamide) by CEDO personnel. Seeds planted in the IFS and HIS were inoculated with Mak-Bio-Fixer rhizobia obtained from Makerere University prior to planting. Before planting the IFS and HIS, triple superphosphate (0-46-0) was banded at 84 kg P2O5 ha-1 in the IFS and the HIS in the 2014B season and at 67.3 kg P2O5 ha-1 in both improved management systems in the 2015A season. Bands were placed in hand dug furrows at a depth of 8-10 cm and covered with 2-4 cm of soil. Beans were then placed at the recommended depth of 3-5 cm (Amongi et al., 2014)before being covered with soil using a hand hoe. Planting dates were 17 and 18 August during the 2014B season and 23 March for the 2015A season.
Formulated azoxystrobin (methyl (E)-2-{2[6-(2-cyanophenoxy) pyrimidin-4-yloxy]phenyl}-3-methoxyacrylate) was applied at identical rates and timing as described by Goettsch et al. (2016). Four days after applying the fungicide in the 2014B season, the insecticide cypermethrin ((±)α-cyano-(3-phenoxyphenyl)methyl(±)-cis-trans-3-(2,2-dichloroethenyl)-2,2-dimethylcyclopropanecarboxylate) formulated as Dudu-Cyper® 5% EC (Bukoola Chemical Industries LTD, Kampala, Uganda) was foliar-applied to the HIS beans at a rate of 2.5 L ha-1 mixed with 3.36 kg ha-1 of ZnSO4. This mixture was applied to the HIS with the hand-pumped backpack sprayer in approximately 625 L H2O ha-1. In the 2015A season, the fungicide, insecticide, and ZnSO4 were foliar-applied with the backpack sprayer as a mix to the HIS at the same rates as the previous season. The IFS received the ZnSO4 application both seasons at a rate of 3.36 kg ha-1.
Weeding occurred twice per season for the CFS and IFS. The first weeding occurred about V3 in the 2014B season and between V3 and V4 in the 2015A season. The second weeding occurred between R7 and R8 both seasons. Weeding was done weekly for the HIS so that weeds were never competitive with beans.
Crop and soil data collection
The pre-amendment and post-harvest soil samples were collected at a depth of 0 to 15 cm from 12 subsamples collected from each replication of each whole plot. Soil samples were analyzed for pH and electrical conductivity (EC) using the potentiometric method. Extractable Al (1-N KCl), organic matter (Walkley-Black C/0.58) and N (Kjeldahl) concentrations were determined by colorimetry. The cation exchange capacity (CEC) was calculated according to Brady and Weil (2007). After extraction with Mehlich-3, inductively coupled plasma optical emission spectrometry (ICP-OES) was used for soil sample analysis of P, K, Mg, Ca, Na, Al, Mn, S, Cu, B, Zn and Fe following extraction with Mehlich-3.
Phenological development stages were recorded weekly in each plot using the standard system developed for common bean (Van Schoonhoven and Pastor-Corrales, 1987).
Briefly, V1 is emergence, V3 is first trifoliate leaf, V4 is third trifoliate leaf, R5 is preflowering, R6 is flowering, R7 is pod formation, R8 is pod filling and R9 is physiological maturity.
Between R8 and R9, aboveground crop biomass was determined by hand clipping five bean plants per plot. Biomass samples were oven-dried at 60°C for 7 days and then weighed. Yield, yield components, and extended plant height data were collected from all bean plants within a 2.0 m2 area from each plot. Stand density of bean at R9 stage was determined at harvest by counting the number of plants within each harvested area. Extended plant height was measured on every plant harvested, up to a maximum of ten plants per subplot. At harvest, all pods were hand-picked, counted, placed in a paper bag, and weighed. Pods were placed in an oven at 60°C until dry and seed shelled, counted, and weighed. The pod harvest index (PHI; dry weight of seed at harvest/dry weight of pod at harvest × 100), pod number per area (pods m-2), and seed number per pod (seeds pod-1) were computed as described by Beebe et al. (2013). Grain yields are reported at 100% dry matter. Soil volumetric water content (VWC) was determined using a calibrated FIELDSCOUT® TDR 300 Soil Moisture Meter (Spectrum Technologies, Inc., Plainfield, IL). Sampling occurred weekly in each subplot at two points for each of two depths, 7.5 and 20 cm.
The costs of production and market prices of beans were based on local market prices for all agricultural inputs, except rhizobia, which was unavailable in the local market. It was assumed that inoculation will occur every four seasons. The economic return to labor and management (ERLM) was determined based on land rental costs collected from farmers in the Masaka District. The market price of bean used in the analysis assumed beans were sold immediately after harvest when farm gate prices ranged from 1500 to 1700 UGX kg-1, depending on the cultivar. The UGX to USD conversion rate used for this study was 3400 UGX = 1 USD.
Statistical analysis
Data were analyzed as a randomized complete block in a split-plot arrangement with management system as the whole-plot factor and bean cultivar as the subplot factor. Statistical analyses for yield, yield components, height, biomass, PHI, VWC, phenological and economic data were performed with the GLIMMIX Procedure of SAS V9.4 (SAS Institute, 2013). Least squares means were generated for all variables when significant F values (P < 0.05) were observed and then separated using the LINES option at P = 0.05. Soil data were analyzed using PROC GLM, which enabled us to separate means using the multiple mean comparison of the protected least significant difference. Differences among treatments were reported as significant at P = 0.05 except for the phenological differences between treatments, which were reported as significant at P = 0.01. Management system, cultivar, rainy season and weeks after planting (WAP) were considered fixed effects. Replication, replication × management system, and cultivar × replication × management system were considered random effects.
Climate
Climate results are identical to those reported in a related study by Goettsch et al. (2016) (Table 2). Total precipitation during the study, July 2014 through June 2015, was 1381 mm, 18% greater than the long-term normal. Precipitation during the dry season months, July and again January through February, amounted to only 67% of the 22-yr average for these months. However, the precipitation in April 2015 was 139% greater than that of the long-term average and the precipitation in May 2015 was 131% greater than that of the long-term average.
Soil
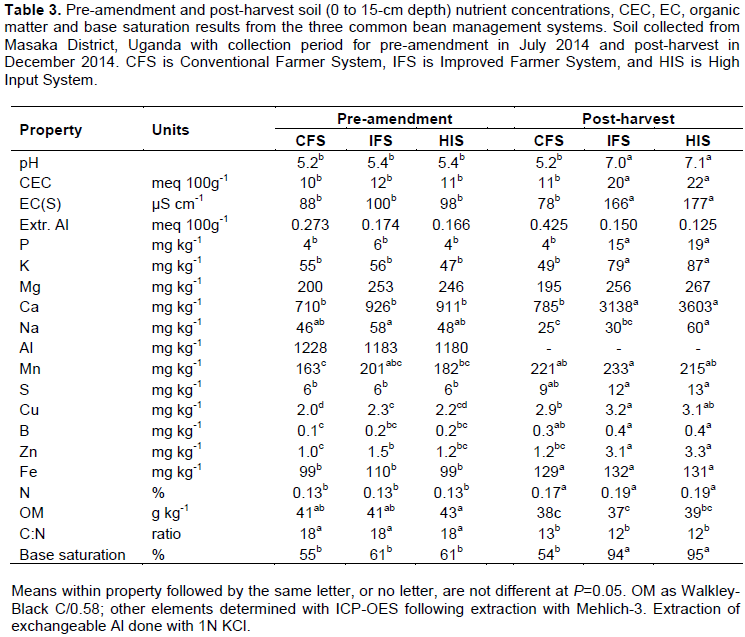
The pre-amendment soil results differed among management systems for Cu and Zn; all other physico-chemical parameters measured were similar among management systems (Table 3). Conversely, there were greater levels of the following properties in the two improved management systems in the post-harvest soil data as compared to the pre-amendment soil data: pH, CEC, EC(S), P, K, Ca, S, B, Cu, Zn, Fe, N and base saturation (Table 3). Additionally, post-harvest soil results differed for management systems for pH, CEC, EC(S), P, K, Ca, Na, Cu, Zn, and base saturation.
Volumetric water content
The VWC differed for management system, rainy season, and the interaction of rainy season × depth. No other main effects or interactions were significant. The VWC differed for depth during both rainy seasons. The mean VWC in the 2014B season was 0.19 and 0.21 cm3 cm-3 for 7.5 and 20 cm depth, respectively while mean VWC in the 2015A season was 0.26 and 0.24 cm3 cm-3 for 7.5 and 20 cm depth, respectively. The 2014B season was wetter at 20 cm depth as compared to 7.5 cm depth while the reverse was true for the 2015A season.
Bean development
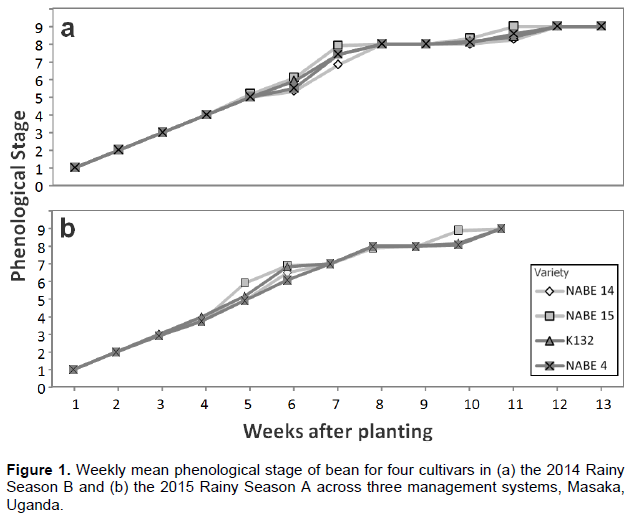
The phenological development of beans varied for all main effects and their interactions, except management system (results not presented). The interaction of cultivar × rainy season × WAP was significant (Figure 1). In both seasons, there was a divergence of cultivars with NABE 15 reaching stage five of development sooner than other entries. However, in subsequent WAP, cultivars were once again at similar development stages. Then, around 10 WAP, both seasons, NABE 15 diverged for a week before converging at maturation (R9). In the 2014B season, maturity was reached in 13 weeks while in the 2015A season, maturity was reached in just 11 weeks (Figure 1).
Yield, yield components, height, biomass and pod harvest index (PHI)
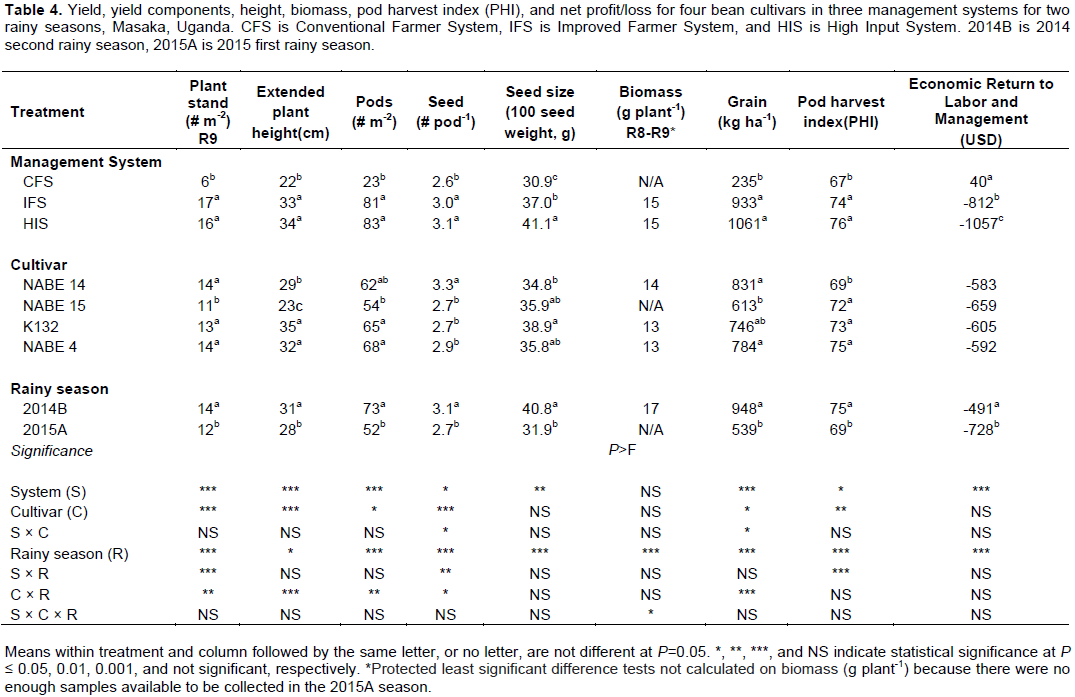
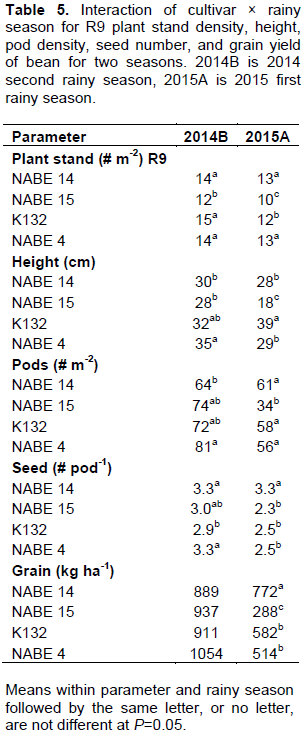
At maturity (R9 stage), stand density of beans differed for management system, cultivar, rainy season, and interactions of management system × cultivar and cultivar × rainy season (Table 4). In both rainy seasons, NABE 15 had the lowest stand density (Table 5). Differences were observed in stand density each rainy season × management system, which is due to the differences in planting density. Plant stands did not differ between rainy seasons for the IFS or HIS but there was a decrease in plant stand for the CFS. The CFS resulted in eight plants m-2 in the 2014B season but only four plants m-2 in the 2015A season (results not presented). Height of beans at harvest varied for management system, cultivar, rainy season, and the interaction of cultivar × rainy season (Table 4). In both rainy seasons, bean cultivars differed in height (Table 5). NABE 4 was taller than NABE 15 and NABE 14 in the 2014B season while K132 was the tallest and NABE 15 was the shortest in the 2015A season.


Pod density of beans differed for management system, cultivar, rainy season, and the interaction of cultivar × rainy season (Table 4). NABE 14 produced the fewest pods m-2 in the 2014B season and NABE 15 produced the fewest pods m-2 in the 2015A season (Table 5).
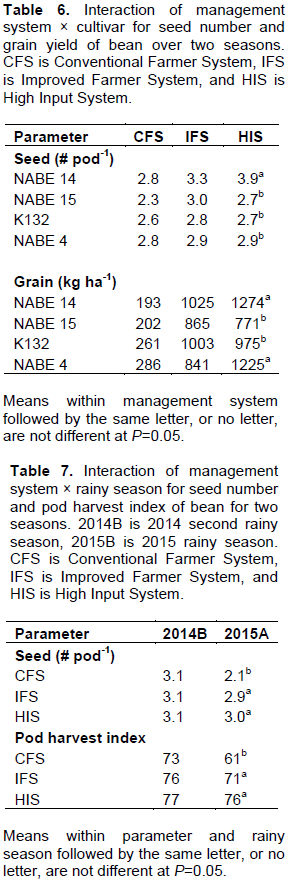
Seed number pod-1 varied for management system, cultivar, rainy season, and the interactions of management system × cultivar, management system × rainy season, and cultivar × rainy season (Table 4). Seed number pod-1 varied for cultivar in the HIS but cultivar did not vary for CFS or IFS (Table 6). NABE 14 had the greatest seeds pod-1 in the HIS. In both rainy seasons, seed number pod-1 varied for cultivar (Table 5). NABE 14 frequently produced more seeds pod-1 than the other cultivars while K132 produced among the fewest seeds pod-1 both seasons. Seeds pod-1 varied for management system only in the 2015A season (Table 7). The IFS and HIS produced more seeds pod-1 than the CFS in the 2015A season. The 100-seed weight varied for management system and rainy season; however, the interactions were not significant (Table 4). Cultivar did not influence 100-seed weight but the seed weight in the 2014B season was 28% greater than for the 2015A season. K132 produced the heaviest seed, weighing 12% greater than NABE 14.
Aboveground biomass (g plant-1) varied for rainy season and the three-way interaction of management system × cultivar × rainy season (Table 4). Biomass samples were not taken from nine CFS plots and one IFS plot in the 2015A season because plant stands were low. Collecting these plants for aboveground biomass would have compromised our ability to harvest grain yield and grain yield components. Consequently, the authors were unable to calculate protected least significant difference tests when including the 2015A season. Excluding the 2015A season and looking only at the 2014B season, aboveground biomass did not vary for any main effect or interaction.
Grain yield differed for management system, cultivar, rainy season, and the interactions of management system × cultivar and cultivar × rainy season (Table 4).
Grain yield differed for cultivar in the HIS but cultivar did not influence yield in the CFS or IFS (Table 6). Under the HIS, NABE 14 (1274 kg ha-1) and NABE 4 (1225 kg ha-1) produced the greatest grain yields. Cultivars only varied for grain yield in the 2015A season (Table 5). NABE 14 produced the greatest grain yield (772 kg ha-1) in the2015A season, recording 168% greater yield than NABE 15 (288 kg ha-1).
The PHI varied for management system, cultivar, rainy season and the interaction of management system × rainy season; all other treatment factors and interactions were not significant (Table 4). The PHI only varied for management system in the 2015A season when the IFS and HIS had 16 and 25% greater PHI than CFS (Table 7).
Economic analysis
Management system and rainy season influenced the economic return to labor and management (ERLM) but the other main effects and interactions did not influence net profit or loss (Table 4). The ERLM in the 2014B season was greater than that of the 2015A season; however, both seasons resulted in a net loss. The CFS produced the only profitable ERLM as IFS and the HIS only produced net losses. Cultivar did not influence ERLM.
Climate, volumetric water content and bean development
Due to the close proximity of this research on Ferralsol soil and the research on Phaeozem soil, weather data were collected at one location and was previously reported by Goettsch et al. (2016). Precipitation was favorable for bean production during the 2014B season but the increased frequency and amount of rain in the 2015A season was unfavorable for bean production, and likely was a primary factor for decreased yield and increased VWC in the 7.5 cm depth as compared to the 20 cm depth in the 2015A season. The VWC results were nearly identical to the results reported for our Phaeozem results (Goettsch et al., 2016), which may be due to the close proximity of these two locations and the similarities in texture between the two soils. Elevated temperatures (32/27°C) for only a few days can result in abscission of bean flowers and abortion of smaller, developing pods (Konsens et al., 1991). However, bean lines vary greatly in these responses (Gross and Kigel, 1991), allowing improvement of varieties. The differences in phenological development between cultivars at each date most likely were due to genetic differences in maturity among the four entries. This may be explained by the differences in maturity groups between the four cultivars, as reported in Goettsch et al. (2016). Interestingly, NABE 15 reached few developmental stages earlier than others cultivars which would suggest that this cultivar had more leaves earlier and therefore a potential for greater yields due to increased capture of light energy; however, this particular cultivar required fewer days to reach maturity as compared to the other three cultivars.
Pests and diseases
It is expected to see lower yields in the 2015A season as compared to the 2014B season because beans were planted on the same plots as the previous season. The bean-bean rotation could have been the cause of the greater occurrence of disease in the 2015A season; however, it could have also been due to the increased VWC in the soils, which is conducive to root rots and other diseases (Athanase et al., 2013). The increased amount of rain in the 2015A season as compared to the 2014B season could have caused the decreased prevalence of aphids (Weisser et al., 1997). Foliar diseases were less prevalent on the NABE 14 and NABE 4 cultivars in both seasons, which is likely due to their tolerance to foliar diseases. Surprisingly, NABE 15 had many disease symptoms even though it was selected for resistance to several common foliar and root diseases.
Cultivar selection and management of agricultural inputs and soil nutrients
Farmers prefer to plant bean on Phaeozem soil because they know that reddish soils (Ferralsols) are less fertile and poorer growing environment for bean. Even though Ferralsols are considered infertile, these soils rarely receive fertilizer applications, perhaps due to the greater amounts needed to increase production. Furthermore, it is questionable whether or not a return on investment is possible due to the great amount of expensive agricultural inputs required for increased production and the low market price of beans received at the farm gate. In most regions, beans are planted in rotation with cereals and therefore only benefit from the residual fertilizer applied in the previous season (Lunze et al., 2012).
Beans were replanted on the same plots in both seasons to develop a better understanding of lime carry- over effects on pH within each management system. The lime application increased pH to a level above the target range of 5.8 to 6.5 because there was no lime requirement functions developed before this project began. Lime requirements have since been developed for several soils in south-central Uganda by Tenywa et al. (personal communication, 2016) and are usually in the range of 0 to 4,000 kg ha-1 rather than the 15,000 kg ha-1 applied which was based on the best initial information. The dramatic increase in CEC from 11 to 22 cmol kg-1 clearly demonstrates that this soil was dominated by variable charge clays (Uehara and Gilman, 1982).
The main concern with agricultural lime was its cost and the great amount needed to reach the target pH range. There was similar economic concern with the amount and cost of fertilizer needed. A complement, or perhaps an alternative, to agricultural lime and fertilizer would be the adoption of improved cultivars with tolerance to low soil fertility, low soil pH, and extractable Al. New germplasm with tolerance to low soil pH and soluble Al was developed by Beebe et al. (personal communication, 2015) at CIAT and are a promising alternative to costly lime applications; however, incorporation of disease resistance is also necessary, so it is unknown when adapted cultivars with tolerance to low pH will be available for farmers. Additionally, it is unknown whether acid tolerant beans will have the characteristics that Ugandan consumers prefer, including taste and cooking time (Kilimo Trust, 2012).
A few bean cultivars have been documented to perform well under edaphic stresses; therefore, for comparison purposes, two cultivars that were tolerant to low soil fertility and two that were not tolerant were chose. When choosing the four cultivars, we ensured that each of them was accessible by smallholder farmers before testing for productivity under infertile soil and high acidity conditions. Three of the four cultivars (K132, NABE 4 and NABE 15) in this study were the most popular cultivars grown in Uganda. NABE 14 was included in this study because it was a newer cultivar with tolerance to low soil fertility and resistance to angular leaf spot (Phaeoisariopsis griseola) (ALS), bean common mosaic virus (Potyvirus spp.) (BCMV) and root rots (Fusarium solani f. sp. phaseoli). As predicted, this cultivar had greater yield on infertile soil with higher disease pressure.
Economic analysis
Ferralsols are widely reported to be infertile (Fungo et al., 2011; Musinguzi et al., 2015)with low productivity potential for bean (Nabhan et al., 1999), especially as compared to the Phaeozem soil described by Goettsch et al. (2016). The Phaeozem soil had more favorable pH, CEC, and better levels of macronutrients and micronutrients as compared to the Ferralsol soil. The greater level of infertility and need for higher rates of nutrients for enhanced bean production on this Ferralsol contributed to the poor economic returns to labor and management due to the added input costs. This is in agreement with Ronner and Giller (2012), who stated that it was profitable to fertilize fertile soils as fertilizing poor soils had only limited impact on yield and therefore limited return on investment. There are many tradeoffs to consider when selecting bean cultivars. Ugandan farmers choose which cultivars to grow based on soil fertility conditions, tolerance or resistance to heavy rainfall or drought, maturity, cooking time, taste, market prices, marketability locally and for export, and productivity (Kilimo Trust, 2012). Uganda currently imports many of its agricultural inputs such as fertilizers, lime, pesticides and herbicides (International Food Policy Research Institute, 2014), which is very costly since Uganda is a land-locked country. It currently takes more than 24 h of overland transportation to reach a major port to gain access to world markets, which not only increases the cost of agricultural inputs but also impacts the price of Ugandan beans at the farm gate (International Food Policy Research Institute, 2014). Due to the lack of quick and inexpensive transport to world markets, the demand for Ugandan beans is low and therefore grain prices remain low. This is one of the major reasons why only 20% of Uganda’s bean production is exported while the rest is traded or consumed locally (Kilimo Trust, 2012).
The IFS and HIS increased common bean yield by 400 and 450%, respectively, over the CFS. However, lime and fertilizer prices need to be lower for high bean production systems to be profitable on the Ferralsol soils of south-central Uganda. The development of management systems that limit the use of expensive agricultural inputs and utilize improved cultivars with a tolerance to low soil fertility and to acidity is necessary to improve bean yield. Only the CFS was profitable on this Ferralsol in the 2014B season. This suggests that, if growing beans on Ferralsol soils is necessary, it is economically important to grow during the long rainy season (rainy season B) and to minimize the use of expensive agricultural inputs.
The authors have not declared any conflict of interests.
REFERENCES
|
Amongi W, Nkalubo ST, Ochwo-Ssemakula M, Gibson P, Edema R (2014). Development of intermittent drought stress tolerant common bean genotypes in Uganda. Afr. Crop Sci. J. 22(4):303-315.
|
|
|
|
Athanase C, Tenywa JS, Tenywa MM, Okiror JJ, Leonidas D, Mupenzi M, Augustine M (2013). Farmers' Coping Mechanisms for Common Bean Production under Water-logged Soil Conditions in Uganda Rwanda Boarder Region. J. Environ. Sci. Eng. B. 2(1):46-52.
|
|
|
|
|
Beebe SE, Rao IM, Blair MW, Acosta-Gallegos JA (2013). Phenotyping common beans for adaptation to drought. Front. Physiol. 4:35.
Crossref
|
|
|
|
|
Brady NC, Weil RR (2007). The colloidal fraction: seat of soil chemical and physical activity, in: The Nature and Properties of Soils, 14th ed. Prentice Hall pp. 310-357.
|
|
|
|
|
Broughton WJ, Hernández G, Blair M, Beebe S, Gepts P, Vanderleyden J (2003). Beans (Phaseolus spp.) – model food legumes. Plant Soil 252: 55-128.
Crossref
|
|
|
|
|
FAO (1988). FAO/UNESCO Soil Map of the World. Revised Legend, with corrections and updates.
|
|
|
|
|
Fungo B, Grunwald S, Tenywa M, Vanlauwe B, Nkedi-Kizza P (2011). Lunnyu soils in the Lake Victoria basin of Uganda: Link to toposequence and soil type. Afr. J. Environ. Sci. Technol. 5(1):15-24.
|
|
|
|
|
Goettsch L, Lenssen A, Yost R, Luvaga E, Semalulu O, Tenywa M, Mazur R (2016). Improved production systems for common bean on Phaeozem soil in south-central Uganda. Afr. J. Agric. Res. 11(46):4796-4809.
Crossref
|
|
|
|
|
Gross Y, Kigel J (1994). Differential sensitivity to high temperature of stages in the reproductive development of common bean (Phaseolus vulgaris L.). Field Crops Res. 36:201-212.
Crossref
|
|
|
|
|
International Food Policy Research Institute (2014). Atlas of African agriculture research and development.
View
|
|
|
|
|
Jones A, Breuning-Madsen H, Brossard M, Dampha A, Deckers J, Dewitte O, Gallali T, Hallett S, Jones R, Kilasara M, Le Roux P, Micheli E, Montanarella L, Spaargaren O, Thiombiano L, Van Ranst E, Yemefack M, Zougmoré R (eds.) (2013). Soil Atlas of Africa. European Commission, Publications Office of the European Union, Luxembourg. 176 p.
|
|
|
|
|
Kilimo T (2012). Development of Inclusive Markets in Agriculture and Trade (DIMAT): The Nature and Markets of Bean Value Chains in Uganda.[Online]
View
|
|
|
|
|
Konsens I, Ofir M, Kigel J (1991). The effect of temperature on the production and abscission of flowers and pods in snap bean (Phaseolus vulgaris L.). Ann. Bot. 67(5):391-399.
Crossref
|
|
|
|
|
Kweka SO, Ndakidemi PA, Mushi CS, Nkonya E, and David S (2001). Adoption of Lyamungu 85 bean variety in the medium-altitude zone of Tanzania. Pan-African Bean Research Network (PABRA) Millennium Workshop, 28 May-1 June, Arusha, Tanzania, CIAT, Kampala pp. 147-151.
|
|
|
|
|
Lunze L, Abang M, Buruchara R, Ugen MA, Nabahungu NL, Rachier GO, Ngongo M, Rao I (2012). Integrated Soil Fertility Management in Bean-Based Cropping Systems of Eastern, Central and Southern Africa, in: Whalen, J.K. (Ed.), Soil Fertility Improvement and Integrated Nutrient Management – A Global Perspective. InTech pp. 239-272.
Crossref
|
|
|
|
|
Lunze L, Kimani PM, Ngatoluwa R, Rabary B, Rachier GO, Ugen MM, Ruganza V, Awad elkarim EE (2007). Bean improvement for low soil fertility in adaptation in Eastern and Central Africa. In: Bationo A, Waswa B, Kihara J, Kimetu J (Eds.) Advances in integrated soil fertility management in sub-Saharan Africa: Challenges and Opportunities pp. 325-332. Springer, Dordrecht, The Netherlands.
|
|
|
|
|
Musinguzi P Tenywa JS, Ebanyat P, Basamba TA, Tenywa MM, Mubiru DN, Zinn YL (2015). Soil organic fractions in cultivated and uncultivated Ferralsols in Uganda. Geoderma Regional. 4:108-113.
Crossref
|
|
|
|
|
Nabhan H, Mashali AM, Mermut AR (1999). Integrated soil management for sustainable agriculture and food security in southern and east Africa, Integrated soil management for sustainable agriculture and food security. FAO. Rome.
|
|
|
|
|
Ojiem JO, Franke AC, Vanlauwe B, de Ridder N, Giller KE (2014). Benefits of legume–maize rotations: Assessing the impact of diversity on the productivity of smallholders in Western Kenya. Field Crops Res. 168:75-85.
Crossref
|
|
|
|
|
Ronner E, Giller K (2012). Background information on agronomy, farming systems and ongoing projects on grain legumes in Uganda pp. 1-34.
|
|
|
|
|
SAS Institute Inc. (2013). SAS/STAT User's Guide. Version 9.4. SAS Institute Inc., Cary, NC, USA.
|
|
|
|
|
Singh SP, Teran H, Munoz CG, Osorno JM, Takegami JC, Thung MDT (2003). Low soil fertility in landraces and improved common bean genotypes. Crop Sci. 43(1):110-119.
Crossref
|
|
|
|
|
Uganda Bureau of Statistics (2014). National Population and housing Census 2014. Provisional results pp. 1-65.
|
|
|
|
|
Uganda Export Promotion Board (UEPB) (2005). Dry Beans: Product Profile No. 12. [Online]
View
|
|
|
|
|
Uehara G, Gilman GP (1982). The Mineralogy, Chemistry and Physics of Tropical Soils with Variable Charge Clays. Westview Press, Boulder, CO.
|
|
|
|
|
USDA NRCS (1999). Soil Taxonomy: A Basic System of Soil Classification for Making and Interpreting Soil Surveys. 2nd ed. [Online]
View
|
|
|
|
|
Van Schoonhoven A, Pastor-Corrales MA (1987). [Online] Standard system for the evaluation of bean germplasm. [Online]
View
|
|
|
|
|
Weisser WW, Volkl W, Hassell MP (1997). The importance of adverse weather conditions for behavior and population ecology of an aphid parasitoid. J. Anim. Ecol. 66(3): 386-400.
Crossref
|
|
|
|
|
World Bank Group (2015). Average monthly temperature and rainfall for Uganda from 1990-2012. [Online]
View
|
|
|
|
|
Wortmann CS, Kirkby RA, Eledu CA, Allen DJ (1998). Atlas of common bean (Phaseolus vulgaris L.) production in Africa. International Center for Tropical Agriculture, Cali, Colombia. 133 p. (CIAT publication; no. 297).
|
|