ABSTRACT
Rainfall of Pusa, Purnia, Sabour and Gaya representing different Agro-ecological zones (Zone I, II, IIIA, IIIB respectively) of Bihar were analyzed on monthly, seasonal and annual time scales using long period data. Mann-Kendall non-parametric test was employed for observational trend detection of monthly, seasonal and annual precipitation for different period viz. 1971-1980 (DP1), 1981-1990 (DP2), 1991-2000 (DP3), 2001-2010 (DP4) and for long period 1971-2010 (LP). Zone IIIA shows significant decreasing trend of 42.85 mm/year annual rainfall in recent decadal period (DP4). Zone III B shows significant decreasing trend of annual rainfall during long period (LP) but there is increasing trend of 4.57 mm/year during recent decadal period (DP4) and 0.43 mm/year during long period (LP) in pre monsoon/summer season. August and September months show significant decreasing trend of 2.12 and 2.62 mm/year rainfall respectively in LP in Zone III B, which may affect the transplanting/vegetative phase of the rice crop. Decreasing trend of rainfall in post monsoon season in all the zones during recent decadal period (DP4) as well as LP is delaying/affecting the sowing of wheat crop.
Key words: Rainfall, trend, Mann-Kendall test, least-squares, periods, agro ecological zones.
The water and agricultural sectors are likely to be worst affected by changing climate. Under warmer climate, the arid and semiarid regions could experience severe water stress due to decline in soil moisture. The critical values of extreme temperature indices during rice and wheat growing months provide an indicator to assess the vulnerability of rice-wheat productivity to temperature for Patna and Samastipur districts of Bihar and there is a need to prepare an adaptive strategy (Subhash et al., 2013). The spatial distribution and magnitude of rainfall trends would be highly relevant and useful from an agricultural and water management point of view. A long term rainfall data is very useful in making decision about agriculture water management and crop pattern and to locate the drought prone areas (Valipour, 2012). Even yield predictions of rice have been made by the Models based on water requirement calculations and rainfall data in agro climatic zones of Bihar (Dutta et al., 2001). In India, long term time series of summer monsoon rainfall has no discernible trends, but decadal departures are found above and below the long time average alternatively for three consecutive decades and the same study employing non-parametric methods showed a decreasing trend for rainfall variables (Kothyari and Singh, 1998). Sadhukhan et al. (2000) and Kothawale et al. (2010) studied trends of annual and seasonal rainfall at many locations and at different scales over India. Recent decades have exhibited an increasing trend of rainfall in Central north east India during pre monsoon (Subhash et al., 2010). In recent years, in Bihar, the rainfall distribution is becoming erratic resulting in frequent crop failure by the way of submergence or prolonged drought. In increasing frequent drought condition in Bihar farmers preferences are increasing for drought tolerant rice varieties (Patrick et al., 2014). The chances of occurrence of intense rainfall events in near future will also increase proportionally and efforts should be made to prepare detailed site specific management plan (Subhash et al., 2011). The frequent aberrations necessitate studying the rainfall trend during crop planning. It is essential to plan agriculture on a scientific basis for making best use of rainfall pattern of this area. The future area equipped for irrigation can be estimated by study of agricultural water management of long term (Valipour, 2014). Most of the studies are confined to only seasonal and annual rainfall. However, on a monthly basis, analysis has been very little. This study investigates the trends of rainfall in data series of monthly, seasonal and annual rainfall with their percentage contribution to the total annual rainfall for four agro climatic zones (I, II, IIIA and IIIB) of Bihar state using Mann- Kendall non parametric test. The slopes of the trend lines were determined using the method of least square linear fitting.
Study sites
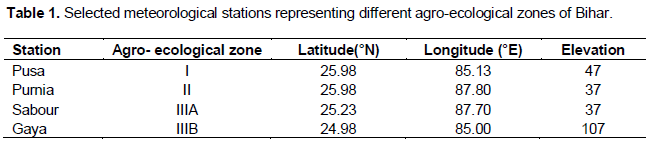
Four study sites were selected in the state which represents different agro ecological regions of the state. The sites were Pusa (Zone I), Purnia (Zone II), Sabour (Zone IIIA) and Gaya (Zone IIIB). The daily rainfall data of four stations of Bihar for the period from 1971 to 2010 from Indian meteorological department, Pune and meteorological observatories at Sabour and Pusa were used (Table 1). The daily rainfall data were checked thoroughly for homogeneity, outliers and missing records. After performing this quality check the daily records were processed for monthly, seasonal and annual rainfall. Seasonal trend was observed for four seasons viz., Winter (December- February), Pre monsoon (March-May), Monsoon (June- September) and Post monsoon (October- November). Statistical analysis was done to work out monthly, annual and seasonal variability, contribution and trend by calculating different descriptive viz., mean, Standard deviation (SD) and coefficient of variation (CV). The long term trend was calculated on monthly, annual and seasonal for four periods viz.1971-1980 (DP1), 1981-1990 (DP2), 1991-2000 (DP3), 2001-2010 (DP4) and long period 1971-2010 (LP) to know whether there is variability of rainfall during the study period. The percent contribution of monthly and seasonal rainfall to annual rainfall was also calculated for four periods and as well as for the entire period to know whether there is any change in the shift of rainfall pattern. The Mann Kendal non parametric test, as described by Sneyers (1990), was applied in order to detect the presence of any trend. This test was used by several researchers to detect trends in hydrological time series data (Serrano et al., 1999; Brunetti et al., 2000a, b; Luo et al., 2008). The Mann Kendal test was used, assuming the observations in time series are serially independent and there is no serial correlation (persistence). The test determines whether the observations in the data tend to increase or decrease with time. The slopes of the trends were calculated by fitting the data series into method of least square linear fitting. This method calculates the best fitting line for the observed data by minimizing the sum of the square of the vertical deviations from each data point to the line. Test of significance was carried out for the slopes at 95% significant level (confidence interval). The least square method slope was presented to show the linear slope.
General rainfall statistics of the study area
Among the agro ecological regions, Zone II receives the highest annual rainfall of 1466.7 mm (Table 3) with coefficient of variation (CV) of 25.8%, followed by Zone I (1246.9 mm) (Table 2) with coefficient of variation 30.8%. The Zone IIIB receives the lowest annual rainfall of 1031.0 mm with coefficient of variation 23.7 % (Table 5). As far as different decadal periods are concerned, it is clear that Zone I received higher annual rainfall in all periods except DP3 compared to LP average. Zone II received lower annual rainfall in DP2 and DP4 than long term average. Zone IIIA received lower annual rainfall in all the periods except DP3 where as Zone IIIB received lower rainfall in DP3 and DP4. All the zones in recent decadal period (DP4) received lower annual rainfall than long term period (LP) average rainfall except Zone I.
Trends in monthly rainfall
The rainiest month during all the decadal periods for all the zones was July followed by August except DP3 in
Zone I, in which August was the rainiest month. The long term average also shows that July is the rainiest month followed by August for all the zones. For all the zones during all decadal periods, January month shows decreasing trend of rainfall. There is a significant decreasing trend of 1.39 mm/year for Zone II during DP1, 5.98 mm/year for Zone IIIB during DP2 and 2.35 mm/year during recent decadal (DP4) period in Zone IIIA during January month. In the month of February, there is significant increasing trend of 1.58 mm/year during DP2 and decreasing trend of 3.02 mm/year during DP1 in zone I and zone II respectively. There is significant increasing trend of 1.4 mm/year during the recent decadal period (DP4) in Zone II during March. In the month of April, there is significant decreasing trend of 3.15 mm/year during DP2 in Zone I. For May, there is significant increasing trend of 10.77 and 7.10 mm/year in Zone II and Zone IIIB respectively during DP3. There is significant increasing trend of 29.82 mm/year for the month of June in Zone I during DP3. For the month of July, there is increasing trend of 1.09 mm/year during recent decadal period (DP4) in Zone II and 33.65 mm/year during DP3 in Zone IIIB. In the month of August, there is significant decreasing trend of 15.6 mm/year during DP3 and of 2.12 mm/year during long term period (LP) in Zone IIIB. There is also significant decreasing trend of 2.62 mm/year during LP in Zone IIIB in the month of September. For October, November and December all zones show decreasing trend except for November in Zone IIIA, which shows increasing trend during LP, but statistically not significant. The decrease of rainfall in these months may hamper sowing of wheat, which is the important rabi crop of this area.
Trends in seasonal rainfall
There is a decreasing trend of winter rainfall in all zones, which is affecting the wheat crop in the area. In pre monsoon season, there is increasing trend of rainfall for all the zones except Zone II, though it is statistically not significant. There is significant increasing trend of 4.57 mm/year during recent decadal period (DP4) and 0.43 mm/year during LP in pre monsoon /summer season in Zone IIIB (Table 5). During recent decadal period (DP4), there is decreasing trend of rainfall in monsoon season for all the zones except Zone II, though it is statistically not significant. But in long duration (LP), there is decreasing trend of monsoon rainfall, in Zone I and IIIB, which may hamper the rice crop in the area. Decreasing trend of rainfall in post monsoon season in all the zones during recent decadal period (DP4) as well as during (LP) are affecting the sowing of wheat crop. Rice and wheat crop which are major crops of the area has been affected drastically due to decreasing trend of rainfall in monsoon and post monsoon season during recent decadal period (DP4). Zone I and IIIA, show decreasing trend of rainfall in all the seasons during (LP), which may affect the water availability for the crop in the area.
Trends in annual rainfall
There is significant increasing trend of 62.78 mm/year during DP3 but during recent decadal period (DP4) annual rainfall shows decreasing trend of 42.85 mm/year in the Zone IIIA (Table 4). Though during LP there is no significant decreasing trend. The long-term (LP) annual rainfall of Zone IIIB shows significant decreasing trend of 7.04 mm/year (Table 5). In Zone I, during LP, it also shows decreasing trend but statistically non significant. There is increasing trend of annual rainfall in Zone II during LP but statistically not significant. In all the zones except Zone II, there is decreasing trend of annual rainfall during recent period (DP4), though it is not statistically significant.
Trends in seasonal contribution
Study reveals that there is increasing trend of contribution of pre monsoon rainfall in annual rainfall (Figure 1). Increasing contribution of pre monsoon rainfall in annual rainfall for all the zones indicates that there is possibility of summer crop in the region which may be introduced. There is decreasing trend of contribution of monsoon and post monsoon rainfall in annual rainfall in all the zones except Zone II. Though there is no significant trend in the seasonal contribution but shifting of rainfall from monsoon and post monsoon season towards pre monsoon season needs further study so that planners and managers can chalk out strategy to tap maximum available natural resources at appropriate time to enhance agricultural productivity, thereby sustain food security.
Impact on crop production
Long term decreasing trend of rainfall indicates that Zone I, IIIA and IIIB will face water scarcity problem, which need suitable cropping system in the condition of less water availability and Zone II shows increasing trend of precipitation where water availability will impact positively agriculture of the region by increased length of growing period with water availability to agriculture. Unequal distribution of precipitation may cause drought in one area and flood in another area. The precipitation decrease in most of the zones in Bihar will impact negatively on rice-wheat cropping system, which is the major cropping system in the area. Not only decrease in rainfall but also abnormal, irregular or excessive amounts of rainfall seriously reduce the quality and quantity of the yield in rainfed rabi crops.
The study reveals that there is decreasing trend of rainfall in monsoon and post monsoon season in most of the zones in Bihar during long period. Zone IIIB shows significant decreasing trend of annual rainfall during LP. There is significant increasing trend of 4.57 mm/year during recent decadal period (DP4) and 0.43 mm/year during LP in pre monsoon /summer season in Zone IIIB. It indicates that not only mean annual rainfall is decreasing in long term but shifting of rainfall from monsoon and post monsoon season towards pre monsoon season has been also occurred. Zone I and Zone IIIA, show decreasing trend of rainfall in all the seasons during (LP), which may be reduce the water availability in the area. In recent decadal period (DP4), all the zones show decreasing trend of monsoon and post monsoon rainfall except Zone II, which shows increasing trend of rainfall in monsoon season. Since rice crop is the important kharif crop in this region, the decreasing trend of rainfall in monsoon may delay/affect the transplanting/vegetative phase of the crop, and assured irrigation is very much needed to tackle the moisture stress situation. Decreasing trend of rainfall in post monsoon season may also delay the sowing of wheat crop which is important rabi crop in the region due to moisture stress condition.
The authors have not declared any conflict of interest.
REFERENCES
Brunetti M, Buffoni L, Maugeri M, Nanni T (2000a). Precipitation intensity trends in northern Italy. Int. J. Climatol. 20:1017-1031.
Crossref |
|
|
Brunetti M, Buffoni L, Maugeri M, Nanni T (2000b). Trends of minimum and maximum daily temperatures in Italy from 1865 to 1996. Theoret. Appl. Climatol. 66:49-60.
Crossref |
|
|
Dutta S, Patel NK, Srivastava SK (2001). District wise yield models of rice in Bihar based on water requirement and meteorological data. J. Indian Soc. Remote Sens. 29(3):175-182.
Crossref |
|
|
|
Kothawale DR, Revadekar JV, Rupa KK (2010). Recent trends in pre-monsoon daily temperature extremes over. Indian J. Earth Sci. 119(1):51-65.
View
|
|
|
|
Kothyari, U.C. and Singh, V.P. (1998). Rainfall and temperature trend in India. Hydrol. Proc. 10(3):357-372. |
|
|
|
Luo Y, Liu S, Fu S, Liu J, Wang G, Zhou G (2008). Trends of precipitation in Beijing river basin, Guangdong province, China. Hydrol. Proc. 22:2377-2386.
View
|
|
|
Patrick SW, David LO, David JS, Singh V (2014). Heterogenous demand for drought-tolerant rice: evidence from Bihar, India. World Dev. 64:125-139.
Crossref |
|
|
|
|
|
|
|
Sadhukhan I, Lohar D, PaL DK (2000). Pre-monsoon season rainfall variability over Gangetic West Bengal and its neighborhood, India. Int. J. Climatol. 20(12):1485-1493. |
|
|
|
Serrano, Mateos VL, Garcia JA (1999). Trend analysis of monthly precipitation over Iberian Peninsula for the period 1921-1995. Phys. Chem. Earth 24:85-90. |
|
|
|
Sneyers R (1990). On the statistical Analysis of series of observation. Geneva. WMO Tech. Note P. 143. |
|
|
|
Subhash N, Sikka AK, Ram Mohan HS (2010). An investigation into observational characteristics of rainfall and temperature in Central Northeast India-a historical perspective 1889-2008. Theoret. Appl. Climatol. |
|
|
Subhash N, Singh SS, Priya N (2011). Extreme rainfall indices and its impact on rice productivity- A case study over sub-humid climatic evironment. Agric. Water Manage. 98(9):1373-1387.
Crossref |
|
|
Subhash N, Singh SS, Priya N (2013). Observed variability and trends in extreme temperature indices and rice-wheat productivity over two districts of Bihar, India-a case study. Theoret. Appl. Climatol. 111:235-250.
Crossref |
|
|
|
Valipour M (2012). Critical areas of Iran for agriculture water management according to the annual rainfall. Eur. J. Sci. Res. 84(4):600-608. |
|
|
|
Valipour M (2014). Future of the area equipped for irrigation. Arch. Agron. Soil Sci. 60(12):1641-1660. |


