ABSTRACT
There are studies on the current state of understanding productivity models, focusing on the applicability of different estimation models for coffee tree productivity; the majority involving a considerable level of complexity. Thus, when searching for a simple and direct association between phenological characteristics and coffee productivity, doing research on this hypothesis is necessary. In this study, we aimed to validate a phenological model for coffee tree productivity by using phenological indices, under given edaphoclimatic conditions of Southern State of Minas Gerais, Brazil. We used 10 sample plots obtained from the municipalities of Lavras, Varginha, Carmo de Minas, Ijaci and Santo Antônio do Amparo. Plots were chosen based on the existing history about coffee productivity, which is over 40 sacks ha-1. Phenological data were collected in September-October, December-January and March to April of the harvesting seasons 2012/2013 and 2013/2014. The number of flowers and fruits were obtained at the fourth and fifth productive nodes of coffee plagiotropic branches sampled at the middle third of each coffee plant. Forty plants were sampled in each plot for the measurement of plant height and estimates of productivity phenological indices. Data regarding the observed production were obtained for models comparison and validation and, then, statistical tests were run. Results showed that these models are suitable for the coffee crop in the region under study. In addition, productivity phenological indices showed good correlation with the observed productivity.
Key words: Coffee phenology, Coffea arabica L., prediction of productivity, agrometeorological modeling.
Cultivation of coffee tree, usually done in large commercial plantations, is influenced by variation of climate elements, occurrence of adverse weather conditions such as frost and dry spell, as well as the effect of plant physiology (bienniality). Besides, the coffee productivity forecast is found to be rather complex due to the intricate physiological mechanisms, crops diversity, and management conditions associated with the crop.
Coffee is a commodity, whose prices around the world are set in merchant exchanges. These prices depend on the expectations created regarding the availability of the commodity and expected demand. Thus, in order to ensure financial viability of the activity, a detailed planning of the application of resources or not, and necessary operations to ensure a given production level are found to be indispensable.
According to Sette et al. (2010), the relevance of performing costs-of-production forecasts is highlighted, especially coffee tree productivity estimates. This foresight is carried out to identify the best inputs combination, aiming to optimize economical outcomes.
Various productivity estimation models have been used, for example, agrometeorological, a model proposed by Picini et al. (1999) and Santos and Camargo (2006). Besides, there are many other models already tested in different producing regions, as well as in different edaphoclimatic and crop management conditions (Silva et al., 2011; Camargo et al., 2007). Such models have also been used to determine the onset and duration of phenological stages for coffee trees (Zacharias et al., 2008; Nunes et al., 2010; Carvalho et al., 2011).
There are some limitations regarding the use of agrometeorological models because it depends on the availability of meteorological data, specialized professionals for data interpretation, and the disregard of influence of factors such as soil fertility and plant sanitation activities.
The agrometeorological-spectral model has also been used for crops production forecasting (Rosa et
al., 2010). This model uses satellite imagery obtained by means of the MODIS sensor. It also uses agrometeorological data obtained from the regional model used for weather forecasting as input variable in coffee growing areas of the Southern State of Minas Gerais, Brazil. However, besides difficulties mentioned above, the use of this model is limited by the need for the acquisition of images at the desired frequency for a given locality.
The third estimation model developed for the same purpose was described by Carvalho et al. (2005) and uses the harmonic analysis based on Fourier series. This model involves 33 variables; however, results obtained by using this model were not satisfactory due to the high level of complexity found in coffee production forecast.
In the limitations mentioned above, and considering that the assessment of phenological characteristics, determining of coffee tree production, can be a tool for the establishment of crop forecast models with significant level of simplicity, studies were performed as outlined in Fahl et al. (2005) and Sáenz et al. (2008).
In this study, we tested the hypothesis that phenological characteristics of coffee tree can be used as indicators of productivity in spite of edaphoclimatic and physiological conditions, the cultivar under crop, and agrotechnical management practices. We aimed to validate an estimation model for coffee tree productivity by using two phenological indices, under cropping conditions of Southern State of Minas Gerais, Brazil
.
Sampling plots were established in the municipalities of Lavras, Varginha, Carmo de Minas, Ijaci and Santo Antônio do Amparo, located in the Southern State of Minas Gerais, Brazil. These locations were chosen as representatives of edaphoclimatic characteristics and crop management practices for coffee plantations in the region under study.
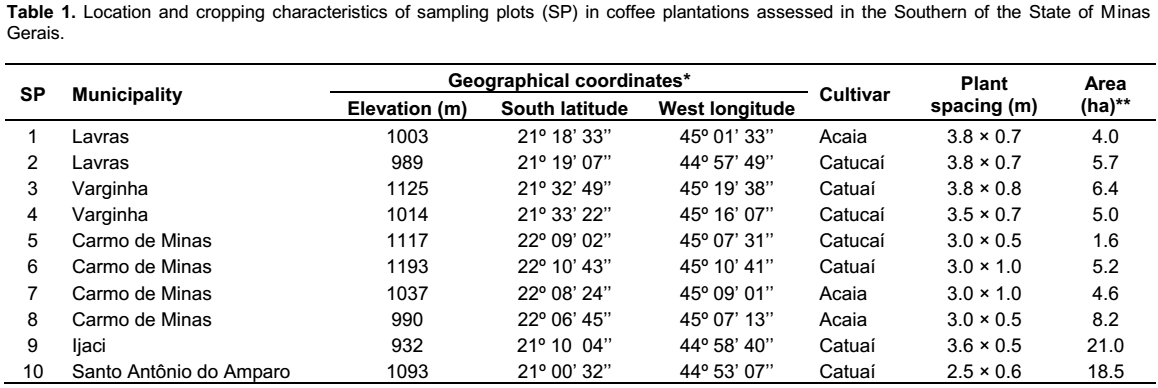
Table 1 show ten sampling plots clustered according to municipalities, cultivars, plant spacing, and time after planting greater than 8 years. These parameters were considered because we sought to perform the experiment in plantations already established and with some history with regard to coffee productivity.
The sequential climatic water balance (CWB) was estimated as outlined in Thornthwaite and Mather (1955), seeking to characterize the prevailing climate conditions during the experimental period in the region under study, especially in terms of the effect caused by the hydric deficiency with regard to the coffee productivity.
Data about rainfall and mean air temperature required for the estimation of the representative CWB in the region were obtained in the Principal Climatological Station, under the agreement established between the Federal University of Lavras (UFLA) and the Brazilian National Institute of Meteorology (INMET). This station belongs to the network of surface meteorological observations of the INMET located in the Campus of the UFLA, at the following geographical coordinates: 21º 14’ South latitude, 45º 00’ West longitude and 918.8 m elevation.
Phenological data about coffee tree productivity were collected in three different agricultural seasons as follows: Flowering (September-October), appearance of berries (December-January) and graining (February-March) of the crop seasons 2012/2013 and 2013/2014.
Four sampling points were randomly selected for each of 10 plots. These points consisted of eight planting lines clustered at pairs to form a planting space given by the spacing within parallel lines. Five plants per planting line were alternately taken in each planting space, at about 10 m from each other, totalizing 10 plants per planting space and 40 plants per sampling plot. Plagiotropic branches sampled at the third middle position of each coffee plant were directed to the center of the planting space.
Plants and planting spaces were randomly sampled within each plot, so that there was no need to identify plants in order to use always the same for data collection in different crop seasons. The following parameters were obtained: Number of flowers, berries and grain fruits found at the fourth and fifth productive nodes of each plagiotropic branch sampled in the study.
The fourth and fifth productive nodes were counted from the tip of the plagiotropic branch to the orthotropic branch, from the first node containing a flower or fruit. We counted all productive nodes in the sampled branches, represented by nodes containing flowers and/or fruits. Nodes with no flowers or fruits in the branches were also counted. These nodes consisted of spaces from which the abscission of flower and/or fruits occurred mainly due to the prevailing local meteorological conditions.
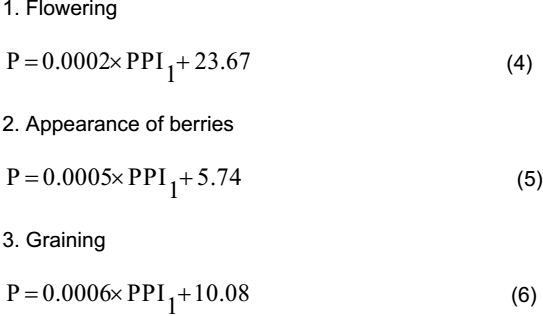
The height of sampled plants (meters) was measured using a graduated scale, and considering the vertical distance from the soil surface to the apical meristem at the tip of the plant. A representative model for productive vegetal areas (PVA), given by the Equation 1, was used to obtain phenological indices:
Where PVA is the productive vegetal area (m2.ha-1), SWL is the spacing within lines (meters), and MPH is the mean plant height (meters).
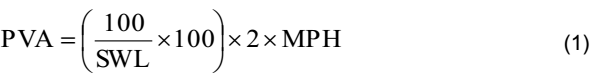
Equation 2 provides the Productivity Phenological Index #1 (PPI1):
Where PPI1 is the productivity phenological index #1 (number of fruits × m2), and AF45 is the average number of flowers and/or fruits found at the fourth and fifth productive nodes of all plagiotropic branches sampled in the plot.
Equation 3 provides the PPI2 obtained as product of PPI1 by number of flowers and/or fruits found at the productive nodes of the plagiotropic branch.
Where PPI2 is the productivity phenological index #2 [number of fruits × m2 × number of productive internodes]; and NPN is the number of productive nodes of the plagiotropic branch.
The coffee tree productivity per sampling plot, measured by sacks of benefitted coffee per hectare (sacks.ha-1), was obtained by means of consultation to owners and/or growers responsible for coffee farms.
Linear regression models were fitted to pairs of data about the observed productivity as function of productivity phenological indices (PPI1 and PPI2).
Three sampling plots were taken as reference to develop, by using a linear regression, and test statistically equations to estimate productivity phenological indices #1 and #2 best suited to the growing conditions of the Southern State of Minas Gerais, Brazil.
The initial assessment of the coefficient of determination (r2) allowed the testing of some combinations. However, the estimate of coffee tree productivity was obtained for combinations in which the coefficient of determination was greater. This estimate was obtained by using data collected in other seven sampling plots.
This process, known as cross validation, was performed as outlined in Mariano et al. (2014), who stated that data used in this process are randomly clustered in two distinct sets known as training and validation data sets.
The phenological models of productivity #1 and #2 were assessed using independent data of productivity collected in sampling plots during the experimental period. Results were evaluated by a regression based on the coefficient of determination (r2) and concordance index (CI) described in Willmott et al. (1985). The correlation coefficient (r) and the C index described in Camargo and Sentelhas (1997), obtained as product of r by CI, were also used.
The following parameters were also used to define the statistical quality of the model as described in Mariano et al. (2014): Mean error (ME), mean absolute deviation (MAD), mean absolute percentage error (MAPE), and mean square error (MSE). These parameters described measurements of the prediction error obtained from the existing difference between observed and predicted values.
Figure 1 shows the extract of the sequential climatic water balance (CWB) estimated for the three years comprised in the crop seasons 2012/2013 and 2013/2014. Estimates referring to hydric deficiency of 123 and 75 mm respectively for the years of 2012 and 2013 were kept within limits considered normal to attain water requirements for coffee tree, as outlined in Meireles et al. (2009). Regarding the year 2012, however, there was no rainfall record in August and September. The rainfall was only recorded from October 2012, what contributed to the delayed onset of the main flowering (Figure 1A).
A low rainfall index of 80 mm was recorded from February to March, either for 2013 or for 2014 (Figure 1B and C), while we expected the occurrence of hydric excess about 90 mm, an amount considered normal for these months. However, an excess less than 50 mm was recorded in 2013 and, a hydric deficiency around 20 mm was recorded in 2014. These records were less than the expectation, what affected the graining stage. This resulted in malformed fruits, low yields, and need for greater volume of farm coffee to fill up a sack with benefitted coffee.
In this context, we realized that rainfall is a limiting factor for a more consistent performance of this productivity estimation model because physical and chemical properties of coffee fruits were not considered in the study. Instead, were only considered the presence or absence of flowers and fruits in the coffee branches.
The hydric deficiency recorded in the year 2014 was 164 mm; however, greater than the limit considered acceptable (150 mm) according to the magnitude condition outlined in Camargo (1977). This deficiency was recorded from February to October, what is considered atypical for the region under study. In addition, the temperature remained up to 2°C above the mean (21.6ºC) normally recorded from January to March. This pattern caused an increase in the potential evapotranspiration on the period during which the fruits expansion would occur and, consequently, when the hydric demand was high.
Although high temperatures occurred in the period under study, the mean annual temperatures ranged within limits that characterize the aptitude for coffee growing as outlined in Pereira et al. (2008), since mean temperatures were 20.8, 20.3 and 21.0°C respectively for years 2012, 2013 and 2014.
Productivity levels recorded in the plots remained high for both crop seasons, with average of 36 sacks.ha
-1. However, a remarkable variability was found, with data ranging from 15.2 to 60.1 sacks.ha
-1. Thus, by analyzing data referring to these years, we could realize that there is an alternation between high and low production, that is, the coffee tree shows a bienniality for each plot
and each cultivar
Table 2 shows estimates of Productivity Phenological Index #1 (PPI1) and Productivity Phenological Index #2 (PPI2) obtained from Equations 2 and 3 for sampling plots under study. These estimates highlight the decreasing of the PPI1 and PPI2 from the stage of appearance of berries to the graining stage.
Similar results were described by Alfonsi (2008), who found a decreasing trend for PPI1 when analyzing data in the chronological order of their collection. This author described examples recorded in Graça/Marília and Campinas, regions of the State of São Paulo, Brazil. In these regions, he obtained greater records in December than in March for the same parameters.
In this study, we found an increasing of PPI1 and PPI2 from flowering to the appearance of berries. This result is contrary to that described in Alfonsi (2008), who found greater estimate in October than in December and, then, greater than that recorded in March. This decrease was because data collected in October reflect the potential of the first flowering. Then, due to climatic phenomena such as high temperature and hydric deficiency in the post-flowering period, the abortion and abscission of flowers can occur. This phenomenon can result in lower quantity of berries in December than the quantity of flowers produced in productive nodes.
In the physiological context, and considering that we were expecting a decrease of estimates of PPI1 and PPI2, we might infer that this decrease did not occur in this study because of the fall of too many flowers during data collection in different sampling plots. In addition, the irregular succession of flowering as function of time and localities may have contributed to the inadequate data collection in this phenological stage.
Equations 4 to 6 are related to the PPI1 and they resulted from linear regressions for three data sets referring to the best response for the interaction in the whole dataset. Estimates described above were obtained from these equations, which are considered to be models applied for each phenological stage.
Estimates obtained from these equations were equally similar to that found by using Equation 7 proposed by Fahl et al. (2005) to estimate the productivity in the graining stage as follows:
Miranda et al. (2014), aiming to develop a simple and accurate method to estimate the coffee production, also developed similar equations, inclusively with an angular coefficient equal to 0.00053 for the fruits expansion period.
Regarding the PPI
2, estimates of r
2 obtained in this study
were greater than those found by Alfonsi (2008) for flowering [0.2137], appearance of berries [0.8357] and graining [0.709]. This effect suggests a great PPI
2 potential for the estimation of coffee productivity in conditions under study.
Equations 8 to 10 describe models used in this study to estimate the coffee tree productivity, given the PPI2:
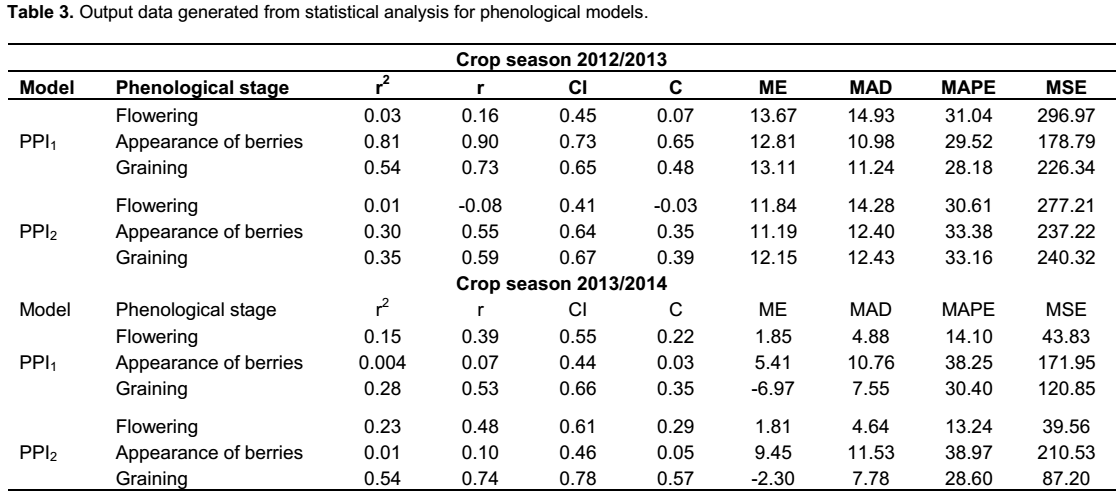
Models resulting from regressions established as function of the observed productivity and Productivity Phenological Indices #1 and #2 were tested with data obtained from other seven sampling plots (SP). Table 3 shows output data generated from statistical analysis for the assessment of phenological models.
PPI1 was highlighted by showing performance better than PPI2 in the crop season of 2012/2013. This evidence can be better shown by comparing estimates of r2, r, CI and C, once statistical indices related to the difference between the observed and estimated values showed very similar patterns.
Regarding the existing similarity between PPI1 and PPI2, we found that both indices were unable to predict the productivity in the flowering stage. This was because of the long period recorded from the flowering to harvesting. Besides, the flowering was not found to be good parameter to describe the coffee tree productivity with good accuracy, due to factors related to the plant physiology, interference of climate factors, and difficulties for data collection.
Table 3 shows the performance of models for PPI1 and PPI2 estimated for the crop season 2013/2014. This performance did not come up to the estimate found in the previous crop season, probably because of adverse and atypical weather conditions recorded in the region during the experimental period.
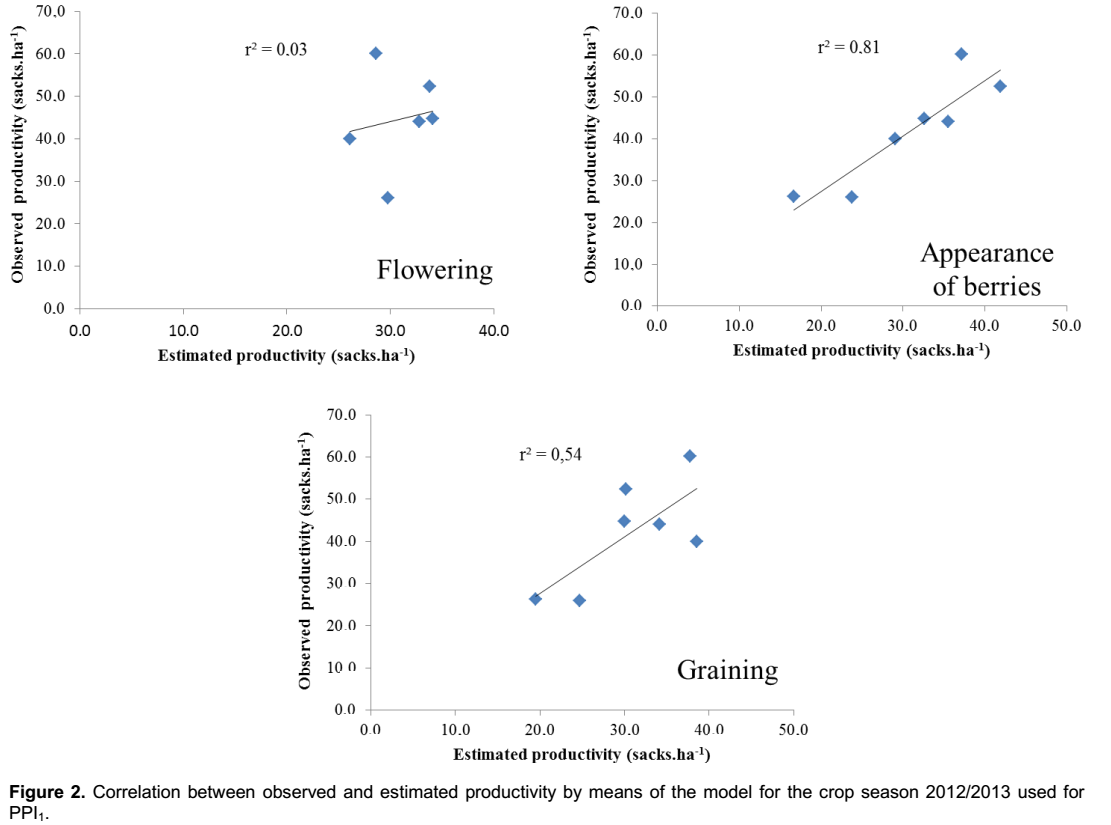
Figure 2 shows regressions developed as function of observed and estimated productivity, with respective values of r2 for each phenological stage of the crop in the crop season 2012/2013, by using PPI1. This was because results found in this crop season were greater than those found in the crop season 2013/2014.
The performance of the model for the stage of appearance of berries was even greater than that referring to the graining stage. This result was not expected due to the existing proximity between the graining stage and harvesting. However, this can be explained by the excessive rainfall, about 499.7 mm, recorded in January 2013 as provided by the Principal Climatological Station, under the agreement established between the UFLA and the INMET. Thus, this rainfall may have probably intensified the abscission of berries in some localities. In addition, it might have caused damages on plants, thus, limiting the possibility of success to complete the crop production cycle, with adequate maturation of fruits.
Regarding the crop season 2013/2014, the atypical weather conditions recorded in the region during the experimental period caused an increased data dispersion,
suggesting that the model is inaccurate in these conditions. However, differently from previous situation, the performance of the estimate was found to be worse in the stage of appearance of berries.
Alfonsi (2008) points out that these variations can be attributed to the sample size, which can have great variation during the extrapolation process from a small sample size to a larger size sample.
Figure 3 shows the regression developed as function of observed and estimated productivity, with respective values of r2 observed for each phenological stage of the crop in the crop season 2013/2014, by using PPI2. This figure also shows that the PPI2 showed a moderate performance in the prediction of productivity when used in the graining stage. This effect suggests a great PPI2 potential for the estimation of coffee productivity in the graining stage, as well as in adverse weather conditions. In fact, this was the only moment in which the r and CI indices were approximately equal to one.
However, the quality of this idea should be improved along with the possibility of inserting an index related to the penalization of productivity, resulting from the effect of adverse weather phenomena.
Therefore, we can infer that none of crop seasons under study allowed obtaining a high performance model as those described in Oliveira (2007), which were obtained by using the equation P = 0.0004×PPI for the month of December, and P = 0.0005×PPI for the month of March. This author found estimates of r2 ranging from 0.95 to 0.99. In addition, he found that the estimated productivity was always equal to the observed productivity for 93 plots under study.
The model validated in this study was found to be suitable for crop management conditions, cultivars and edaphoclimatic conditions of the region under study. However, the performance of the model was affected by adverse weather conditions recorded in the region during the experimental period. The estimate of coffee tree productivity obtained by counting flowers of productive nodes did not allow obtaining satisfactory results for any situation. Thus, these results did not suggest any possibility of recommending the use of this method. Predicting the productivity of coffee plots with good confidence level, up to six months in advance, is found to be possible, since phenological data are collected in the stage of appearance of berries. Productivity Phenological Indices #1 and #2 showed good correlation with crop productivity therefore these indices are considered to be good indicators for coffee productivity estimation processes.
The authors have not declared any conflict of interests.
The doctoral scholarship was provided by the Coordination for the Improvement of Higher Education Personnel (CAPES) to the first author. The productivity grant was provided by the National Council for Scientific and Technological Development (CNPq) to the second author, by means of the process no 306204/2012-6. The project was funded by the Research Support Foundation of the State of Minas Gerais (FAPEMIG), by means of the process no CAG-APQ 01670/13.
REFERENCES
|
Alfonsi EL (2008). Uso de índices fenológicos em modelos de previsão de produtividade do cafeeiro. 2008. 104 p. Tese (Doutorado em Fitotecnia) - Escola Superior de Agricultura "Luiz de Queiroz", Piracicaba. Available at:
View
|
|
|
|
Camargo AP (1977). Zoneamento da aptidão climática para a cafeicultura arábica e robusta no Brasil. Rio de Janeiro: Fundação IBGE 76p.
|
|
|
|
|
Camargo AP, Sentelhas P (1997). Avaliação do desempenho de diferentes métodos de estimativa da evapotranspiração potencial no estado de São Paulo, Brasil. Rev. Bras. de Agrometeorologia 5:89-97.
|
|
|
|
|
Camargo MBP, Rolim GS, Santos MA (2007). Modelagem agroclimatológica do café: estimativa e mapeamento das produtividades. Informe Agropecuário 28:58-65.
|
|
|
|
|
Carvalho HP, Melo B, Rabelo PG, Silva CR, Camargo R (2011). Índices bioclimáticos para a cultura de café. Rev. Bras de Engenharia Agríc. Ambient. 15:601-606.
Crossref
|
|
|
|
|
Carvalho LG, Sediyama GC, Cecon PR, Alves HMR (2005). Aplicação da análise harmônica por séries de Fourier para a previsão de produtividade da cultura do café no estado de Minas Gerais. Engenharia Agríc. 25:732-741.
Crossref
|
|
|
|
|
FahL JI, Carelli MLC, Alfonsi EL, Camargo MBP (2005). Desenvolvimento e aplicação de metodologia para estimativa da produtividade do cafeeiro, utilizando as características fenológicas determinantes do crescimento e produção em duas épocas de avaliação. In: Congresso Brasileiro De Pesquisas Cafeeiras, 31., 2005, Guarapari-ES. Trabalhos apresentados... Rio de Janeiro: MAPA/Fundação Procafé 339-341.
|
|
|
|
|
Mariano FCMQ, Lima RR, Alvarenga RR, Rodrigues PB, Lacerda WS (2014). Neural network committee to predict the AMEn of poultry feedstuffs. Neural Comput. Appl. 25:1903-1911.
Crossref
|
|
|
|
|
Meireles EJL, Camargo MBP, Pezzopane JRM, Thomaziello RA, Fahl JI, Bardin L, Santos JC, Japiassú LB, Garcia AWR, Miguel AE, Ferreira RA (2009). Fenologia do cafeeiro: condições agrometeorológicas e balanço hídrico do ano agrícola 2004-2005. Brasília, DF: Embrapa Informação Tecnológica 128 p.
|
|
|
|
|
Miranda JM, Reinato RAO, Silva AB (2014). Modelo matemático para previsão da produtividade do cafeeiro. Revista Bras. de Engenharia Agríc. Ambient. 18:353-361.
Crossref
|
|
|
|
|
Nunes FL, Camargo MBP, Fazuoli LC, Rolim GS, Pezzopane JRM (2010). Modelos agrometeorológicos de estimativa da duração do estádio floração-maturação para três cultivares de café arábica. Bragantia 69:1011-1018.
Crossref
|
|
|
|
|
Oliveira DA (2007). Estimativa da produção de café por meio de índice fenológico. 2007. Dissertação (Mestrado em Fitotecnia) – Universidade Federal de Lavras, Lavras. 28 p.
|
|
|
|
|
Pereira AR, Camargo AP, Camargo MBP (2008). Agrometeorologia de cafezais no Brasil. Campinas: Instituto Agronômico 125p.
|
|
|
|
|
Picini AG, Camargo MBP, Ortolani AA, Fazuoli LC, Gallo PB (1999). Desenvolvimento e teste de modelos agrometeorológicos para a estimativa de produtividade do cafeeiro. Bragantia 58:157-170.
Crossref
|
|
|
|
|
Rosa VGC, Moreira MA, Rudorff BFT, Adami M (2010). Estimativa da produtividade de café com base em um modelo agrometeorológico-espectral. Pesquisa Agropecuária Brasileira 45:1478-1488.
Crossref
|
|
|
|
|
Sáenz JRR, Pulgarín JA, Restrepo ECM (2008). Estimación de la producción de café con base en los registros de floración. Cenicafé 59:238-259.
|
|
|
|
|
Santos MA, Camargo MBP (2006). Parametrização de modelo agrometeorológico de estimativa de produtividade do cafeeiro nas condições do estado de São Paulo. Bragantia 65:173-183.
Crossref
|
|
|
|
|
Sette RS, Andrade JG, Teixeira JERL (2010). Planejamento e gestão da propriedade cafeeira. Lavras: UFLA 163 p.
|
|
|
|
|
Silva SA, Lima JS, Oliveira RB (2011). Modelo agrometeorológico na estimativa da produtividade de duas variedades de café arábica considerando a variabilidade espacial. Irrigation 16:1-10.
Crossref
|
|
|
|
|
Thornthwaite CW, Mather JR (1955). The water balance: Publications in climatology. New Jersey: Drexel Institute of Thechnology 104 p.
|
|
|
|
|
Willmott CJ, Ackleson SG, Davis RE, Feddema JJ, Klink KM, Legates DR, O'Donnell J, Rowe CM (1985). Statistics for the evaluation and comparison of models. J. Geophys. Res. 90:8995-9005.
Crossref
|
|
|
|
|
Zacharias AO, Camargo MBP, Fazuoli LC (2008). Modelo agrometeorológico de estimativa do início da florada plena do cafeeiro. Bragantia 67:249-256.
Crossref
|
|