ABSTRACT
Four different nitrogen levels and four plant spacing were studied in 4×4 factorial arrangements in randomized complete block design with three replications. The highest yield, number of tuber, number of tuber and dry weight of tuber were obtained with application of jointly 100 and150 kg/ha nitrogen. Increasing plant density resulted in higher tuber yield, dry weight of tuber and total dry matter yield. Increasing nitrogen fertilizer rate 100 up to 150 kg/ha increased mean tuber weight and total dry matter yield. Since, 100 and 150 kg/ha nitrogen had no significant difference to each other producing the highest tuber yield and number of tuber, so in order to prevent environmental pollutions and excessive costs, utilization of 100 kg/ha nitrogen is recommended and any reduction in the planting density lower than 75×30 cm will lower both total yield and % marketable yield. So, 30 cm planting densities' producing the highest yield makes it suitable for planting. The combined effect of different level of nitrogen and plant spacing revealed that the highest nitrogen dose 150 kg/ha applied at the closest 75 cm × 10 cm gave the highest yield of tuber (10377.78 kg/ha). The narrower spacing of 10 cm produced numerous small-sized potatoes. These small-sized potatoes fell in grades that are not commercially accepted. The treatment combination, 150 kgN/ha applied at 75 cm × 20 cm spacing gave the second highest yield of tuber (9214.81 kg/ha). As the spacing increased to 30 cm, and with increasing nitrogen the tuber size increased with more potatoes falling in the acceptable grades. Yield of tuber per hectare was significantly and positively correlated with plant height, number of stem per plant, fresh weight, number of tuber and weight of tuber per plant. The highest marketable tuber yield of 4144.44 per plot was produced at 30 cm spacing, and the lowest marketable tuber yield was obtained at 75 cm × 10 cm (1111.11).
Key words: Yield, plant spacing, fertilizer rates.
The food needs of the growing population required a growth in agricultural production to achieve food security and sustain high economic growth levels with the aim ending poverty (Tesfaye et al., 2013). The yield potential of potato is about six to seven times more compared to that of rice and wheat from a unit area and time resulting in about five fold more benefit. Therefore, potato can play a vital role in national food and nutritional security and poverty reduction. Agriculture is the mainstay of the Ethiopian economy; horticultural crops production is one of the components of the Ethiopian agriculture, of which potato crop production is a major activity. Potato (Solanum tuberosum L.) belongs to the family Solanaceae and is a close relative of tomato, eggplant, pepper, tobacco and the wild nightshade (Abay and Sheleme, 2011). World annual production of potato is about 330 million metric tons with area coverage of 18,651,838 ha. In Africa total production of potato is about 17,625,680 tones with total area coverage of 1,765,617 ha. In Ethiopia total production is around 572,333 tons on area coverage of 69784 ha.
Potato grows best on light soils with good aeration of the root system that helps maintain high tuber bulking rates, resulting in higher yields per unit area. However, the growing population pressure in the Ethiopian highlands is forcing farmers to grow potato on vertisol that covers about 7.6 million ha, of which 2 million hectare is under cultivation.
In potato production, nitrogen (N) is applied more frequently and in greater amounts than any other nutrient. It is also the nutrient than most often limits yield .without added nitrogen, growing plants often show a N deficiency characterized by yellow leaves, stunted growth, and lower yields, because it is an important input, N and factors affecting its availability have been the subject of much investigation (Yenagi et al., 2005). Excessive N fertilizer applied at or before tuberization can extend the vegetative growth period and delay tuber development, resulting in a lower tuber yield. Nitrogen is a mobile nutrient in the soil and its excess can lead to losses via leaching or surface run off. These factors make the appropriate N rate critical for successful potato. General fertilizer best management practices (BMPs) to help assure that the right source of nutrient is applied at the right rate, at the right time, and in the right place is contributing to the productivity, profitability, and sustainability of the potato production system. Though, farmers in study area have the awareness of the potato response to applied nutrients and they planted the crop in homesteads and irrigable areas using organic manure and commercial fertilizer, they are not acquainted with the type and the rate of fertilizers to be applied for the potato plant. Therefore, plant density and nitrogen level have to be regulated for higher yield. Thus, the knowledge of the relationships among these factors and yield is helpful to optimize potato yield through effective use of land and rate of fertilizer. Based up on the above explained problems the present study was aimed to evaluate the effect of different plant density and nitrogen rates on yield and yield components of potato.
Description of the study area
The field experiment was Holeta Agricultural Research Center (HARC), West Showa Zone of Oromia regional state during 2014 cropping season. Holeta is located in the Oromia special zone surrounding Finfinne of the
Oromia Region. It has a latitude and longitude of 9°3′N 38°30′E/ 9.050°N 38.500°E and an altitude of 2400 m above sea level. The average annual temperature of the experimental site ranges from 6.1 to 22.2°C. Distribution of rainfall varies from one season and the Woreda has bio-modal rainfall, that is, Belg rainfall (February to April) and Mehar rainfall June to October.
Materials used for the experiment
Planting material
The potato variety named Gudanne, which was developed and released by Holeta Agricultural Research Centre in 2006, was used for the experiment.
Fertilizer material
Urea (46% N) and TSP (46% P2O5) were used as a source of nitrogen and phosphorus nutrient elements.
Experimental design and treatment
This research was designed to evaluate potato responsiveness to several rates of nitrogen (0, 50, 100 and 150 kg ha-1) the source of nitrogen was urea fertilizer and four levels of plant spacing: 10, 20, 30 and 40 cm per row. Potato variety Gudenne was used for the experiment since it is one of the potential potato cultivars for central highlands of Ethiopia including Holeta area. The total number of plots was 48 and the size of the unit plot was 3 m × 3 m (9 m2) areas and each accommodates 4 rows of plants. The experiment was laid out in 4×4 factorial arrangements using Randomized Complete Block Design (RCBD) with three replications. A distance of 1 m was maintained between the plots and within a block 1.5 m distance was maintained between blocks and 75 cm row spacing was uniformly used. Well sprouted uniform tuber seeds of potato variety Gudenne were planted at 12 cm depth in June 24, 2014 as per the experimental details. Cultivation, weeding and harvesting was done at the appropriate time, uniformly.
Land preparation
Land of the experimental area was prepared inaccordance with a standard practice used; i.e. the experimental plot was ploughed three times. This was carried out using a tractor plough two times at the depth of 30 to 35 cm and the land was leveled and ridges were made by hand.
Fertilizer application
Nitrogen fertilizer was applied half rate at the time of planting and the remaining half of nitrogen was applied 45 days after planting and the source of nitrogen was urea fertilizer. Phosphorus was applied to all plots equally at the rate of 90 kg TSP (triple-superphosphate).
Data collection
To evaluate the effect of plant spacing and nitrogen application on potato growth and yield, data was collected for growth parameters such as days to flowering, days to maturity, plant height, number of main stem (Bleasdale and Thompson, 1969) and yield parameters such as number of tubers per plant, marketable tuber yield, unmarketable tuber yield, average tuber weight and total tuber yield were recorded from ten randomly selected plants of the two middle rows except at the total tuber yield data which is taken per plot basis as per the procedure of
Zelalem et al. (2009). The following data were collected:
1. Days to flowering: These were recorded when 50% of the plant population attained the flowering stage based on visual observation.
2. Plant height (cm): Plant height was determined by measuring height from the base of the main shoot to the apex at full blooming by taking three sample plants from each plot.
3. Stem number per plant: This was recorded as average stem count of five hills per plot at 50% flowering.
4. Days to maturity: Days to physiological maturity was recorded when the leaves of 50% of the plants in the plot turned yellowish or starting senescing based on visual observation.
5. Above ground (Shoot) biomass: Fresh weight was taken from five sample plants six weeks after flowering when the plant was fully developed and practically ceased its vegetative growth, then dry weight was measured after oven drying at 105°C to constant mass.
6. Average tuber weight: Average tuber weight was determined on the basis of total tuber weight produced per plant/total tuber number counted per plant at harvest.
7. Weight of marketable tubers: Healthy tuber with a size more than or equal to 31 g weighed using sensitive balance from five sample plants at harvest.
8. Weight of unmarketable tubers: Under-sized tubers (< 30 g) as well as diseased, cracked and rotten were measured at harvest were categorized as unmarketable.
9. Total tuber yield: Marketable and unmarketable tubers were taken at harvest.
10. Tuber size grades: Based on the weight of tubers, 5 categories of tuber size (< 30 g, 31-50 g, 51-70 g small, medium and large was recorded, respectively.
11. Tuber dry matter content (%): Dry weight was measured by taking three fresh tubers per plot and weighing at harvest, then they was thinly sliced into 6 to 8 pieces and air dried for two days and subjected to oven drying at 105°C until a constant weight was obtained.
Data analysis
All crop data collected were subjected to analysis of variance (ANOVA) using general linear model (GLM) procedures with the help of software SAS version 9.1.3 (SAS Institute, 2002). Means separation for significant treatment effects was carried out using the least significant difference (LSD) test at 5% level of significance.
Effect of Nitrogen level on yield and yield components of potato
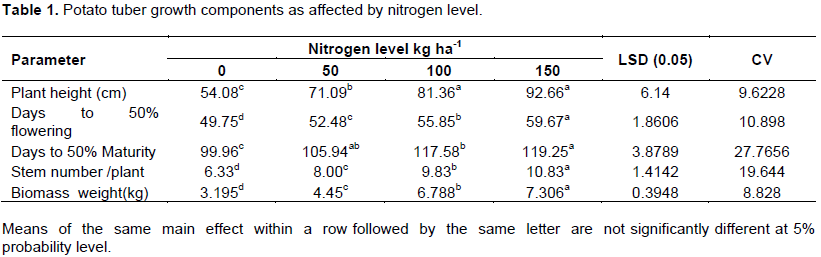
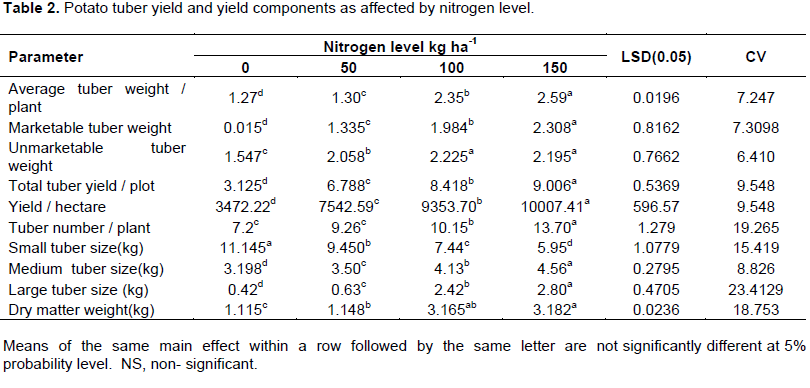
The values of all growth and yield parameters gradually increased with the gradual increase of nitrogen level and plant spacing. The maximum plant height (92.66 cm) was recorded against the application of 150 kgN/ha which was statistically higher than rest of the treatments and the minimum (54.08 kg) was found in the application of 0 kg N/ha. The highest number of stem per plant (10.83) was obtained when the highest rate of nitrogen (150 kg N/ha) was applied and the lowest (6.33 kg) was found in the control (0 kg N /ha) (Table 1). The maximum tuber weight of potato (3.35 kg/plant) was obtained from the application of (150 kg N/ha) and the lowest (1.02 kg/plant) from the control.

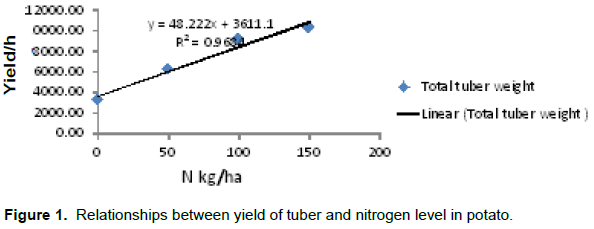
The highest average tuber weight (2.59 kg) was obtained when the highest rate of nitrogen (150 N/ha) was applied and the lowest (1.27 kg) was found in the control (0 kg N/ha). The maximum marketable tuber yield (2.308 kg/plant) was obtained from the application of (150 kgN/ha) and the lowest (0.15 kg/plant) from the control. The higher dose of nitrogen 150 kg N /ha produced on average weight (9.06 kg) total tuber yield per plot that was higher than produced 50 kg N /ha while the control treatment produce the lowest total tuber weight (3.125 kg). The maximum tuber number per plant (13.70 kg) was obtained from the highest level of nitrogen 150 and 0 kgN/ha gave the lowest number of tubers per plant (7.2 kg). The maximum yield of potato tubers (10007.41 kg) was obtained when the crop received 150 kgN/ha and the lowest tuber yield (3472.22 kg) was found in the control (Table 2). When the data on yield of tuber per hectare was regressed against the different level of nitrogen, a linear relationship was obtained between them. It was evident from Figure 1 that the equation Y = 48.22x + 3611 gave a good fit to the data and the co-efficient of determination r = 0.968 showed that the increase in tuber yield per hectare occurred due to the application of nitrogen was justifiable.

Rainfall
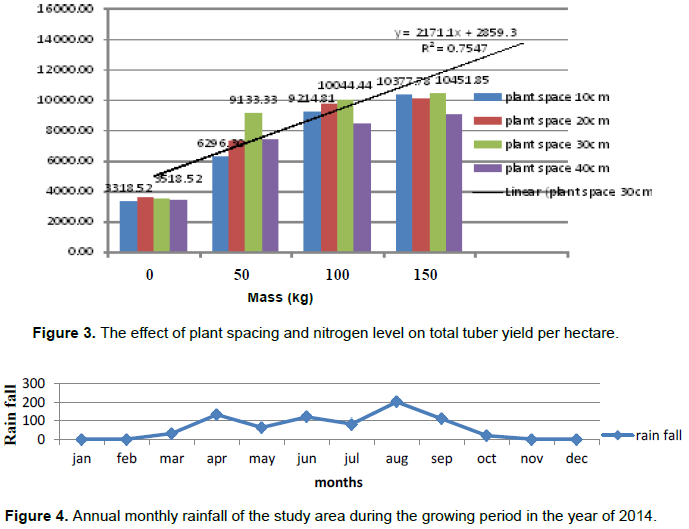
Climatic condition of the study Woreda is divided in to two agro-climatic zones .These is Dega, and Woina Dega. Dega part gets the maximum rainfall annually. Distribution of rainfall varies from one season to another as that of other area in Ethiopia and basically the Woreda has bio-modal rainfall, that is, Belg rainfall (February to April) and Mehar rainfall June to October. Rainfall annual average was 1100 mm in the year 2014 (Figure 4).
Effect of plant spacing on yield and yield components of potato
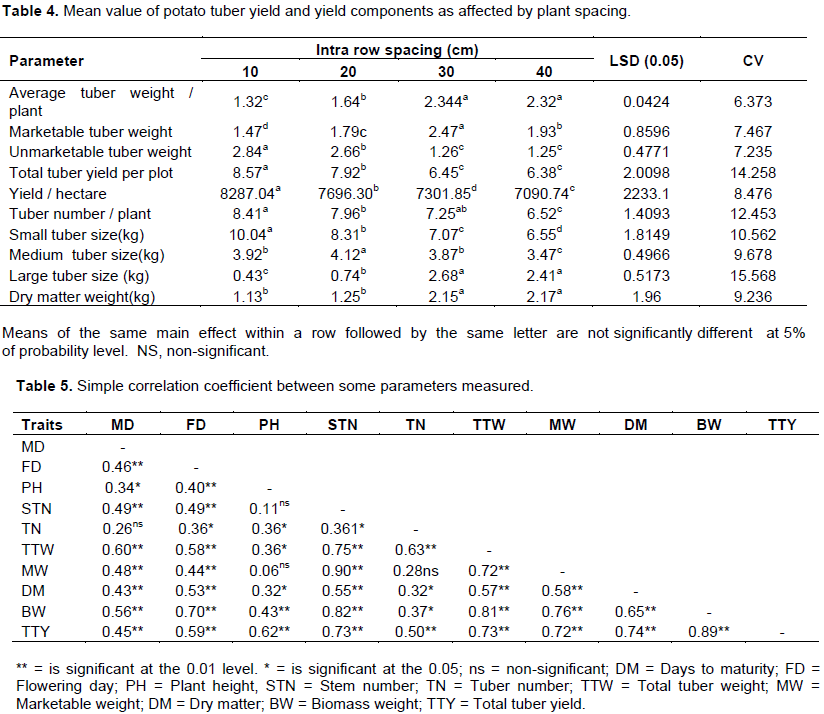
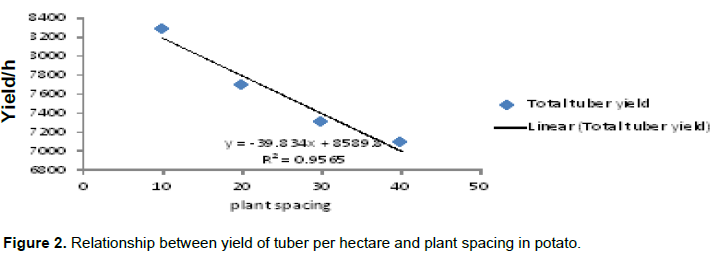
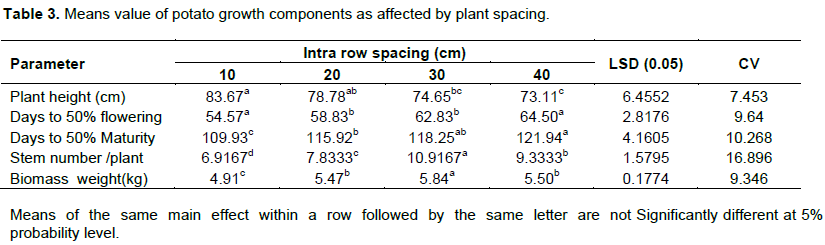
Plant density in potato affects some of important plant traits such as total yield, tuber size distribution and tuber quality. Plant spacing is another factor which significantly influences all the parameters of growth and yield under study where the closest spacing 10 cm produced tallest plants (83.67 cm) which was significantly different from the widest spacing 40 cm (73.11 cm). The maximum stem number per plant (12.66) was found at spacing of 40 cm (Table 3). The maximum tuber number per plant (8.41 kg/ plant) was obtained from the narrow spacing 10 cm; in addition to this, the tuber number per plant gradually declined with the increase in plant spacing 40 cm (6.52 kg/plant). Plant spacing of 30 cm gave the highest marketable tuber per plant (2.47 kg/) this was significantly higher than tuber per plant obtained from other plant spacing used. The maximum average weight of tubers per plant (2.344 kg/plant) was produced by the plant having the widest spacing 30 cm and the minimum weight of tubers (1.32 kg/plant) was found in the closest spacing 10 cm. The highest yield of tuber (8287.04 kg/ha) was obtained from the closest spacing 10 cm and the lowest (7090.74 kg/ha) was in the widest spacing, 40 cm (Table 4).

The narrower spacing of 10 cm produced numerous small-sized potatoes. These small-sized potatoes fell in grades that are not commercially accepted. As the spacing was increased to 30 or 40 cm, the tuber sized increased with more potatoes falling in the acceptable grades. The better grades were produced by the wider spacing of 40 cm with very few tubers. The value of correlation coefficient indicated that yield of tubers per hectare was positively and significantly correlated with plant spacing.
A negative linear relationship was observed between yield of tubers per hectare and plant spacing when the data was regressed (Figure 2). It was obvious that the equation Y = 39.83x + 8589 gave a good fit to the data and the value of the co-efficient of determination r = 0.956 showed that a significant increase in tuber yield per hectare occurred at closer spacing was justifiable.
Effect of Nitrogen rate and plant spacing on yield and yield components of potato
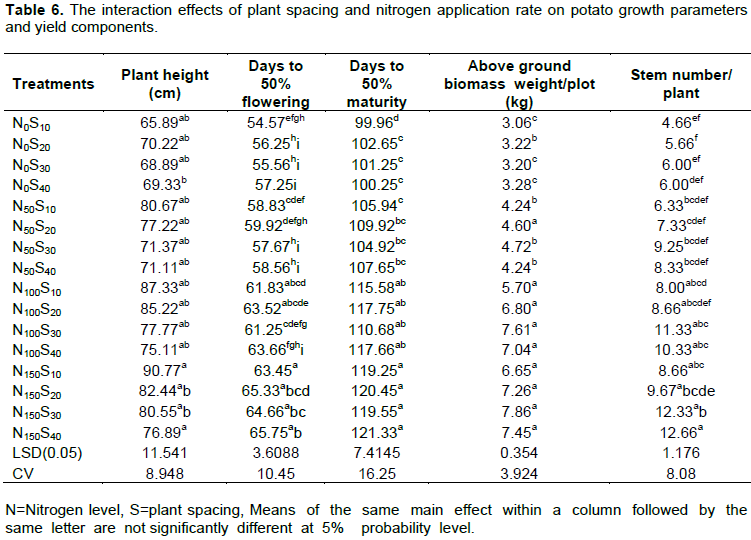
Most of the growth and yield parameters of var. Gudanne were significantly influenced by the combined effects of different level of nitrogen and plant spacing as presented in Tables 6 to 8 and Figure 3.
Days to 50% flowering
Number of days to 50% flowering was significantly influenced by the planting density and quantity of fertilizer applied (Table 3). The number of flowers was observed to be higher in lower planting density than the higher planting density. The earliest days to 50% flowering was observed at intra spacing of 10 and 20 cm; whereas, days to 50% flowering was prolonged in 30 and 40 cm intra row spacing. Days to flowering was delayed by about 11.66 days in the wider spacing as compared to the closest intra row spacing of 10 cm. Generally, the flowering days decreased with lower planting density but increased as fertilizer application rate increased.

Plant height
Plant spacing of 10 cm produced plant height (90.77 cm). Nitrogen levels affected the plant height significantly. Application of N at the rate of 150 kg/ha resulted in significantly higher plant height; whereas the minimum plant height was recorded in check plots. The highest plant height was observed from a combination of 10 cm with 150 kg N/ha. Plant height responded highly and significantly to the main effects of plant spacing and nitrogen application rates (Table 4). Decreasing plant spacing from 40 to 10 cm resulted in significant increase in pant height from 76.89 to 90.77 cm. The rates of nitrogen from 0 to 150 kg N ha-1 to increased plant height from 68.89 to 80.55 cm.
Stem number
The observed treatment means of main effects of plant spacing and nitrogen application rate had significant influence on stem number per plant (Table 6). Stem number increased with increasing plant spacing and nitrogen rate at 10 cm (8.66) and 30 cm (13.66) when stem number was considered per unit plant.
Maturity day
Plant maturity days decreased with higher planting density but increased with increasing fertilizer application rate up to 150 kg. Days to 50% maturity prolonged with increased nitrogen rates (Table 6). Hence, increasing nitrogen rates from zero to 150 kg N ha-1 delayed days to 50% maturity from 99.96 to 121.33.
Aboveground (shoot) biomass
The observed interaction effects of plant spacing and nitrogen application rate on the weight of shoots are indicated in Table 4. Biomass weight significantly increased with increasing nitrogen and planting density. In general, the highest yield of biomass (3.67) was recorded for 30 cm intra row spacing and 150 kg N ha-1 treatment combination. The lowest yield of biomass (1.83) was observed for the treatment combinations of 10 cm intra row spacing with no nitrogen application.
Tuber number
Number of tuber for nitrogen level and plant density was significant (P<0.05). The highest number of tuber (10.46) was recorded at the closest spacing of 10cm with 150 kg N/ha treatment combination whereas the lowest number of tubers per plant (6.00) was obtained at the wider spacing of 40 cm with no nitrogen.
Average tuber weight
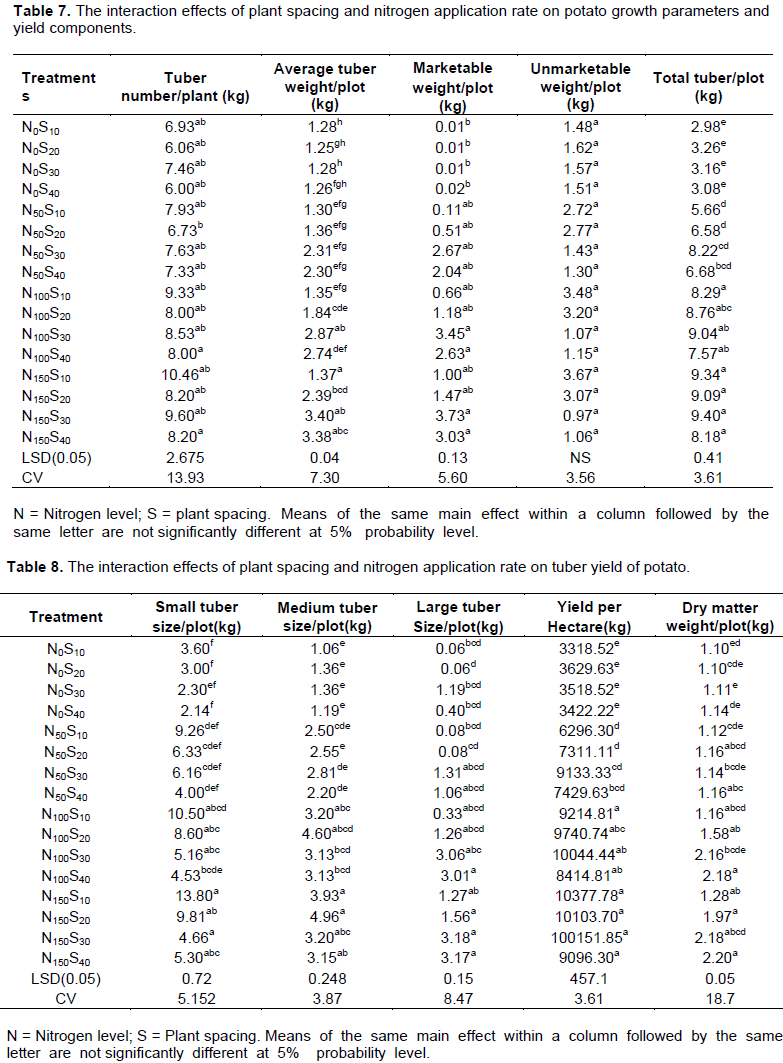
The effects of plant spacing and nitrogen application rate P<0.05) was significant on average tuber weight as shown in Table 7. Hence, maximum average tuber weight (3.40 kg) was observed for treatment combinations of 30 cm spacing and 150 kg N ha-1. Low average tuber weight (1.20 kg) was recorded at 10 cm intra row spacing with no nitrogen application.
Marketable and unmarketable tuber yield
The higher marketable tuber yield (3.73 kg) was obtained at the wider spacing of 30 cm with increasing nitrogen level whereas the lowest (0.01) was obtained at the closer spacing of 10 cm with no nitrogen application. The highest unmarketable tuber yield (3.67 kg) was obtained at the closer spacing of 10 cm (Table 7).
Total tuber yield
The highest tuber yield per hectare (10377.78 kg) was obtained at the closer spacing of 10 cm with increasing nitrogen level whereas the lowest (3422.22 kg) was obtained at wider spacing of 40 cm with zero nitrogen (Figure 2). With increasing nitrogen application, the number of stem including tuber, number of tubers and consequently yield were increased.
Potato tuber yield in different size classes
Small tuber size (< 30 g)
The two way interaction effects also increased the yield of small size tubers at closer spacing with high nitrogen level (Table 8). In general, the highest yield of small tuber size (13.80 kg) was observed for the treatment combination of 10 cm intra row spacing with150 kg N ha- 1. The lowest yield (2.14 kg) was recorded for the treatment combinations of 40 cm intra row spacing and 150 kg N ha-1.
Medium tuber size yield (31 to 50 g)
The interaction effects of intra row spacing and nitrogen application rate had highly significant influence on medium sized tuber yield (Table 8). Generally, maximum yield of medium size tubers (4.96 kg) was recorded for closer wider intra row spacing (20 cm) and 150 kg N ha-1 treatment combination. Low yield of medium size tuber (1.19 kg) was observed for treatment combination of 40 cm intra row spacing with no nitrogen application.
Large tuber - size yield (51 - 70 g)
The interaction effects of nitrogen application rate affected the yield of large tuber size highly and significantly. Large tuber size yield increased at wider planting density with high nitrogen level. Thus, the highest large tuber size yield (3.18 kg) was recorded at 30 cm intra row spacing and 100 kg N ha-1. Low yield of large tuber size (0.33 kg) was observed at high planting density 10 cm intra row spacing with no nitrogen application.
Dry matter content of tubers
Table 8 Effect of plant density and nitrogen level on this trait was significant (P<0.05). The highest tuber dry matter yield (2.20 kg) was recorded for the treatment combinations of 30 cm intra row spacing with 150 kg N ha-1. Conversely, the lowest yield of dry matter (1.16 kg) was obtained from 10 cm intra row spacing with no nitrogen treatment combination. Therefore, increasing the applied nitrogen from 0 to 150 kg N ha-1 increased tuber dry matter percentage.
Simple correlation between total tuber yield and yield related trait of potato
From the correlation (Table 5), parameters with each other and total tuber yield is positive correlation significant, except harvest index, has a negative correlation non-significant with total tuber yield. Plant
height, total tuber weight, dry matter, biomass weight and number of stem and tuber had the highest correlation with yield. This result represents a very positive impact on these parameters is increased total tuber yield.
Effect of nitrogen level on yield and yield components of potato
Nitrogen fertilizer increases the leaf area which enables for higher amount of solar radiation interception and dry matter accumulation and consequently, increases plant height and dry matter production of different plant parts, days to flowering, days to physiological maturity in line with the report of Tisdale et al. (1995) which says maintaining adequate levels of soil fertility has been recognized as one of the management practices that affect growth, development and yield of plants. Therefore, nitrogen is the motor of plant growth and being the essential constituent of protein, it is involved in all the major processes of plant development and yield formation. Report of Iritani (1972) also support the present result as nitrogen application increase the total yield of potato and total tuber number and size of tuber increase with increasing rates of nitrogen. Thus, the rate of nitrogen fertilization is a very important consideration in managing fertility, because excessive applications delay maturity and reduce the partitioning of dry matter to the tubers (Berga et al., 1994).
Effect of plant spacing on yield and yield components of potato
Increase in number of tuber occurred as a result of increase in number of planting density, eventually increased tuber yield. Tuber, and consequently, number of produced tuber per stem, is increased. Plant density, directly affects the tuber size by altering the number of the tuber size by each plant which in turn depends up on stem density, spatial arrangement variety and season (Menberu et al., 2012). Variation in the spacing of seed pieces may have considerable impact on premiums or deductions, for instance, changing from a closer to wide spacing may decrease the total yield, thus decreasing the base payment, while at the same time may increase the percentage of oversize tubers and reduce the yield of small tubers, thus increasing the net return to the grower. As the yield of ware-sized tubers decreases at high plant population it would be expected that the yield of seed-sized tubers would increase as stem number per hectare increases (Birch et al., 1967).
The quantity of seed planted per hectare will have a considerable effect on average tuber size and yield. The tuber size grading is influenced by two major factors, total yield and the number of tubers. Decrease the spacing between plants or increase plants density more than desirable, due to increased competition between the plants, the plants will reduce the amount of dry matter, although dry matter per unit area increases as report of Iritani (1968) and Kleinkopf et al. (1981) saying the number of tubers is highly dependent on plant density and yield of oversize tubers is substantial only at low densities.
Days to 50% flowering
The present result of days to 50% flowering (65.75) at 40 cm plant spacing with 150 N is in agreement with the findings of Ojala et al. (1992) who observed that high N levels promoted excessive vegetative growth and delayed flowering. This could be due to higher competition of plant for resource in the closer intra row spacing that lead the plant to stress and ultimately the plants flower early instead of prolonged vegetative growth.
Plant height
The (90.77) value of the present result is showing that plant height increased by increasing N application. As concluded by Khalafalla (2001), increasing nitrogen produces taller plants, longer internodes more sympodial axillary branches. The increased plant height at wider spacing may be due to the fact that relatively more available nitrogen and other plant nutrients available per plant than the closer spacing.
Stem number
The 12.33 value of stem number indicating that the number of stems per plant was influenced by plant density or level of fertilization. In a separate study Lynch and Rowberry (1977) observed increased branch development at higher fertility levels and wider spacing, and they concluded that this may be a form of compensatory growth and the relationship between auxiliary branch development and plant density ensured a similar leaf area index over a range of plant densities. Therefore, variation in the number of stems per plant may be associated with variation in their seed size and performance.
Maturity day
Increasing applied nitrogen from zero to 150 kg N ha-1 delayed days to 50% maturity from 99.96 to 121.33. This is due to the fact that nitrogen dressing stimulates growth; prolong the growing period and delays tuber formation or crop maturity. The present result was in line with the report of Berga et al. (1994) which says excessive applications delay maturity and reduce the partitioning of dry matter to the tubers. Nitrogen fertilization delayed flowering and prolonged the time required by the potato crop to reach physiological maturity.
Aboveground biomass
Increasing nitrogen produces taller plants, longer internodes more axillary branches, higher leaf biomass, higher stem biomass, lower leaf: Stem ratios, higher root biomass, higher shoot: root ratios which is associated with the increased partitioning of dry matter to shoots rather than tubers. It resulted in a great increase in shoot biomass from high application of nitrogen. Generally, leaf area from plants heavily fertilized with nitrogen was very high compared to those that receive none. The increment of biomass yield per plant was also more apparent in plants from wider spacing. This is also may be due to less competition between plants at lower density that resulted in abundant vegetative growth for higher biomass production. The result of the present study has consistency with findings of Saluzzo et al. (1999) who noted nitrogen fertilization increased biomass accumulation in the canopy, interception of more photo synthetically active radiation, use of efficient radiation, more biomass accumulation and portioning to tubers.
Tuber number
Stem density increased by planting more tubers and number of tubers per plant decreased due to number of tubers per stem decreased. In the closest spacing there could be maximum competition among plants for spacing and resources and also low plant exposure for high radiation interception that increase the photosynthetic efficiency of the plant and finally resulting in increased number of tubers per plant. The total number of tuber increased as planting density increase, but very small under sized or unmarketable potato tuber was formed; this might be due to the effect of competition for nutrients, physical spaces and water. In case of nitrogen the increase in growth characters and yield components might be due to the role in nitrogen in stimulating vegetative growth.
Average tuber weight
Potato average tuber weight increased with reducing plant density and increased nitrogen application level. This is apparent that plant densities affect the average tuber weight as well as the total yield. By increasing intra row spacing, yield increases, but the average tuber weight decreases. Increase of density probably causes the increase of in competition between and within plants and hence, leads to decrease in availability of nutrients to each plant and consequently, results in decline of mean tuber weight (Karafyllidis et al., 1997). Yield increases are attributable to more tubers being produced at the closer intra row spacing per unit area and average tuber weight is decreased due to increased inter-plant competition with closer intra row spacing.
Marketable tuber yield
At wider spacing due to presence of minimum competition, plants absorbed the sufficiently available resources and intercepted more light. This increased their photosynthetic efficiency for higher photo assimilate production and ultimately result in marketable tuber yield.
Total tuber yield
With increasing nitrogen application, the number of stem including tuber, number of tubers and consequently yield were increased. This is due to the compensation effect of closer spaced plants per hectare than the wider spacing which result in higher yield of tuber per plant. Similarly, report of Kanzikwera et al. (2001) supports the present result as growing per unit area the number of tubers is highly dependent on plant density yield of oversize tubers is substantial only at low densities. Hanley et al. (1965) also reported that total yield was highest at the highest planting density and fertilizer application rate. This was probably due to increase in the number of plants per unit area, which might contribute to the production of extra yield per unit area leading to high yield.
Potato tuber yield in different size classes
Small tuber size (< 30 g)
The present result shows the smaller tuber size was 13.8 which agree with the findings of Mass (1963) who reported that wider spacing provided a higher yield of the larger tubers but a reduction in the yield of small and very small unmarketable tubers. Nelson (1967) and Wurr (1974) also noted that higher population resulted in slightly higher total yields and a greater number of small tubers. Similarly, Hanley et al. (1965) reported that nitrogen increased the yield of all grades and increased the weight of individual tubers slightly.
Medium tuber size yield (31 to 50 g)
Similar to the result of the current study Wurr (1974) also observed that yield of tubers in the medium and large grades increased with applied nitrogen. This is probably due to the fact that with increase in applied nitrogen, the yield of medium size tuber increases due to increase in the weight of individual tubers thus transferring the tubers from the small to the medium and large grades.
Large tuber-size yield (51-70 g)
The responses of large tuber-size yield due to the interaction effects of inter row spacing, intra row spacing and nitrogen application levels (Table 8). The interaction effects of intra row spacing X nitrogen application rate affected the yield of large tuber size highly and significantly. The reasons that yield of large tubers increased significantly by the wider spacing with a corresponding decrease in the yield of small tubers was due to reduced inter-plant competition at low plant density (Mass, 1963).
Dry matter content of tubers
Tuber dry matter percentages increased with increased spacing. Similarly, percentage of dry matter was affected highly and significantly by intra row spacing. Bleasdale and Thompson (1969) showed that with increasing density, dry matter was decreased in each plant but was increased per unit area. Approximately it can be said that all factors affecting tuber yield, affect total plant dry matter, as well. Nitrogen applications also influenced tuber dry matter percentage highly and significantly. This is attributed to the prolonged active vegetative growth, delayed maturation and accumulation of dry matter in tubers. Hence, tubers tend to be harvested immature with low dry matter percentage (Mass, 1963).
Simple correlation between total tuber yield and yield related trait of potato
From the correlation (Table 5), parameters with each other and total tuber yield is positive correlation significant, except harvest index, has a negative correlation non-significant with total tuber yield. Plant height, total tuber weight, dry matter, biomass weight and number of stem and tuber had the highest correlation with yield. This result represents a very positive impact on these parameters is increased total tuber yield.
Considering the above result, conclusion may be drawn that the highest nitrogen dose 100 kg/ha or150 kgN/ha applied at the closest spacing 10 cm gave the highest yield of tubers. Eventually, it may be concluded that different N level and plant spacing had significant effect on yield of potato tuber per plot as well as per hectare. The highest total tuber yield (10377.78 kg/ha) and unmarketable tuber yield (4077.77kg/ha) was produced at the closest spacing of 10 cm. The narrower spacing of 10 cm produced numerous small-sized potatoes, but from the total tuber yield produced in the closest spacing of 10cm 40.78% was unmarketable or commercially not accepted and hence, significantly the highest marketable tuber yield (4144.44 kg/ha) was obtained at the wider spacing of 30 cm similarly the highest total tuber yield (10007.41 kg/ha) and marketable tuber yield (2564.44 kg /ha) was produced at the 150 kg/ha nitrogen rate. In conclusion, the results of the study have revealed that tuber production could be maximized either for seed or ware potato by manipulating planting density and rates of nitrogen application.
According to the results in both treatments, high nitrogen levels could overcome the inter plant competitions caused by the high densities limiting the environmental resources for plants. Nitrogen fertilization recommendations must optimize crop yield and quality, and at the same time maximize profitability, to reduce the risk of environmental pollution. Nitrogen rate of 150 kg/ha caused increase of tuber yield. Since, 100 and 150 kg/ha nitrogen had no significant difference to each other producing the highest tuber yield and number of tuber, so in order to prevent environmental pollutions and excessive costs, utilize of 100 kg/ha nitrogen is recommended and any reduction in the planting density lower than 75 × 30 cm will lower both total yield and % marketable yield. So, 30 cm planting densities' producing the highest yield makes it suitable for planting. Therefore this study verify that growth and yield of potato is influenced by spacing and nitrogen level and accordingly 30 cm spacing in combination with nitrogen rate of 100 kg/ha can be used for optimum growth and the highest marketable tuber yield of Varity Gudanne potato on the vertisiol of the study area.
The authors has not declared any conflict of interests.
REFERENCES
|
Abay A, Sheleme B (2011). The influence of Potassium Fertilizer on the Production of Potato (Solanum tuberosu L.) at Kembata in Southern Ethiopia. J. Biol. Agric. 1:1.
|
|
|
|
Berga L, Gebre M, Jalleta T, Tuku BT (1994). Potato agronomy research in Ethiopia. Proceeding of the second national horticultural workshop of Ethiopia, Addis Ababa, Ethiopia pp. 2-3.
|
|
|
|
Birch JA, Divine RJ, Holmes MRJ, Whitear JD (1967). Field experiments on the fertilizer requirements of main crop potatoes. J. Agric. Sci. Cambridge 69:13-24.
Crossref
|
|
|
|
Bleasdale JKA, Thompson R (1969). Some effects of planting spacing on potato quality. Eur. Potato J.12:173-187.
Crossref
|
|
|
|
Hanley F, Jarvis RH, Ridgman WJ (1965). The effects of fertilizers on the bulking of Majestic Potatoes. J. Agric. Sci. Cambridge 65:159-169.
Crossref
|
|
|
|
Yenagi BS, Meli SS, Angadi SS (2005). Response of Potato to Spacing, Planting Date and Nitrogen Fertilization under Rain fed Conditions. Karnataka J. Agric. Sci. 18(2):492-493.
|
|
|
|
Iritani WM (1968). Factors affecting physiological ageing (degeneration) of potato tubers used as seed. American Potato J. 45:111-116.
Crossref
|
|
|
|
Iritani WM (1972). Effect of Plant Density and Seed Size on Growth and Yield of Solanum Potato in Khartoum State, Sudan. Afr. Crop Sci. J. 9(1):77-82.
|
|
|
|
Kanzikwera CR, Tenywa JS, Osiru DSO, Adipala E, Bhagsari AS (2001). Interactive effect of Nitrogen and Potassium on dry matter and nutrient partitioning in true potato seed mother plants. Afr. Crop Sci. J. 9:127-146.
Crossref
|
|
|
|
Karafyllidis DI, Georgakis DN, Stavropoulos NI, Nianiou EX, Vezyroglou IA (1997). Effect of planting density and size of potato seed-minitubers on their yielding capacity. Acta Hortic. (ISHS) 462:943-950.
Crossref
|
|
|
|
Khalafalla MA (2001). Effect of plant density and seed size on growth and yield of Solanum potato in Khartoum state, Sudan. Afr. Crop Sci. J. 9:77-82.
Crossref
|
|
|
|
Kleinkopf GE, Westermann DT, Duelle RB (1981). Dry matter production and nitrogen nutilization by six potato cultivars. Agron. J. 73:799-802.
Crossref
|
|
|
|
Lynch DR, Rowberry RG (1977). Population density studies with Russet Burbank potatoes. The effect of fertilization and plant density on growth, development, and yield. Am. Potato J. 54:57-71.
Crossref
|
|
|
|
Mass EF (1963). The effects of seed spacing and N levels on the size of Netted Gem.potatoes. Am. Potato J. 40:133-136.
Crossref
|
|
|
|
Menberu K, Derbew B, Ali M, Yehenew G (2012). Effect of intra-row spacing and variety on fruit yield and quality of fresh market tomato (Lycopersicon esculentum) under Jimma condition, Ethiopia. J. Appl. Sci. Technol. 3:32-42.
|
|
|
|
Ojala JC, Halderson JL, Hardling GW, Musselman EV (1992). Influence of seed placement on Russet Burbank potato yield and grade. Am. Potato J. 69:31-38.
Crossref
|
|
|
|
Saluzzo JA, Echeverrıa HE, Andrade FH, Huarte M (1999). Nitrogen nutrition of potato cultivars differing in maturity. J. Agron. Crop Sci. 183(3):157-165.
Crossref
|
|
|
|
Tesfaye G, Derbew B, Solomon T (2013). Combined effect of plant spacing and time of earthing up on tuber quality parameters of potato (Solanum tubersum L). Asian J. Crop Sci. 5:24-32.
Crossref
|
|
|
|
Tisdale SL, Nelson WL, Beaton JD, Halvin JL (1995). Soil Fertility and Fertilizers (5thEd.). Macmillan Publishing Co., Inc. New York pp. 109-229.
|
|
|
|
Wurr DCE (1974). Some effects of seed size and spacing on the yield and grading of two main crop potato varieties. Final yield and its relationship to plant population. J. Agric. Sci. Cambridge 82:37-45.
Crossref
|
|
|
|
Zelalem A, Tekalign T, Nigussie D (2009). Response of potato (Solanum tuberosum L.) to different rates of nitrogen and phosphorus fertilization on vertisols at Debre Berhan, in the central highlands of Ethiopia. Afr. J. Plant Sci. 3:016-024.
|