African Journal of
Agricultural Research

  • Abbreviation: Afr. J. Agric. Res.
  • Language: English
  • ISSN: 1991-637X
  • DOI: 10.5897/AJAR
  • Start Year: 2006
  • Published Articles: 6853

Full Length Research Paper

Study of the genetic variability, correlation and importance of phenotypic characteristics in cactus pear (Opuntia and Nopalea)

Francisco Abel Lemos Alves*
  • Francisco Abel Lemos Alves*
  • Agronomic Institute of Pernambuco, Av. General San Martin, 1371, Bongi, 50761-000, Recife-PE, Brazil.
  • Google Scholar
Albericio Pereira de Andrade
  • Albericio Pereira de Andrade
  • Federal University of Paraíba, Centre of Agricultural Sciences, Campus II, 58397-000, Areia-PB, Brazil.
  • Google Scholar
Riselane de Lucena Alcantara Bruno
  • Riselane de Lucena Alcantara Bruno
  • Federal University of Paraíba, Centre of Agricultural Sciences, Campus II, 58397-000, Areia-PB, Brazil.
  • Google Scholar
Djalma Cordeiro dos Santos
  • Djalma Cordeiro dos Santos
  • Agronomic Institute of Pernambuco, Av. General San Martin, 1371, Bongi, 50761-000, Recife-PE, Brazil.
  • Google Scholar
Vanda Lucia Arcanjo Pereira
  • Vanda Lucia Arcanjo Pereira
  • Agronomic Institute of Pernambuco, Av. General San Martin, 1371, Bongi, 50761-000, Recife-PE, Brazil.
  • Google Scholar


  •  Received: 17 March 2016
  •  Accepted: 02 June 2016
  •  Published: 04 August 2016

 ABSTRACT

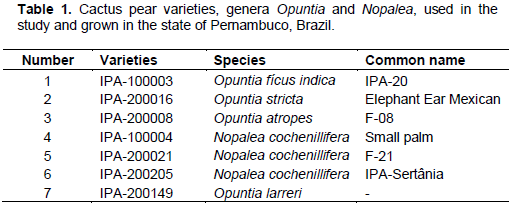
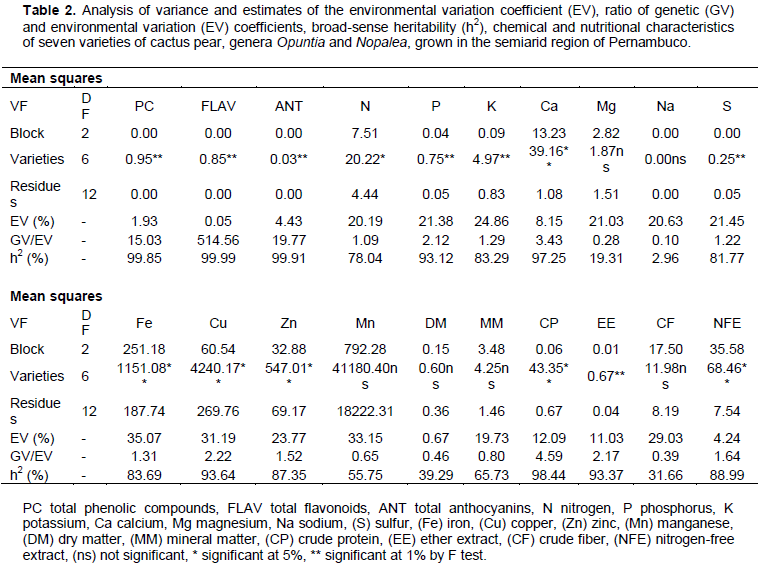
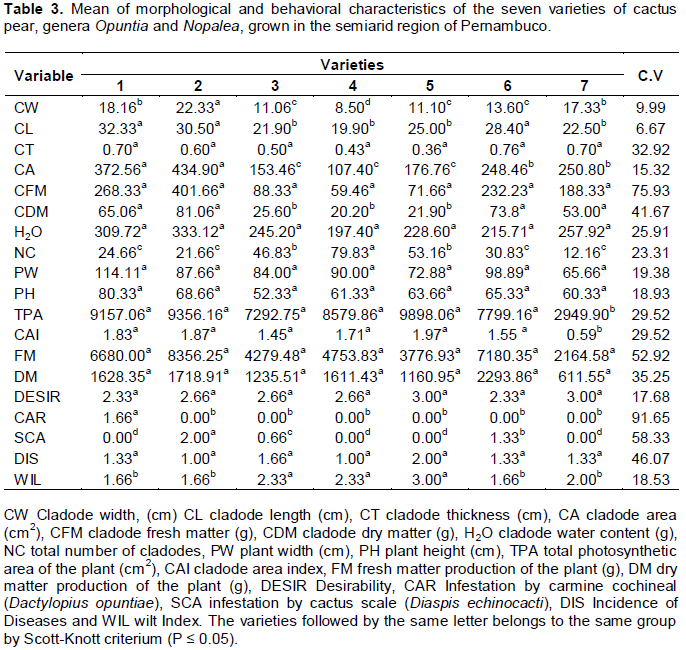
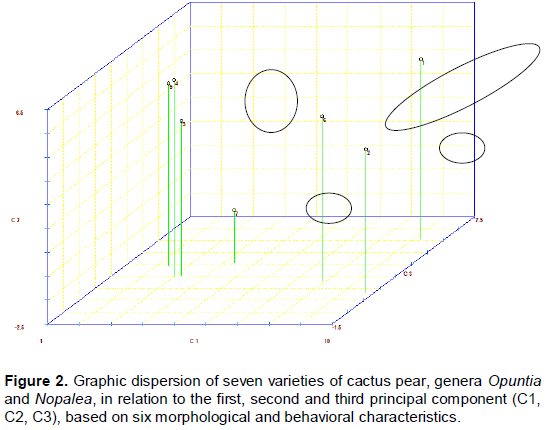
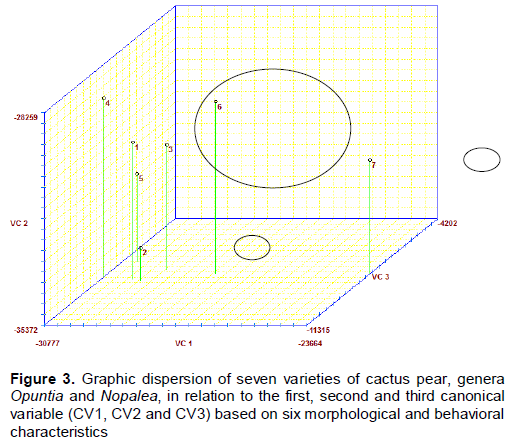
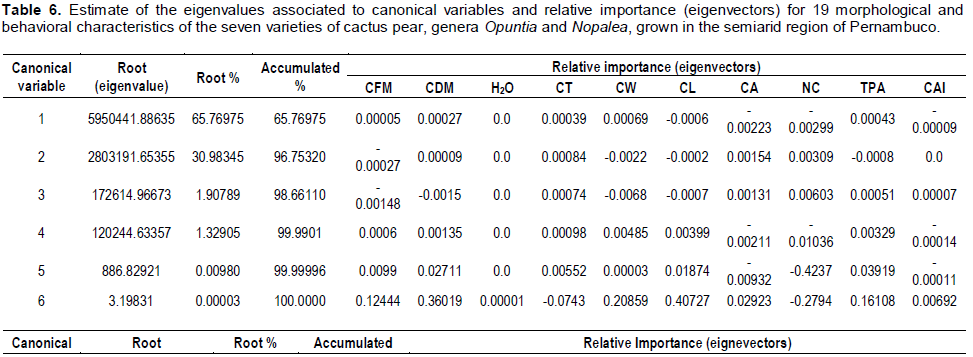
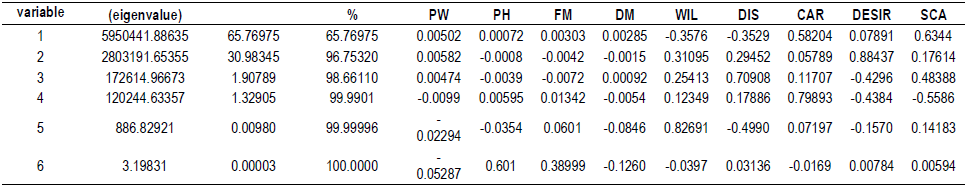
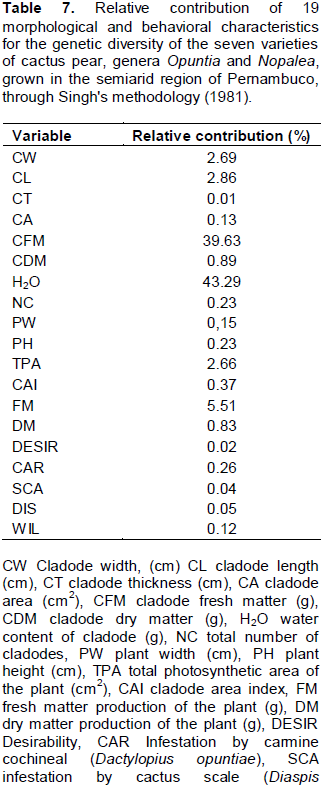
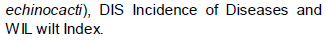
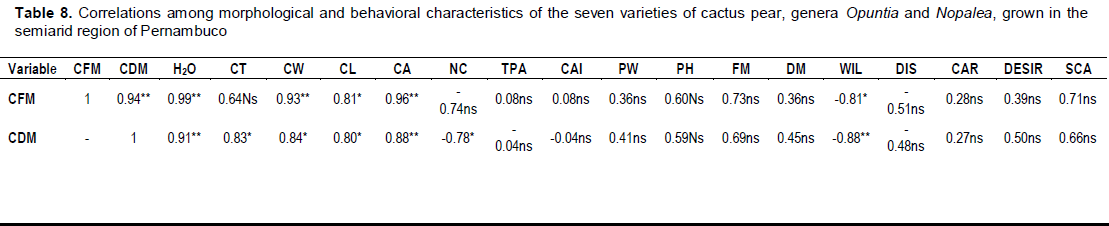
The cactus pear is a widely cultivated plant in the Northeast of Brazil, contributing significantly to the feeding of livestock, especially in times of drought. Because of the high variation between phenotypic varieties grown in this region, it is essential to study the genetic diversity. The objectives of this study were to characterize the genetic diversity in seven varieties of cactus pear, genera Opuntia and Nopalea, through 19 morphological and behavioral characteristics, and to determine the phenotypic correlation and importance of these characteristics to the variability among genotypes, using multivariate analysis techniques. The study was conducted at the experimental station of Agronomic Institute of Pernambuco (IPA), located in city of Arcoverde, State of Pernambuco, Brazil using randomized block design with three replications. The materials IPA-100003, IPA-200016, IPA-200008, IPA-100004, IPA-200021, IPA-200205 and IPA-200149 were evaluated for 19 quantitative characteristics of the plants. The collected data were analyzed by analysis of variance by F test, and the means grouped by the Scott-Knott test (p<0.05). The broad-sense heritability and phenotypic correlation characteristics were estimated. The genetic diversity was estimated by multivariate methods (unweighted pair group method with arithmetic mean-UPGMA, Tocher, principal component and canonical variables). Analyses of variance and genetic diversity revealed significant differences among genotypes, with the possible formation of two, three or four genetically distinct groups. The heritability values ranged from 79.6 to 97.0% for all 19 quantitative characteristics. The water content and cladode fresh matter are the characteristics that contributed most to the genetic divergence among the materials. Moreover, these characteristics are significantly and positively correlated with dry matter, width, length and cladode area. Thus, the genetic variability among the studied varieties of cactus pear and their potential use in breeding programs are confirmed. The uni and multivariate methods used for the genetic divergence differ and gather genotypes in two, three or four groups.

Key words: Brazilian semiarid, forage, genetic distance, grouping, multivariate analysis.


 INTRODUCTION

The cactus pear (Opuntia spp. and Nopalea spp.) is a cactaceae originally from Mexico, which is exploited since the pre-Hispanic period, holding the greatest genetic diversity and one of the largest cultivated areas in the world with over 28.3 million hectares. The current distribution of these plants in the world includes different environments and a wide range of species, which explains the high genetic variation that originates from the great ecological diversity of the areas where they are native (Barrios and Muñoz-Urías, 2001; López-García et al., 2001).
These plants are used for various purposes: human and animal food, energy production, medicine, cosmetics, chemical, and food industry. It is difficult to find a plant as distributed and exploited, especially in arid and semiarid areas, or as subsistence economy by producers of small animals, or as a culture focused on the industrial market (Barbera et al., 2001).
 
For their physiological, morphological, and chemical characteristics that enable these plants to tolerate arid and semiarid environments, especially with regard to absorption, recovery and use of water, they have adapted very well in Brazilian northeast. This region is characterized by having a high index of annual evaporation, greater than 2.000 mm, and average rainfall of less than 750 mm, concentrated in a single period of 3 to 5 months; in addition, in some years, the lack of rain is prolonged, resulting in the phenomenon of droughts (Araújo et al., 2005).
 
The species Opuntia ficus indica Mill. and Nopalea cochenillifera Salm Dyck. are widely cultivated, especially in the states of Pernambuco, Alagoas, Paraiba, Sergipe, Bahia and Ceará. It is estimated that the area cultivated in Brazil reaches about 550,000 ha. The main use of these plants in this region is based on food support for ruminants, mainly in the dry season, considering that this segment is strongly affected by the lack of forage plants during this period (Santos et al., 2006).
 
Most of the work involving selection and breeding of cactus pear uses statistical methods of univariate type, since they are focused on the analysis of the variation in a single random variable. However, the selection of plants based on various important variables may be more advantageous, especially  when  performed  on  a  set  of quantitative characteristics (Ferreira et al., 2003).
 
In the simultaneous handling of several characteristics, the multivariate techniques consider simultaneously a set of random variables, each of which has the same degree of importance. The multivariate techniques for diversity studies are applied from dissimilarity measures among the genotypes, such as the Mahalanobis distance. In addition, grouping analysis brings together individuals with similar characteristics in relation to the observed variables. Among the methods, we highlight the Tocher; the hierarchical, such as the unweighted average linkage (UPGMA), and principal component analysis and canonical variables (Cruz et al., 2012).
 
The objectives of this study were to characterize the genetic diversity in seven varieties of cactus pear, genera Opuntia and Nopalea, through 19 morphological and behavioral characteristics, and to determine the phenotypic correlation and importance of these characteristics in the variability among genotypes.


 MATERIALS AND METHODS

Location of the experiment
 
The study was conducted at the Experimental Station Arcoverde, from the Agronomic Institute of Pernambuco (IPA), located in city of Arcoverde, State of Pernambuco, Brazil (8°25’S, 37°05’ W), 680.7 m altitude, average annual temperature 22.9±1.7°C, average annual relative humidity 69.6±5.3%, wind speed (annual average 3.9±0.5 m s-1), accumulated evaporation (average 1700.4 mm), average annual accumulated rainfall of 798.1 mm, microregion of the sertão of Moxotó (Inmet, 2015).
 
Plant material and conducting the experiment
 
The materials used are listed in Table 1. The cladodes of the clones were planted on April 22 and 23, 2010, spaced 1.0 x 0.5 m; using one cladode per hole. The experimental design was a randomized complete  block  design represented by seven treatments and three replications. Each block consisted of three rows planted with eight plants of each variety, totalizing twenty four plants of each treatment. The experimental plot was composed by the middle row using with six plants and covering 3.0 m2 of area. The soil was fertilized 30 days after planting, with 20 t ha-1 of manure spread between the lines. Periodically, cultural practices were carried out in the form of weeding with hoe in all the cultivated area. The measurements in the plant, and collection secondary and tertiary cladodes were held at 8:00 am on 19 February, 2013 (dry season). After the measurements, the cladodes was cleaned, weighed, cut into small pieces (2 to 3 cm in length) and dried in a forced-air oven at 55°C, where it remained for 72 h until reaching constant weight, by which the dry matter (DM) of cladodes was obtained.
 
 
Determination of morphological characteristics and production
 
The evaluated variables were: the width (CW), length (CL), thickness (CT), area (CA), fresh matter (CFM), dry matter (CDM) and water content (H2O) and total number of cladodes (NC); width (PW), height (PH), total photosynthetic area (TPA), cladode area index (CAI), fresh (FM), and dry mass production (DM) of plants. CW, CL, CT, PW and PH were measured with a caliper and measuring tape. The CFM and CDM were obtained with a precision scale (0.01 g). The H2O was determined as described by Guimarães and Stone (2008) using the following formula: H2O = [(CFM – CDM) / CDM] x 100. PH was estimated as described by Sales et al. (2013), using the following formula: CA = CL x CW x 0.632. The TPA was estimated by multiplying CA with NC. The cladode area index (CAI) was estimated according to Sales et al. (2013), by the ratio between TPA and the soil area occupied by the plant. The FM and DM was estimated by the NC multiplied by CFM and CDM.
 
Determination of behavioral characteristics
 
The varieties was visually assessed by the characteristics of Desirability (DESIR) - general appearance of the genotype, in which are considered: budding, productive aspect and plant health, infestation by the carmine cochineal (Dactylopius opuntiae) (CAR), infestation by cactus scale (Diaspis echinocacti) (SCA), disease incidence (DIS), and wilt index (WIL).
 
We used for DESIR, scores: 1 (high), 2 (average), 3 (low). For CAR, SCA, DIS and WIL, scores: 0 (absence), 1 (low), 2 (average), 3 (high) and 4 (highest). The observations were made in the twenty four plants of the three rows of each variety (Pereira et al., 2014).
 
Statistical analysis
 
The data were initially evaluated by analysis of variance (ANOVA), and the means were compared by the Scott and Knott’s test at 5% (Scott and Knott, 1974).
 
The broad-sense heritability was calculated by the estimator: h2 = σ2g / σ2p x 100, where: σ2g is the genetic variance and σ2p is the phenotypic variance. The genetic variance was calculated by the estimator: σ2g = SMTreat – SMRes / J, where SMTreat is the square mean of the treatment, SMRes is the square mean of the residue, and J is the number of replicates. The phenotypic variance was calculated by the estimator: σ2p = SMTreat / J. The environmental variance was calculated by the estimator: σ2e = SMRes / J. The genetic variation coefficient was calculated by the estimator: (GV) = (σg / M) x 100, where M is the average of the characteristic. The environmental variation coefficient was calculated by the estimator: (EV) = (σr / M) x 100 (Alves et al., 2006; Rufino et al., 2010; Rêgo et al., 2011).
 
The genetic diversity among varieties was estimated using a measure of dissimilarities expressed by the Mahalanobis distance (D2) according to Cruz et al. (2012). Grouping was performed by hierarchical method unweighted pair group method with arithmetic mean (UPGMA), Tocher optimization method (Rao, 1952), principal component and canonical variables analysis methods (Cruz et al., 2012).
 
The relative importance of characters in relation to genetic diversity was studied according to Singh (1981), canonical variable and principal components analysis (Cruz et al., 2012). The correlations of Pearson among the characteristics were obtained as described by Rêgo et al. (2011), and the probability of 1 and 5% by t-test.
 
Data analyzes were performed in the statistical software GENES®- Computer Application in Genetics and Statistics (Cruz, 2001) and Assistat® 7.7 (Silva and Azevedo, 2006).


 RESULTS AND DISCUSSION

The analysis of variance by F test (p ≤ 0.01) showed significant differences among cactus pear varieties for width (CW), length (CL), area (CA), dry matter (CDM) of cladodes; number of cladodes (NC), infestation by D. opuntiae (CAR), infestation by D. echinocacti (SCA), wilt (WIL) of plants and (p ≤ 0.05) for total photosynthetic area (TPA), cladode area index (CAI) and dry mass (DW) of plants. There were no significant differences among cactus pear varieties for thickness (CT), fresh matter (CFM), water content (H2O) of the cladodes, width (PW), height (PH), fresh mass (FM), desirability (DESIR), and incidence of diseases (DIS) in the plants (Table 2).
 
 
Ferreira et al. (2003) and Neder et al. (2013), studying the genetic diversity of cactus pear (Opuntia ficus indica Mill.), reported significant differences among 38 accesses studied in relation to CT, CL, CW, NC, FM, DM, PH and PW. The failure to detect differences among the characteristics CT, CFM, H2O, PW, PH, FM and DESIR among varieties of cactus pear, is probably related to the time of data collection (dry season) after a large water deficit suffered by plants, approximately 13 months. This may have affected the results of the measurements, since the plants were not in their full turgor, besides, some genotypes lost some cladodes and these could not be accounted for in the measurements. The phenotypic difference among varieties in the rainy season, when the plants are fully turgid is clear (Alves et al., 2013).
 
The genotypes showed an average variation in CW (8.50 to 22.33 cm), CL (19.90 to 32.33 cm), CT (0.36 to 0.76 cm), CA (107.40 to 434 , 90 cm2), CFM (59.46 to 401.66 g), CDM (20.20 to 81.06 g), H2O (39.26 to 320.60 g), NC (12.16 to 79.83 units), PW (65.66 to 114.11 cm), PH (52.33 to 80.33 cm), TPA (2,949.90 to 9,898.06 cm2), CAI (0.59 to 1.97), FM (2164.58 to 8356.25 g), DM (611.55 to 2293.86 g), DESIR (2.33 to 3.00), CAR (0.00 to 1.66), SCA (0.00 to 2.00), DIS (1.00 to 2.00) and WIL (1.66 to 3.00) (Table 3). These values are consistent with found in the genera Opuntia and Nopalea. Researchers relate this variation to genotypic variability, plant age, soil, management, crop treatment and environmental factors
(Paixão,   2012;  Amorim,   2011;   Ferreira  et  al.,  2003; Sales et al., 2003).
 
 
The ratio between the coefficient of genetic (GV) and environmental variation (EV), was above one for the characteristics CW, CL, CA, CDM, NC, CAR, SCA, WIL, with heritability values (h2) between 79.6 to 97.0%, indicating high genetic control among these characteristics. For the other characteristics CT, CFM, H2O, PW, PH, TPA, CAI, FM, DM, DESIR and DIS, the (GV)/(EV) indices were below one, indicating the dominance of the environment on these characteristics (Table 2).
 
Neder et al. (2013) report that CW, CL, CT, PW, PH, FM and DM are controlled by genetic factors and that NC is controlled by environmental factors. However, as the researchers reported that the genetic correlations among these characteristics were higher than the phenotypic and environmental, but not significant, it may indicate possibly the effect of the environment on the association with the genetic characteristics (Gonçalves et al., 1996).
 
Paixão (2012) studying variance components and genetic parameters for the variables PH, PW, NC, CW and CL on cactus pear progenies, genera Opuntia and Nopalea, reported that environmental variance is greater than genotypic variance for these characteristics, indicating that the variability was biased, and that it could be overestimating the genetic variance. In general, the variance caused by the environment is an important source of error, capable of reducing experimental precision (Falconer, 1987; Paixão, 2012). However, those same researchers reported that the  estimates  of  broad-sense heritability coefficients were of high magnitude to PH, CW and CL, demonstrating good genetic control and the possibility of genetic advances (Paixão, 2012).
 
Given the existence of genetic variability among genotypes, we proceeded to the study of genetic divergence among the materials. For the characteristics in which the analysis of variance was significant, differences were identified (p ≤ 0.05) by the Scott-Knott’s test, and observed the formation of two (CL, CDM, TPA, CAI, CAR and WIL), three (CA and NC) and four (CW and ESC) groups of means (Table 3). The Tocher grouping method gathered the seven varieties into two distinct groups. The group I was represented by genotypes 1, 2, 3, 4, 5 and 6. Group II consists of the genotype 7 (Table 4).
 
 
According to the dendrogram obtained by hierarchical clustering method UPGMA, the cactus pear varieties were gathered into three groups, considering the cut of 38% of relative genetic distance, according to the criterion mentioned by Arriel et al. (2006) and Cruz et al. (2012), in which the high-level change points are considered delimiters of the number of genotypes for a certain group. Group I was composed by genotypes 1, 3, 4, 5 and 6; II group by 2; and group III by 7 (Figure 1).
 
 
The principal component analysis demonstrated that the use of the first three variables was sufficient to account for almost 85% of the total variation obtained in the seven genotypes (Table 5). Thus, a reasonable description of the genetic diversity of genotypes can be made  by  these  components, since, according to Cruz et al. (2012), it is necessary that the first principal components exceed 80% of the accumulated value to account for the variability manifested among individuals, leading the interpretation of the phenomenon with considerable simplification of characters. By analyzing the chart of the score dispersions of the principal component analysis, the formation of four groups was observed. The genotypes were divided into group I (3, 4 and 5), group II (1 and 6), group III (2) and Group IV (7) (Figure 2).


In the analysis of canonical variables, the first two variables explained 96.75% of the total variation among the varieties of cactus pear, providing good reliability of the variability among genotypes in the two-dimensional plane (Table 2). When analyzing the chart of the score dispersion of canonical variables, the formation of three groups was observed. Group I, represented by genotypes 1, 3, 4, 5 and 6, group II by genotype 7 and group III by genotype 2 (Figure 3).
 
The grouping methods of the genotypes were similar to each other. However, the grouping order of genotypes among groups was different. For example, in UPGMA methods, principal com-ponents and canonical variables, the genotype 2 was classified into one group, diverging from the Tocher method that classified this genotype as similar to genotypes 1, 3, 4, 5 and 6. The method of principal components classified genotypes 1 and 6 in different groups, differing from other methods that classified the genotypes 1, 3, 4, 5 and 6 as similar (Figure 1, 2, 3 and Table 4).
 
 
The grouping analysis (cluster analysis) identifies groups of similar individuals after estimation of a dissimilarity matrix. There are several grouping methods that differ by type of result and by the different ways to define the closeness between individuals or groups formed. In all cases, it is not known a priori, the number of groups to be established and different methods give different results (Cruz et al., 2012).
 
The grouping methods are mainly based on hierarchical and optimization methods. In the hierarchical methods, there is the method of the average distance among groups (UPGMA), in which the groups are identified in the form of dendrograms,  arranged  on   multiple   levels  and does not take into account the optimal number of groups. In optimization methods, there is the Tocher algorithm, in which the goal is to achieve a partition of individuals that optimize (maximize or minimize) some predefined measure. It is based on the formation of groups in which the distances within the groups are smaller than the distances among the groups obtaining the optimal number of groups (Cruz et al., 2012).
 
The techniques of principal component analysis and canonical variables aims to reduce the dimensionality of the variables so that the new combination of resulting uncorrelated linear variables explains the structure of variance and covariance of the set of original variables(Cruz et al., 2012).
 
The use of multivariate techniques in the detection of genetic diversity requires a certain degree of structure in the data. It is important that different grouping criteria be used and that the consensus structure of most of them be considered as correct, so as to assure that the result is not an artifact of the technique used (Arriel et al, 2006; Viana, 2013).
 
The formation of two groups of cactus pear by the Tocher method, three by UPGMA methods and canonical variables and four groups by the method of principal components, provides relevant information to the conservation of genetic material as a source for breeding programs. According to Silva et al. (2011), crossbreeding between genotypes from different groups provide superior lines for the improvement of characteristics of interest. Obtaining lineages from commercial varieties is a viable alternative because they represent improved and tested genotypes in various cultivation environments. Considering the hybrids, it is also possible to have a high proportion of fixed different loci, facilitating the selection and recombination of favorable alleles (Amorim and Souza, 2005).
 
Thus, as a suggestion for the breeding program with genera Opuntia and Nopalea, the breeder must consider not only the distance between groups as a criterion to guide the crossings, but also the individual performance of the genotype for each characteristic of agronomic and zootechnical interest (Ferreira et al., 2003), besides the possibility and ease to have crossings between individuals of different genera (Paixão, 2012).
 
In the principal component analysis, the characteristics that contributed most to the total variance of the first component were CFM, CDM, H2O and CA. In the second component, TPA, CAI and NC stood out; in the third component, CAR and PH (Table 5); in the analysis of canonical variables, the characteristics that contributed most to the total variance in the first variable were SCA and CAR, and in the second variable DESIR and WIL (Table 6). The most important characteristics are those whose weighting coefficients (eigenvectors) are of greater magnitude, in absolute value, in the first principal components or canonical variables (Cruz et al., 2012). Therefore, these would be the most responsive characteristics in the selection process among cactus pear populations.
 
 
In the relative contribution analysis of the characteristics for the genetic diversity among the seven varieties of cactus pear by Singh methodology (1981), H2O contributed with 43.29% and CFM with 39.63% for the variability among genotypes. These two characteristics contributed with 82.92% of the total variability among the materials. The characteristics that contributed least to the divergence were CT, DESIR, SCA and DIS (Table 7). The lower contribution variables are little informative in the characterization of genetic variability, and can be discarded in genetic diversity  studies (Rêgo et al., 2011).
 
 
Paixão (2012) and Ferreira et al. (2003) cite as most important characteristics for the divergence in genera Opuntia and Nopalea: CW, CL, CT, NC and CFM. Although this study present CFM and H2O as the main characteristics of diversity, they are positively and significantly correlated in the (p ≤ 0.01) and corelated to CDM, CW, CA, and in the (p ≤ 0.05) with CL. These results indicate the importance of the morphological characteristics related to cladodes for the study of genetic diversity in cactus pear (Table 8).
 
 
The CDM was correlated positively and significantly with H2O, CA, CT, CW, CL. The CW was positively correlated with CA. The CL was positively correlated with CA, PH and FM. The TPA was positively correlated with CAI. The PW was positively correlated with DESIR. The PH was positively correlated with CAR. FM was positively correlated with DM and SCA.  The DM was positively correlated with DESIR. The NC was negatively correlated with CDM, CT, CW and AC. The WIL was negatively correlated with CDM, CT, CFM and H2O (Table 8).
 
Most of the morphological characteristics of cladodes evaluated in this study correlated positively and significantly with each other. This is expected because they are characteristics related to agronomic production. Positive correlations among agronomic characteristics of these pests with the plant. An important aspect to consider is the CA of the genotype: the larger the area, the greater the H2O and more resistant is the plant to water deficit and WIL.
 
This characteristic is of interest to the breeding program of cactus pear aimed at the selection of genotypes more tolerant to water deficit. In addition, the CA was positively correlated with the CFM and CDM, relevant agronomic characteristics for the production of forage for food and animal nutrition.
 
A priori, the selection of genotypes with increased production of CDM should be preferred, since variation in water content harms the nutritional calculations. The selection by CFM or CA can be used, since these characteristics are significantly and positively correlated with each other and would not require the determination of the CDM (Neder et al., 2013). According to Cruz et al. (2012), the existence of significant correlations among characteristics indicates the feasibility of indirect selection in order to obtain gains in the characteristic of great importance. The CFM and CA are very important characteristics in terms of technical and economic aspects of a rural property. For being of easy viewing and production measurement in the Brazilian semiarid region, it is used as calculation basis for sizing the number and flow of animals on farms (Amorim, 2011). The genotypes that obtained the highest means for production characteristics, water retention, and resistance to pests and diseases were 2 and 6 (Table 3). Then, crossings that involve these genotypes could generate superior progenies in characteristics of agronomic, zootechnical or physiological interests. (NC, CT, CL, CW, PH, PW, FM and DM) were also reported by Neder et al. (2013), who studied 19 accesses of cactus pear (Opuntia ficus indica) at 30 months of age, except for the NC, which was negatively correlated with CT and CW, corroborating the results of our work.
 
The positive correlations of PH and FM with CAR and SCA, respectively, are given by the greater contact area Thus, the results suggest future work aimed to explore the variability found among the cactus pear genotypes studied and the possibility of using other methods such as protein molecular markers, physiological, biochemical and chemical characteristics, and chromosomal variation for the determination of the genetic variability; thereby providing a complementary analysis to studies through morphological and behavioral characteristics. Additional studies must be performed in other locations and in several years.


 CONCLUSION

The varieties studied of cactus pear, genera Opuntia and Nopalea, present genetic divergence. The uni and multivariate methods used for the divergence differ and gather genotypes in two, three or four groups.


 CONFLICT OF INTERESTS

The authors have not declared any conflict of interests.


 REFERENCES

Alves FAL, Santos DC dos, Pereira VLA, Silva M da C, França LTV, Amorim PMD de (2013). Estimativa de produção de massa fresca, seca e acúmulo de água em palma forrageira dos gêneros Opuntia e Nopalea. In: Congresso Nordestino de Produção Animal, 8, Fortaleza, Brasil pp. 1-4.


Alves JCS, Peixoto JR, Vieira JV, Boiteux LS (2006). Herdabilidade e correlações genotípicas entre caracteres de folhagem e sistema radicular em famílias de cenoura, cultivar Brasília. Hortic. Bras. 24:363-367.
Crossref


Amorim EP, Souza JC (2005). Híbridos de milho inter e intrapopulacionais obtidos a partir de populações S0 de híbridos simples. Bragantia 64:561-567.
Crossref


Amorim PL de (2011). Caracterização morfológica e produtiva em variedades de palma forrageira. (Dissertação de Mestrado). Universidade Federal de Alagoas, Rio Largo. 54 p.


Araújo LF, Oliveira LSC, Perazzo-Neto A, Alsina OLS, Silva FLH (2005). Equilíbrio higroscópico da palma forrageira: Relação com a umidade ótima para fermentação sólida. Bras. Eng. Agríc. Ambient. 9:379-384.
Crossref


Arriel NHC, Di-Mauro AO, Di-Mauro SMZ, Bakke AO, Unêda-Trevisoli SH, Costa MM, Capeloto A, Corrado AR (2006). Técnicas multivariadas na determinação da diversidade genética em gergelim usando marcadores RAPD. Pesqui. Agropecuária Bras. 41:801-809.
Crossref


Barbera G (2001). História e importância econômica e agroecológica. In: G Barbera (Ed.), Agroecologia, cultivo e usos da palma forrageira. Roma: Food Agric. Organ. United Nations/Braz. Support Serv. Micro Small Entreprises of Paraiba. pp. 1-11.


Barrios EP, Mu-oz-Urias A (2001). Domesticação das Opuntias e variedades cultivadas. In: G Barbera (Ed.), Agroecologia, cultivo e usos da palma forrageira. Roma: Food Agric. Organ. United Nations/Braz. Support Serv. Micro Small Entreprises of Paraiba. pp. 58-64.


Cruz CD (2001). Programa GENES: Aplicativo computacional em genética e estatística. Viçosa: UFV 648 p.


Cruz CD, Regazzi AJ, Carneiro PCS (2012). Modelos biométricos aplicados ao melhoramento genético. (4. ed.). Viçosa: UFV. 514 p.


Falconer DS (1987). Introdução à genética quantitativa. (1. ed.). Viçosa: UFV 279 p.


Ferreira CA, Ferreira RLC, Santos DC dos, Santos MVF dos, Silva JAA da, Lira M de A, Molica SG (2003). Utilização de Técnicas Multivariadas na Avaliação da Divergência Genética entre Clones de Palma Forrageira (Opuntia ficus-indica Mill.). Rev. Bras. Zoot. 32:1560-1568.
Crossref


Gonçalves PS, Martins ALM, Bortolleto N, Tanzizi MR (1996). Estimates of genetic parameters and correlations of juvenile characters based on open-pollinated progenies of Hevea. Braz. J. Genet. 19:105-111.


Guimarães CM, Stone LF (2008). Métodos de avaliação das condições hídricas das plantas. Comunicado Técnico 161, Goiás, Embrapa Arroz e Feijão 8 p.


Inmet - Instituto Nacional de Meteorologia (2015). Dados climáticos da Estação de Arcoverde: série histórica de 1961 a 2014. Banco de dados do Instituto Nacional de Meteorologia. Disponível em. View


López-García JJ, Fuentes-Rodríguez JM, Rodríguez RA (2001). Production and use of Opuntia as forage in Northern Mexico. In: C Mondragón-Jacobo (Ed.), Cactus (Opuntia spp.) as forage. Roma: Food Agric. Organ. United Nations. pp. 29-36.


Neder DG, Costa FR da, Edvan RL, Souto-Filho LT (2013). Correlations and path analysis of morphological and yield traits of cactus pear accessions. Crop Breed. Appl. Biotechnol. 13:203-207.


Paixão SL (2012). Avaliação morfológica de clones e progênies de palma forrageira. (Tese de Doutorado). Universidade Federal Rural de Pernambuco, Recife. 70p.


Pereira VLA, Santos DC dos, Silva M da C, Alves FAL, Soares G, Costa AF da, Mesquita FLT de (2014). Selection of genotypes of cactus pear adapted to semiarid conditions of Pernambuco state. In: Reunião Anual da Sociedade Brasileira de Zootecnia, 51, Barra dos Coqueiros, Brasil. 1 p.


Rao CR (1952). Advanced statistical methods in biometric research. New York: John Wiley & Sons. 390 p.


Rêgo ER do, Rêgo MM do, Cruz CD, Finger FL, Casali VWD (2011). Phenotypic diversity, correlation and importance of variables for fruit quality and yield traits in Brazilian peppers (Capsicum baccatum). Gen. Resour. Crop Evol. 58:909-918.
Crossref


Rufino ER, Siqueira WJ, Marques MOM, Colombo CA, Chiorato AF, Azevedo-Filho JA, Lourenção AL, Yamamoto PY, Martins ALM (2010). Estimativas de parâmetros genéticos de caracteres relacionados ao vigor de estacas em Lippia alba cuttings. Bragantia 69:779-785.
Crossref


Sales AT, Andrade AP, Silva DS, Leite MLMV, Viana BL, Ramos JPF (2003). Taxa de crescimento relativo de palma forrageira (Nopalea cochenillifera Salm-Dyck). Pesqui. Agropecuária Bras. 34:340-346.


Sales AT, Leite MLMV, Alves AQ, Ramos JPF, Nascimento JP (2013). Crescimento vegetativo de palma forrageira em diferentes densidades de plantio no Curimatú Paraibano. Technol. Ciênc. Agropecuária 7:19-24.


Santos DC, Farias I, Lira MA, Santos MVF, Arruda GP, Coelho RSB, Dias FM, Melo JN (2006). Manejo e utilização da palma forrageira (Opuntia e Nopalea) em Pernambuco. Recife: IPA. 48p.


Scott AJ, Knott M (1974). A cluster analysis method for grouping means in the analysis of variance. Biometrics 30:507-512.
Crossref


Silva FASE, Azevedo CAV (2006). A New Version of the Assistat-Statistical Assistance software. In: World Congress on Computers in Agriculture, 4, Orlando-FL-USA, Orlando: Am. Soc. Agric. Biol. Eng. pp. 393-396.


Silva JAG da, Schwertner DV, Carbonera R, Kruguer CAMB, Crestani M, Gaviraghi F, Schiavo J, Arenhardt EG (2011). Distância genética em genótipos de girassol. Rev. Bras. Agrociênc. 17:326-337.


Singh D (1981). The relative importance of characters affecting genetic divergence. Indian J. Gen. Plant Breed. 41:237-245.


Viana JPG (2013). Diversidade genética em alho (Allium sativum L.). (Dissertação de Mestrado). Universidade Federal do Piauí, Teresina 56 p.


          */?>