ABSTRACT
In horticultural nurseries, it is important to determine the number of plants to be evaluated to obtain reliable inferences about seedling growth. The objective of this study was to determine the sample size required to estimate the mean of quality traits of eggplant and gilo seedlings. The seedlings of both vegetables were produced in expanded polystyrene trays using (8×16) 128 cells each and 40 cm3 high. At 45 days after sowing, the following traits were evaluated in each seedling of the two crops: leaf number; total leaf area; fresh matter mass of shoot, roots and the total of fresh matter mass of shoot and roots, and Dickson quality index. Measures of central tendency and variability were calculated; the normality of the sample data was tested, and the sample size was calculated. The sample size required is different among the different traits of eggplant and gilo seedlings, and the same trait is different between the two crops. The sample size to evaluate seedlings for an estimation error of 10% of the estimated mean and at a confidence level of 95% is 32 and 26 for eggplant and gilo, respectively.
Key words: Solanum melongena, Solanum gilo, sampling, experimental precision.
In the production of good quality vegetables such as eggplant (Solanum melongena) and gilo (Solanum gilo Raddi) of the Solanaceae family, the formation of seedlings is one of the most important stages for the crop cycle, directly influencing the final performance of plants, nutritional and productive aspects, existing a direct relationship between healthy seedlings and productive plants in the field (Campanharo et al., 2006). Well-formed seedlings can ensure successful implementation and, consequently, vegetable plant productivity. On the other hand, seedlings with compromised development may result in damage to crop growth, increasing its cycle and leading to production losses (Guimarães et al., 2002), and consequently profit losses.
Burin et al. (2014) mention that because of limitations of financial resources (time and labor), it is common to measure samples that must represent adequately the population. To do this, it is necessary to establish an adequate sample size, which provides an estimate of the mean of the trait with an appropriate level of precision, thus, it is important to measure as many traits as possible to maximize the information on the crop.
There are several studies in literature that approach sample size for crops such as rice (Sari et al., 2016), corn (Wartha et al., 2016), soybean (Antúnez et al., 2016); fruits such as apple (Toebe et al., 2014), mombin (Silva et al., 2016), papaya (Schmildt et al., 2017), peach (Pazolini et al., 2016); and vegetables such as carrot (Silva et al., 2009), lettuce (Santos et al., 2010), green bean (Haesbaert et al., 2011) and tomato (Lucio et al., 2012).
Concerning the evaluation of seedlings, there are studies on the sample size for seedlings of Pinus (Silveira et al., 2009), Cabralea canjerana (Filho et al., 2012), and pecan walnut (Filho et al., 2014b). However, no study was found in literature on the sample size for the evaluation of eggplant and gilo seedlings.
Zar (2010) stated that the larger the sample size, the greater the precision of the experiment, with a reduction in the sample mean variance although the demand for resources is also high. On the other hand, a reduced sample size may decrease experimental precision. Bussab and Morettin (2012) points out that the sample size is directly proportional to the variability of the data and the desired reliability in the estimation which is inversely proportional to the estimation error.
Determining sample size is important in experimentation because if this sample size is excessive, unnecessary time and resources will be expended. However, taking samples smaller than necessary, inaccurate estimates will be obtained, which may even invalidate the work (Coelho et al., 2011).
The objective of this study was to determine the sample size (number of seedlings) required to estimate the mean of quality traits of eggplant and gilo seedlings.
The evaluations were carried out using seedlings of eggplant (Solanum melongena) cultivar Embú and gilo (Solanum gilo Raddi) cultivar Grande Rio. The seedlings were produced in a protected environment at the horticulture sector of the Federal Institute of Espírito Santo - Campus Itapina, Colatina, in the Northwest region of Espírito Santo. The region is characterized by an Aw tropical dry climate, according to the Koppen classification, 70 m altitude, 19°30' South latitude and 40º20' West longitude. The evaluations took place at seedling transplant stage, 45 days after sowing (DAS).
The seedlings of both vegetables were produced in expanded polystyrene trays (8×16) with 128 cells, and 40 cm3 high. The cells were filled with Bioplant® substrate, and 3 seeds were sown per cell. After emergence, thinning of the plants left only one seedling per cell. The seedlings were irrigated three times a day from the emergence to the end of the experimental period.
In August 2016, when the seedlings had at least 4 leaves, all the 128 seedlings of eggplant and gilo were evaluated for the following traits: Leaf number (LN), total leaf area (TLA) in cm2, using digital images in HP Deskjet F4480 scanner and processed by the ImageJ® Software, public domain (Schindelin et al., 2015); shoot fresh matter mass (SFMM) in g; root fresh matter mass (RFMM) in g; total fresh matter mass (TFMM) in g, and Dickson quality index (DQI).
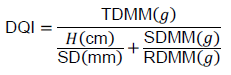
The DQI was determined as a function of shoot height (H), shoot diameter (SD), shoot dry matter mass (SDMM), root dry matter mass (RDMM), and total dry matter mass (TDMM), using the equation (Dickson et al., 1960):
The data collected for each crop were then analyzed separately using the descriptive statistics: Minimum and maximum values, arithmetic mean, standard deviation, coefficient of variation, and Shapiro-Wilk normality test. These statistics were obtained to characterize the database and verify its adequacy for the study of sample size via deterministic method or the need to use a simulation method (Ferreira, 2009).
To determine the sample size by simulations in each trait, this study used the interval estimation via bootstrap using percentile interval (Martinez and Neto, 2001; Ferreira, 2009). A total of 128 sample sizes were set for each trait of each crop; the initial sample size used was one seedling, and the others were obtained by adding one seedling to the previous quantity until it got to 128 seedlings.
For each sample size set of each trait of eggplant and gilo, 4000 simulations were performed by resampling, with replacement (Martinez and Neto, 2001). For each simulated sample, the mean were estimated. Thus, for each sample size of each trait of eggplant and gilo seedlings, 4000 mean estimates were obtained (Ferreira, 2009). The 95% confidence interval (95% CI) was then calculated by the difference between the 97.5% percentile and the 2.5% percentile for each sample size, and these results were plotted graphically.
Next, the sample size (number of seedlings) was calculated for the estimation of the mean of each trait of each crop. For this calculation, the initial size (one seedling) was taken and the sample size was considered as the number of seedlings from which the means remained within the limit of the 95% confidence interval (Haesbaert et al., 2017).
The sample size also was calculated by Chebyshev’s inequality using the mean and standard deviation calculated by the 4000 simulations. The statistical analyses were performed using the R (R Development Core Team, 2016) program and graphs were created with Microsoft Office Excel® application (Levine et al., 2012).
Table 1 shows the results of the eggplant seedling evaluation. The mean values obtained for the traits are as follows; 0.5838 g for shoot fresh matter mass (SFMM), 1.0515 g for total fresh matter mass (TFMM), 0.0243 for the Dickson index (DQI) and 17.4977 cm2 of total leaf area (TLA) per seedling (Table 1); these traits showed sample data normally distributed according to the Shapiro-Wilk test.
The leaf number (LN) and root fresh matter mass (RFMM) data were not normally distributed. Thus, the sample size was calculated using the bootstrap percentile simulation method, considering that this procedure requires no assumptions about the probability distribution of the estimator (Ferreira, 2009).
LN and TFMM showed coefficients of variation (CV) between 10 and 20%, which is considered the mean experimental precision. TLA, SFMM, RFMM and DQI showed values ​​between 20 and 30%, which is considered of low experimental precision (Storck et al., 2011). The traits of low experimental precision will require samples of larger size for the same confidence and error assumed (Ferreira, 2009).
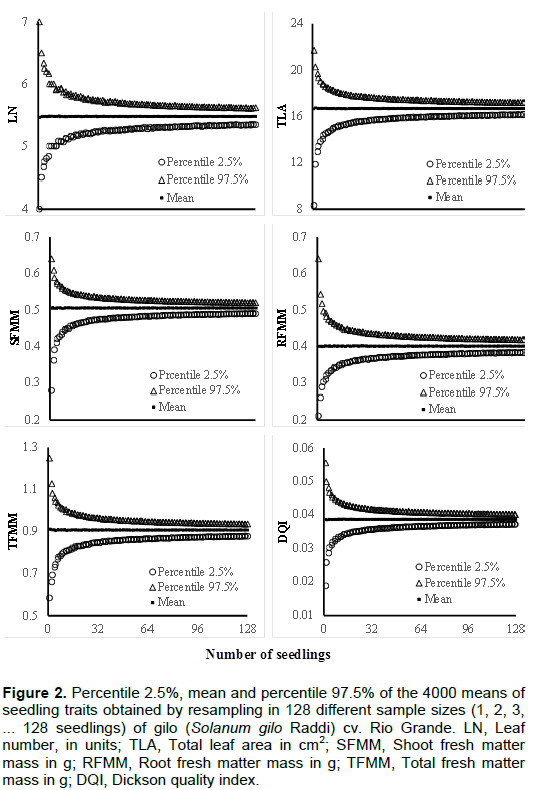
The amplitude of 95% confidence interval for mean gradually decreased with increasing sample size (number of seedlings) for all traits, which is consistent with those of other studies (Burin et al., 2014; Schmildt et al., 2017), and reveals an increase in precision in the estimation of the mean of each trait of eggplant seedlings (Figure 1). The mean bootstrap estimated for each sample size is invariant (Martinez and Neto, 2001), which allows the graphical analysis to determine the sample size of each trait for different sample errors assumed around the mean.
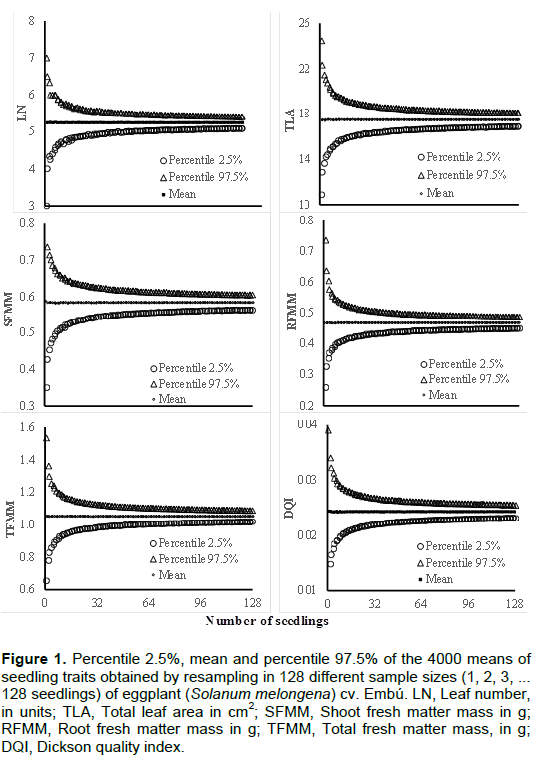
Table 2 shows the sample sizes of each trait evaluated in eggplant for different errors assumed around the mean. In this study, the minimum sample size required is different among the different traits, for each sampled error, and this is in agreement with the findings of other studies on the production of seedlings of other agricultural crops (Silveira et al., 2009; Cargnelutti Filho et al., 2012, 2014b). The smallest sample size required was found for LN, with 50 seedlings, and the largest sample size was found for DQI, with 127 seedlings, with 5% error around the mean.
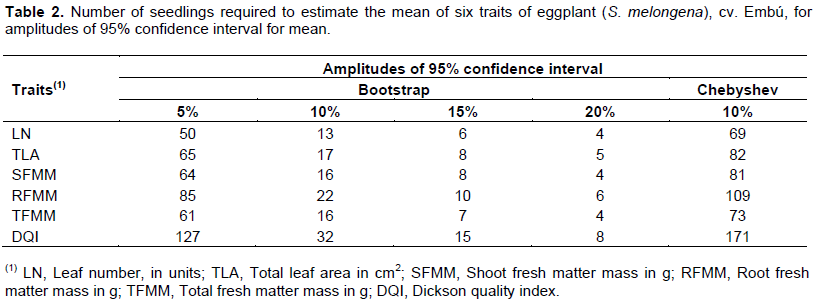
In situations where a 10% error around the mean is allowed, a sample of 32 seedlings is sufficient to size all the traits mentioned in this study. Using the Chebyshev inequality, the sample size is 171 seedlings. Literature reviews have indicated that there are no studies on sample size of eggplant or other horticultural seedlings, nor studies evaluating the quality of seedlings by DQI. The evaluation of the sample sizes is important to obtain reliable inferences about seedling growth.
Silveira et al. (2009) investigated sample size in Pinus taeda seedlings and concluded that, with a 10% error around the mean, 25 seedlings are required in the sample. Evaluating sample size in Cabralea canjerana seedlings, Cargnelutti Filho et al. (2012) found that with 10% error around the mean, the sample size was 18 seedlings, which is lower than that found in this study for eggplant seedlings.
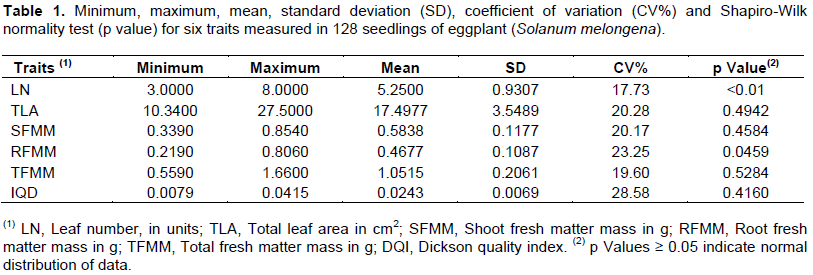
The results of descriptive statistics and normality test in the evaluation of different traits of gilo seedlings are presented in Table 3. The mean values obtained for the traits are as follows: 5.4766 units for LN; 16.6341 cm2 for TLA; 0.5050 g for SFMM; 0.4003 g for RFMM; 0.9053 g for TFMM; and 0.0386 for DQI, with different variabilities measured by the CV. Only RFMM and DQI had sample data normally distributed by the Shapiro-Wilk test. Different variabilities among different traits were also reported in sample size studies of other horticultural crops such as lettuce (Santos et al., 2010) and tomato (Lucio et al., 2012).
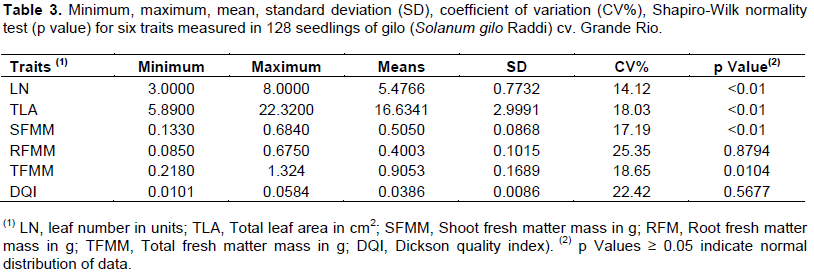
The analysis of gilo data showed some differences compared with eggplant, since all traits of the gilo seedlings, except for RFMM that had lower variability than those of eggplant seedlings. The traits LN, TLA, SFMM and TFMM of gilo had CV values between 10 and 20%, which is considered of medium experimental precision (Storck et al., 2011), whereas for eggplant seedlings, only LN and TFMM had been included in this classification. These results indicate that for gilo seedlings, RFMM will have the largest sample size.
Considering that not all traits evaluated in gilo seedlings had sample data normally distributed, the sample size was determined by the bootstrap percentile method (Figure 2), considering that this procedure requires no assumptions about the probability distribution of the data (Ferreira, 2009)
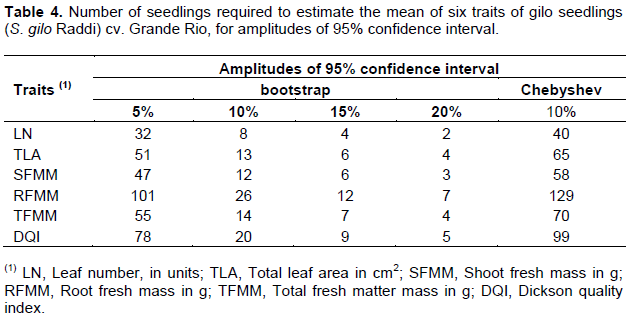
The sample size differed among the different traits of gilo seedlings (Table 4) and, as in eggplant, the smaller sample size is required for LN. With a 10% error around the mean, only 8 seedlings are needed in the sample. This finding has important implications for nursery producers, because most farmers evaluate seedling quality based on LN, and in this way, evaluations will be done with a lower number of seedlings. In addition, it is a non-destructive method, fast and easy to implement.
However, for gilo seedlings, the largest sample size was found for RFMM, which, although it is as important as LN, it is not performed by most of the producers, and the two traits are not significantly correlated (r = - 0.0130, p = 0.8843, H0: ρ = 0), indicating that classifying seedlings by LN may not be the best strategy. This study showed that, with a 10% error around the mean, 26 seedlings of gilo are required to characterize RFMM. Using the Chebyshev inequality, the sample size is 129 seedlings.
In this study, the results show that eggplant and gilo, both belonging to the same family, have different sample size requirement for the same traits, and this is in line with the findings of Coelho et al. (2011) for sample size of mature fruits of Passiflora edulis and Schmildt et al. (2017) for fruits of Passiflora foetida.
The sample size requirement is different among the different traits for eggplant and gilo seedlings, and it is also different for the same trait between the two crops. The sample size for seedling evaluation, for an estimation error of 10% of the mean estimate, at 95% confidence level, is 32 for eggplant and 26 for gilo seedlings.
The authors have not declared any conflict of interests.
REFERENCES
|
Antúnez CCC, Storck L, Guedes JVC, Cargnelutti Filho A, Alvarez JWR (2016). Tamanho de amostra para avaliar a densidade populacional de percevejos em lavouras de soja. Ciênc. Rural 46:399-404.
Crossref
|
|
|
|
Burin C, Cargnelutti Filho A, Toebe, Alves BM, Fick AL (2014). Dimensionamento amostral para a estimação da média e da mediana de caracteres de tremoço branco (Lupinus albus L.). Comm. Sci. 5:205-212.
|
|
|
|
|
Bussab WO, Morettin PA (2012). Estatística básica. 7ª ed. São Paulo: Saraiva P 540.
|
|
|
|
|
Campanharo M, Rodrigues JJV, Lira Junior MA, Espindula MC, Costa JVT (2006). Características físicas de diferentes substratos para produção de mudas de tomateiro. Rev. Caatinga 19:140-145.
|
|
|
|
|
Cargnelutti Filho A, Araujo MM, Gasparin E, Avila AL (2012). Dimensionamento amostral para avaliação de altura e diâmetro de mudas de Cabralea Canjerana. Ciênc. Rural 42:1204-1211.
Crossref
|
|
|
|
|
Cargnelutti Filho A, Facco G, Lúcio AD, Toebe M, Burin C, Fick AL, Neu IMM (2014a). Tamanho de amostra para a estimação da média de caracteres morfológicos e produtivos de nabo forrageiro. Ciênc. Rural 44:223-227.
Crossref
|
|
|
|
|
Cargnelutti Filho A, Poletto T, Muniz MFB, Baggiotto C, Fronza IPD (2014b). Dimensionamento amostral para avaliação de altura e diâmetro de mudas de nogueira-pecã. Ciênc. Rural 44:2151-2156.
Crossref
|
|
|
|
|
Coelho AA, Oliveira EMS, Resende ED, Thiébaut JTL (2011). Dimensionamento amostral para a caracterização da qualidade pós-colheita do maracujá-amarelo. Rev. Ceres. 58:23-28.
Crossref
|
|
|
|
|
Dickson A, Leaf AL, Hosner JF (1960). Quality appraisal of white spruce and white pine seedling stock in nurseries. For. Chron. 36:10-13.
Crossref
|
|
|
|
|
Ferreira DF (2009). Estatística básica. 2ª ed. Lavras: UFLA. P 664.
|
|
|
|
|
Guimarães VF, Echer MM, Minami K (2002). Métodos de produção de mudas, distribuição de matéria seca e produtividade de plantas de beterraba. Hortic. Bras. 20:505-509.
Crossref
|
|
|
|
|
Haesbaert FM, Santos D, Lúcio AD, Benz V, Antonello BI, Ribeiro ALP (2011). Tamanho de amostra para experimentos com feijão-de-vagem em diferentes ambientes. Ciênc. Rural. 41:38-44.
Crossref
|
|
|
|
|
Haesbaert FM, Lopes SJ, Mertz LM, Lúcio AD, Huth C (2017). Tamanho de amostra para determinação da condutividade elétrica individual de sementes de girassol. Bragantia. 76:54-61.
Crossref
|
|
|
|
|
Levine DM, Stephan DF, Krehbiel TC, Berenson ML (2012). Estatística: Teoria e aplicações usando Microsoft Excel em português. 6ª ed. Rio de Janeiro: LTC. P. 832.
|
|
|
|
|
Lucio AD, Haesbaert FM, Santos D, Schwertner DV, Brunes RR (2012). Tamanhos de amostra e de parcela para variáveis de crescimento e produtivas de tomateiro. Hortic. Bras. 30:660-668.
Crossref
|
|
|
|
|
Martinez EZ, Louzada Neto F (2001). Estimação intervalar via bootstrap. Rev. Mat. Estat. 19:217-251.
|
|
|
|
|
Pazolini K, Santos I, Citadin I, Storck L, Flores MF (2016). Sampling plan for assessing brown rot severity in peaches subjected to different plant extracts. Rev. Caatinga 29:519-527.
Crossref
|
|
|
|
|
R DEVELOPMENT CORE TEAM (2016). R: a language and environment for statistical computing. Vienna, R Foundation for Statistical Computing. Available: <http://r-project.org>. Acessed: mai. 2017.
|
|
|
|
|
Santos D, Haesbaert FM, Puh OJ, Santos JRA, Lúcio AD (2010). Suficiência amostral para alface cultivada em diferentes ambientes. Ciênc. Rural. 40:800-805.
Crossref
|
|
|
|
|
Sari BG, Lúcio AD, Costa IFD, Ribeiro ALP (2016). Sample size for assess the leaf blast severity in experiments with irrigated rice. Rev. Caatinga 29:822-831.
Crossref
|
|
|
|
|
Schindelin J, Rueden CT, Hiner MC, Eliceiri KW (2015). The ImageJ Ecosystem: An Open Platform for Biomedical Image Analysis. Mol. Reprod. Dev. 82:518–529.
Crossref
|
|
|
|
|
Schmildt ER, Alexandre RS, Siqueira AL, Mayrinck LG, Schmildt O (2017). Sample dimension for evaluating physical and chemical characters of wild passion fruit. Rev. Ceres. 64:109-111.
|
|
|
|
|
Silva GO, Vieira JV, Villela MS (2009). Tamanho de amostra para avaliação de caracteres de cenoura em sistemas de cultivo agroecológico. Hortic. Bras. 27:166-170.
Crossref
|
|
|
|
|
Silva W, Bianco AC, Oliari LS, Giles JAD, Schmildt O, Schmildt ER (2016). Dimensionamento amostral para caracterização física e química em frutos de ciriguela. Revista Agro@ mbiente On-line 10:178-182.
|
|
|
|
|
Silveira BD, Lucio AD, Lopes SJ, Oliveira F (2009). Aleatoriedade e tamanho da amostra em mudas de Pinus taeda L. Rev. Ceres. 56:730-735.
|
|
|
|
|
Storck L, Garcia DC, Lopes SJ, Estefanel V (2011). Experimentação vegetal. 3ª ed. Santa Maria: UFSM P 198.
|
|
|
|
|
Toebe M, Both V, Cargnelutti Filho A, Thewes FR (2014). Tamanho de amostra para a estimação da média de caracteres de maçã. Cienc. Rural. 44:759-767.
Crossref
|
|
|
|
|
Wartha CA, Cargnelutti Filho A, Lúcio AD, Follmann DN, Kleinpaul JA, Simões FM (2016). Sample sizes to estimate mean values for tassel traits in maize genotypes. Genet. Mol. Res. 15:1-13.
Crossref
|
|
|
|
|
Zar JH (2010). Biostatistical analysis. 5ª ed., Upper Saddle River, NJ: Prentice Hall P 944.
|
|