Full Length Research Paper

ABSTRACT
Erosion is a key factor for sustainability of land management. This study aimed to determine the spatial distribution of estimated total soil loss amount and erosion severity in the Oltu Anzav Watershed located in the East of Anatolia, Turkey. This study was conducted by using Geographical Information Systems (GIS) based on Revised Universal Soil Loss Equation (RUSLE) method. Topsoil samples (0-30 cm) were collected in 129 sites and analyzed for soil erosivity factor (K). Furthermore, the spatial distribution of potential estimated soil losses that may occur was mapped with the modeling using different scenarios in the future. Five different erosion risk groups have been determined as slight, moderate, severe, very severe and extreme, in the watershed area. As a result, the average surface soil loss was estimated as 24.44 ton ha-1year-1. Also, two different scenarios were created to estimate soil losses in the future in this study. According to the first scenario, if rehabilitation processes are implemented in the degraded forest area, soil loss was estimated as 7.33 tones ha-1year-1. In the second scenario, if any measures are not taken for soil erosion and flood control, soil loss was estimated as 58.63 ton ha-1year-1. Finally, sedimentation should be reduced in the watershed by erosion and flood control projects and applications.
Key words: Erosion, erosion risk maps, Anzav basin, revised universal soil loss equation (RUSLE), geographical information systems (GIS).
INTRODUCTION
Soil erosion is one of the most serious environmental problems in Turkey and in the world. Due to the effects of unconscious human activities, the problem is increasing day by day (Yuksel et al., 2007; Karabulut and Kuçukonder, 2008; Ozsahin and Keles, 2016).
It is estimated that the half of total land areas are affected by serious erosion problem in Turkey (CEMGM, 2018). Moreover, industrial and residential centers are increasing in productive agricultural lands, and agricultural activities are shifting towards sloping areas.
The results of poor land management practices causes an increase in erosion problems and destroys the natural balance of soil. This deterioration can cause many problems directly or indirectly, such as deterioration of river regimes, disappearance of wetlands, shortening of reservoir life, sediment accumulation in agricultural lands, increase of flooding events and water pollution (Karabulut and Kucukonder, 2008; Zengin et al., 2009; Aydin, 2009; Bouaziz et al., 2011; Sonmez et al., 2013).
Investigation of the size of the problem is essential in erosion control, and precautions and monitoring the process is very important for sustainable land management. Effective soil erosion assessments helps not only to determine the spatial distribution of the soil loss risks but also to develop and practice regional policies to reduce soil losses. For this purpose, numerous erosion/soil loss estimation methods have been developed. Universal Soil Loss Equation (USLE), Revised Universal Soil Loss Equation (RUSLE), and Institute for Conservation of the Nature (ICONA) equations are the most commonly used methods (Renard et al., 1997; Tagil, 2007; Karaoglu, 2012).
Geographic Information Systems (GIS) is one of the most important means of analyzing, mapping and monitoring the erosion problem.
The aim of this study is to estimate and map the spatial variation of the current annual soil loss amount of Oltu Anzav Basin. It is also aimed to estimate and map the spatial variation of potential annual land loss amounts as a result of two different scenarios.
MATERIALS AND METHODS
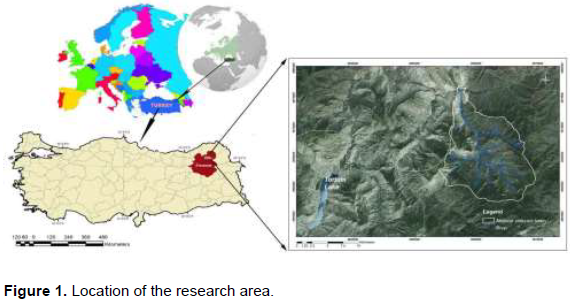
This research was carried out in Anzav Basin of the Oltu town, located in the south of Erzurum province, Turkey. The coordinates of the study area are 40°43’48’’ to 40°41’24’’ N and 41°49’48’’ to 41°53’24’’ E (Figure 1). The total area of the basin is 10.017 ha. Anzav Basin and its vicinity is covered with volcanic and sedimentary basic rocks formed during the Jurassic-Cretaceous period. Clastic and carbonate rock formed during the Upper Jurassic-Lower Cretaceous period (MRE, 2018).
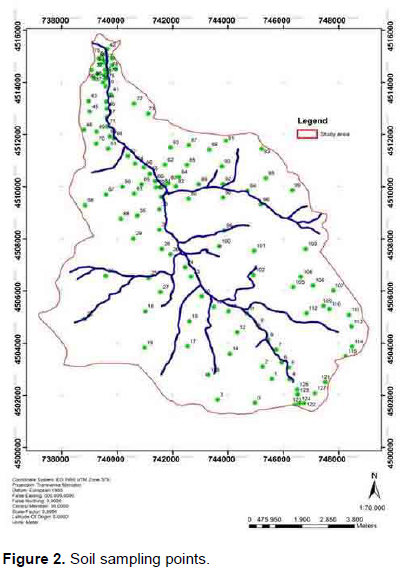
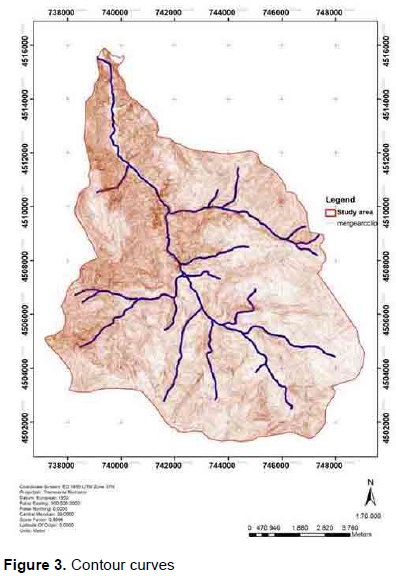
Climate of the study area is generally cold and temperate. According to Thornthwaite climate classification, it is classified as semi-arid, less humid climate type. The average temperature is 9.1°C and the average annual rainfall is 426 mm (MGD, 2018).The sampling points were determined according to the factorial design, taking into consideration of bedrock, large soil groups, slope, aspect, altitude and land use situations. For this purpose, degraded surface (0-30 cm) soil samples were taken from 129 points (Figure 2). Topography maps, with 1/25.000 scale of the study area were digitized in ArcGIS program, in order to produce the slope and slope length maps used as parameters in the study (Figure 3).
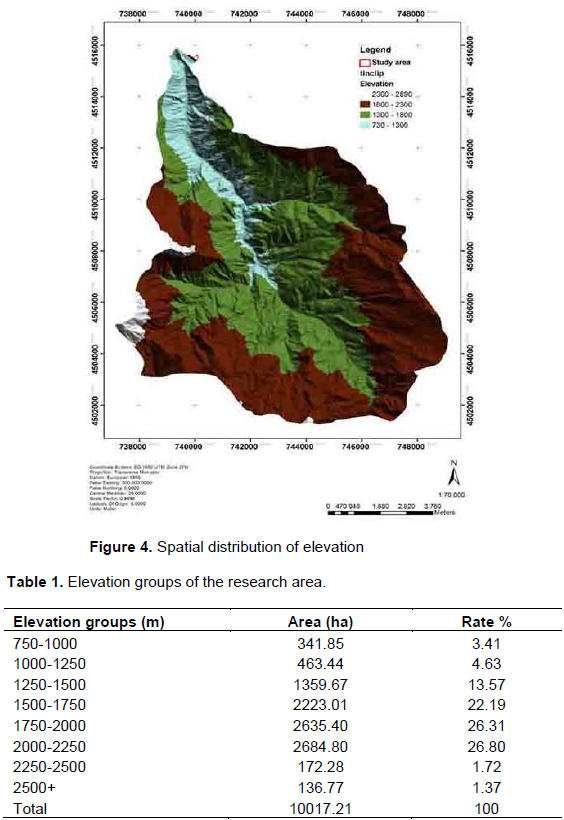
The altitude of the research area varies between 730 m and 2890 m, and a total of 8 elevation groups were determined taking into consideration vegetation and usage, resulting from the elevation changes (Figure 4 and Table 1).
Revised Universal Soil Loss Equation (RUSLE) was used to estimate annual soil loss in research area (Wischmeier and Smith, 1978; Williams and Bernth, 1972; Renard et al., 1997; Ekinci, 2007; Ozsahin, 2014; Celik, 2011). RUSLE equation is as follows (1).
A=R*LS*C*K*P (1)
Where;
A = annual soil loss from sheet and rill erosion in tons acre-1
R = rainfall erosivity factor
K = soil erodibility factor
LS soil erodibility factor = slope length and steepness factor
C = cover and management factor
P = support practice factor
The determined value in the equation refers to the amount of potential soil loss in any selected area that will most likely be caused by groove erosion. Rainfall data, topographic data, soil characteristics, land cover and soil protection measures of the study area are used as an input dataset.
Rainfall erosivity factor (R)
Rainfall is the main component and factor of erosion wherever water erosion is seen. The R factor is accepted as the potential erosivity of flowing water or a measure of the erosive force and intensity of rain in a normal year; also, it is greatly affected by the intensity and duration of rain and diameter, mass, and velocity of raindrops (Wischmeier and Smith, 1978).
Slope length and stepness factor (LS)
Slope length and steepness (LS) factor is another important factor in the soil transport and it is a measure of sediment production. The following Equation 2 was used to calculate the LS factor (Williams and Bernth, 1972).
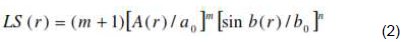
A(r): The upper slope, contributes to the width of each contour curves; b(r): Slope in degrees, m and n parameters: Experimentally determined as 0.4 and 1.4 respectively; a0: (22.1 m = 2.6 ft) length; b0: (0.09 = 9% = 5.16°) the slope of standard USLE pilot. The flow directions and flow accumulation maps were produced in the Archydro in raster format using SYM to calculate the slope degree and slope length factor.
The slope map of the same area was produced in raster format in degrees using the "3D Analyst" module. The above formula was arranged as follows in Equation 3 and LS factor was calculated using ArcGIS "Map Algebra". The map resolution was 58 m in this study.
LS=Power ("Fac"*58/22.1,0.4)*Power(Sin("slopedegree"*0.01745)/0.09,1.4)*1.4 (3)
Soil erodibility factor (K)
According to Balci (1996), erodibility represents resistance to erosive forces and erosion caused by various soil properties. It is a measure of the sensitivity of soil particles to erosion and transport by the influence of precipitation and flow. The soil erodibility is largely due to the physical and chemical properties of the soil. In other words, it depends on texture and structure of the soil. While some soils are resistant to the same erosive forces, some soils are easily dissolved, dispersed, and exposed to erosion. Texture and structure properties of soil, organic matter content, and hydraulic conductivity are the leading factors that affect soil erosion (Figure 5, Table 2).
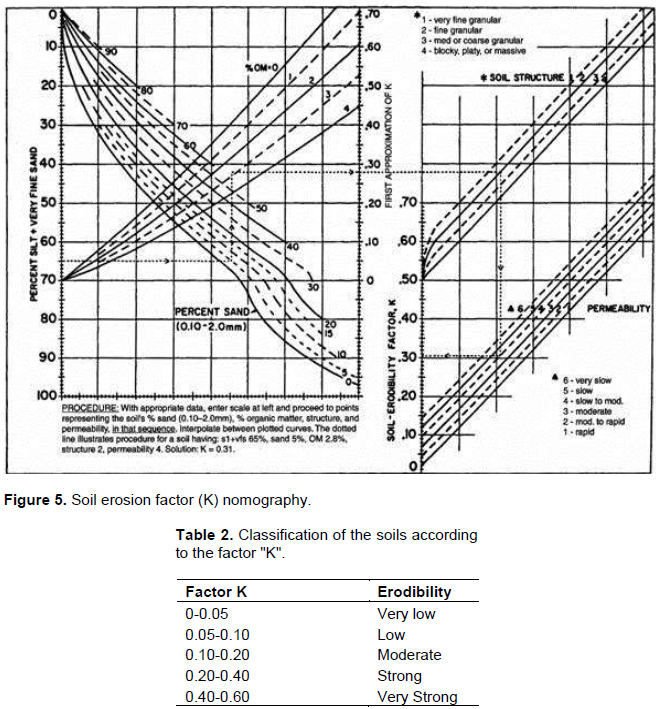
In order to calculate factor K in 129 soil samples, soil organic matter, soil particle size (Bouyoucos, 1962) and fine sand quantities were determined by laboratory analysis and K factors were determined using these values, with the help of the above nomogram.
Crop management factor (C)
The vegetation type, age and coverage ratio are used to estimate soil losses because they directly affect the erosivity of the rain (Canga, 1995; Irvem and Tulucu 2004). The C factor for the study area was determined using forest management maps and land presence maps.
Soil conservation practice factor (P)
In RUSLE module, the soil conservation practice factor (P) represents the ratio of the soil loss in the direction of slope with a special support application to the soil loss caused by soil tillage. These applications affect erosion by altering the type, size or direction of the surface flow, or by reducing the amount and speed of surface flow (Renard et al., 1997).
Erosion classification
The erosion classification map of the basin was constructed according to Uzunsoy and Gorcelioglu (1985) classification (Table 3).
RESULTS AND DISCUSSION
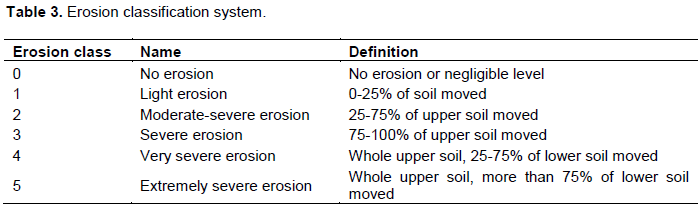
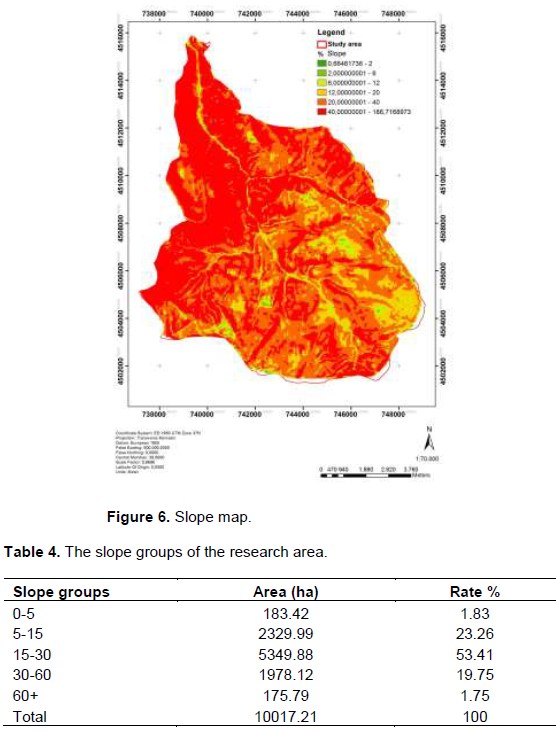
The high slope values of the research area caused some events such as erosion and landslide on the slopes, which causes soil abrasion and transport processes to continue actively. The research area has young geomorphological formation appearance, divided by deep valleys. The limited agricultural activities that can be done on the accumulations in the valley bases are one of the most important factors determining the social and economic structure of the region (Yarbasi, 2016).
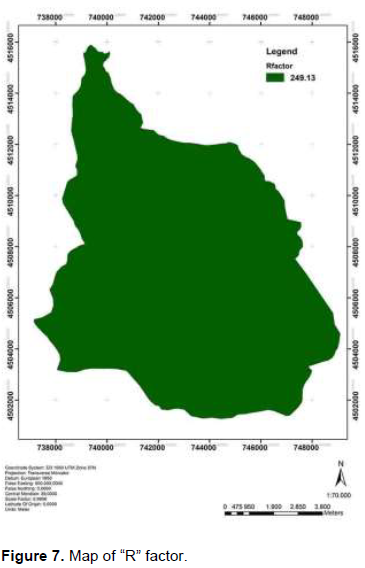
The slope map was constructed from the Digital Elevation Model (DEM) map (Figure 6). The distribution and proportions of the slope groups in the area are given in Table 4. Accordingly, over 75% of the research area is above 1500 m elevation. At the same time, 75% of the area is included in steep and very steep slope group. This situation shows that the area has very extreme features in terms of physiographic characteristics. In this study, factor R-value used was determined by CEM (2016). The factor R-value was determined as 249.13 (Figure 7).
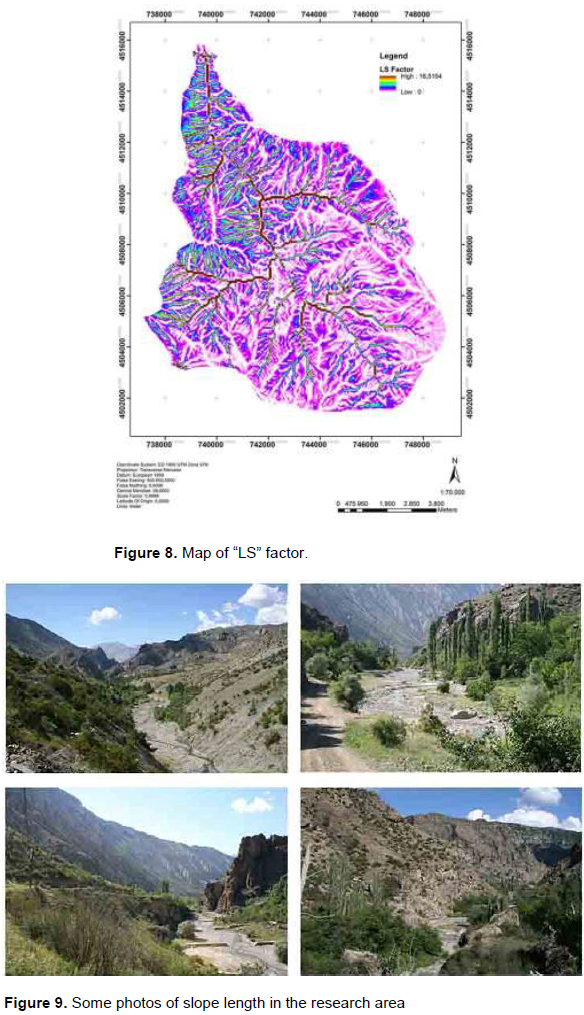
Slope length and steepness factor (LS)
The highest LS value of the basin was determined as 16.51 (Figure 8). Pictures showing the general physiographic condition of the basin are presented in Figure 9. Ozdemir and Tatar (2016) determined the value of the LS factor from 0 to 37.38 in the Isıklı Watershed, Turkey.
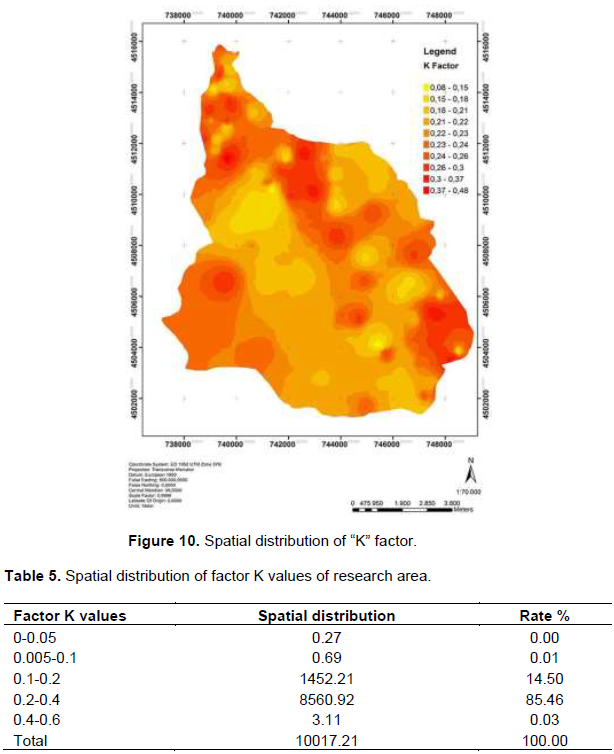
Soil erodibility factor (K)
The map constructed for the factor K in the study basin are shown in Figure 10, and the spatial distributions of the factor K values are shown in Table 5. According to the results obtained, 85.46% of the study area has strong erodibility potential. This situation indicates that plant management factor (C) and soil protection measures (P) have a determinative role for the soil losses in this area.
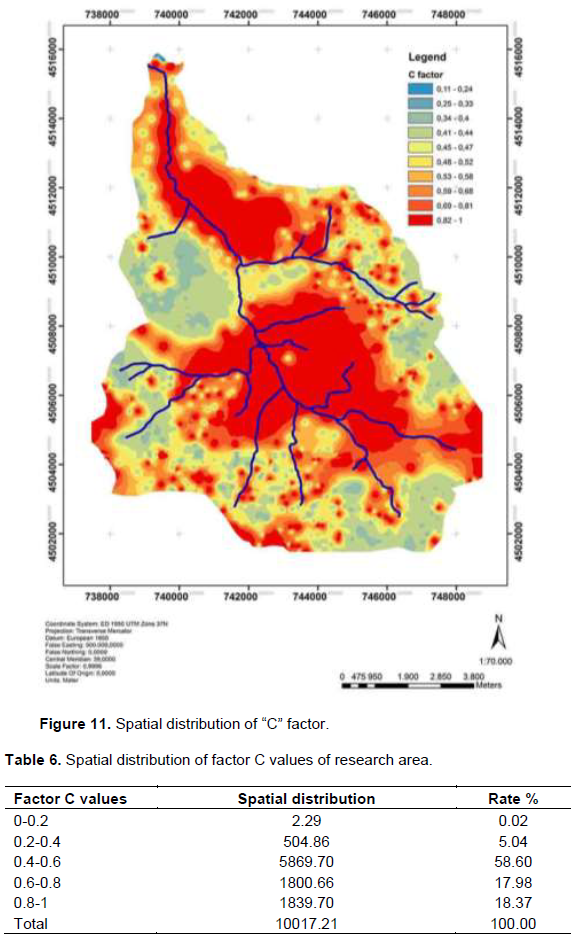
Crop management factor (C)
Up to 2,200 m yellow pine forest is common in the basin, and above 2,200 m level the European-Siberian origin plants are spread (Atalay, 2008). The vegetative situation in the research area was determined using the forest management plans and actual land cover maps; the factor C values used in predicting the abrasive effect of rainfall such as vegetation type, age and coverage rate, were determined using the values obtained by Canga (1995) and Atalay (2008). The C factor values map generated at this stage of the research (Figure 11) and the spatial and proportional distributions obtained from the corresponding maps are shown in Table 6. Approximately, 75% of the basin is lacking in the protection ability of plants.
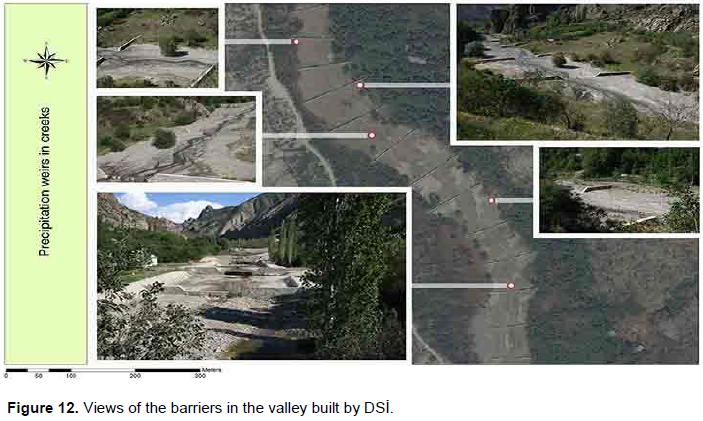
Soil conservation support practice factor (P)
Protective measures are necessary to prevent soil losses directly or indirectly. However, generally in this basin, there was no application for erosion control. General Directorate of State Hydraulic Works (DSI) built some barriers in the valley, however, the P factor was not evaluated since this situation could not be identified as the measures that prevent sediment transport into the valley within the basin (Figure 12).
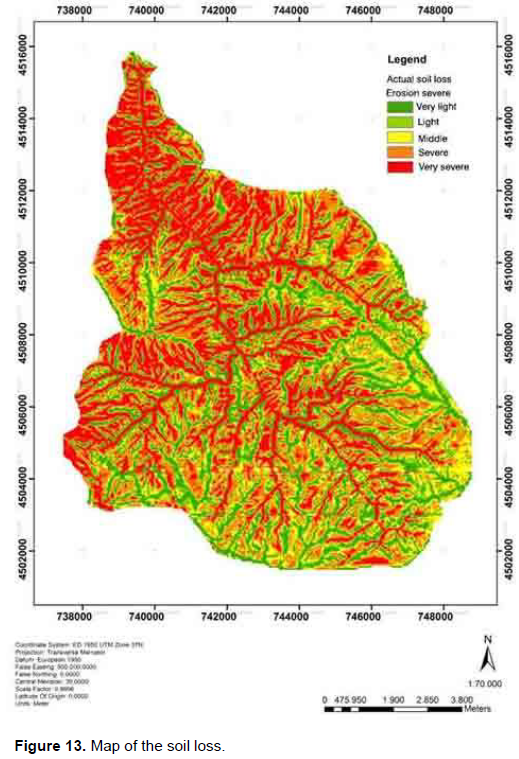
Estimation of soil loss amounts
The layer of each factor obtained was multiplied in the GIS program, and consequently the potential soil loss of the Oltu Anzav Basin was determined as ton ha-1year-1. When examined, the distribution map of potential erosion risk classes (Figure 13), especially in the geomorphologically narrow regions of the basin and in the collected areas of drainage lines, too much soil losses occur due to the decrease in plant density and low soil losses are observed in the upper parts of the basin with lower slope. According to the results of the research, the average actual soil loss of the basin was estimated as 24.45 t ha-1year-1. Tufekcioglu and Yavuz (2016) have conducted a research in Artvin province, close to our study area, and found the surface erosion soil loss as an average of 3.60 t ha-1 year-1. Different results under similar climatic and topographic conditions within the same basin are closely related with the variable K, C and P factors. A study conducted by Karakas (2005) have shown that while the annual soil was estimated as 0-5 ton ha-1 in Kuçukelmali Basin, it was determined as 0-15 ton ha-1 for Guvenc Basin, which are located in Sakarya River Basin. The annual soil loss was estimated as 0-75 ton ha-1 for Bolvadin/Degirmendere Basin (Celik, 2011). The annual soil loss for the region known as Ilgaz Mountain-Indagı Pass in Cankiri province was estimated as 0-15 ton ha-1 (Basaran, 2005). A study conducted by RUSLE method on Dudhawa Basin by Sahu et al. (2017) have shown that there is much more less than 5 ton ha-1 soil loss in 90% of the basin. Meghraoui et al. (2017) have estimated the annual soil loss as 150-200 t ha-1 in Sabaa Chioukh Mountains. Annual soil loss in Muhirapuzha River Basin was found as 3.60 t ha-1 in a study conducted by Thomas et al. (2017). Differences in the determination of results have shown that factors that causes soil loss in RUSLE methods differs from basin to basin. Since losses are calculated annually, the changes in land use directly affect these losses.
Kumar and Kushwaha (2013) determined the average loss of soil in the Shivalik Hills as 35.47 t ha-1year-1. They determined this value as 8.50 t ha-1year-1 in areas with very dense forest cover and as 134.9 t ha-1year-1 in degraded forest or bare areas. A study conducted by Molla and Biniam (2016) in Koga Watershed, Highlands of Ethiopia, showed that the annual average soil loss rate was 30.2 t ha-1year-1.
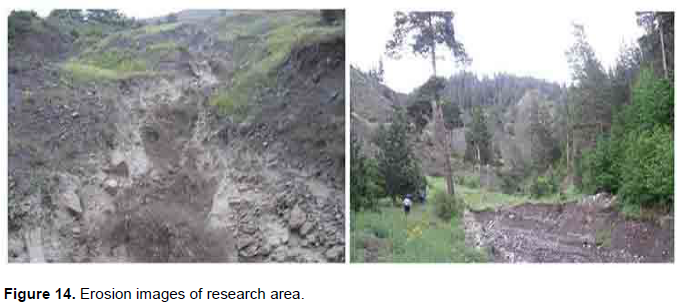
According to this classification system, in areas where erosion is not observed or erosion is seen as low, moderate, severe, very severe and extremely severe erosion, their coverage areas and distributions were investigated and the annual amount of total soil loss in the basin was estimated approximately. The erosion images of the study area are presented in Figure 14.
Modeling of two different hypothesized scenarios in the research basin
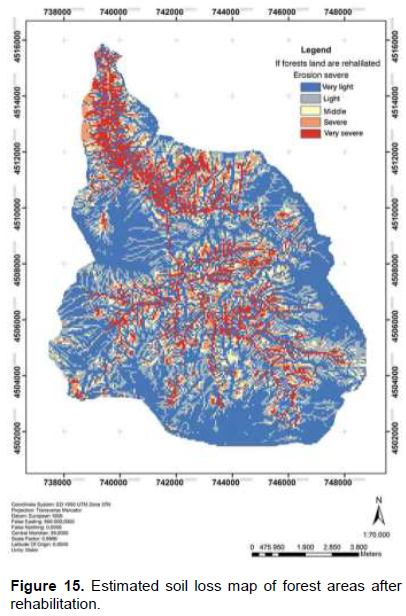
By analyzing the data that belong to all the factors needed in the GIS-based RUSLE method, potential soil losses that could occur have been estimated by modeling of two different scenarios such as rehabilitating the current forest areas in the basin and taking no precautions. Depending on the situation of rehabilitation of forest areas, afforestation of degraded forest areas was foreseen, and according to this case the factor C was recalculated and the soil loss maps were constructed as in Figure 15.
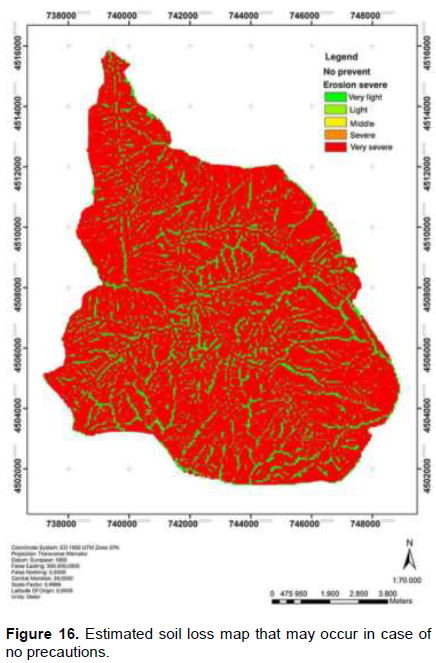
In case of no precautions taken in the basin, assuming that the damaged forest areas will be completely bare, the map of soil losses that can be constructed by re-calculating the C factor is shown in Figure 16. The spatial and proportional distributions of soil loss estimates, dealing with the current situation and the other two scenarios were given in Table 7.
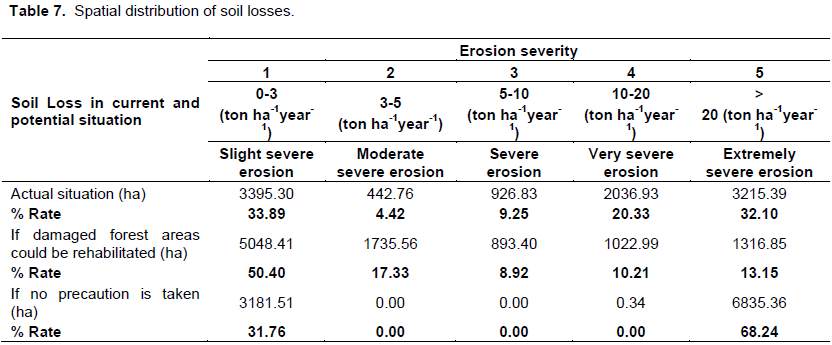
On the other hand, in case of rehabilitation of the forest areas in the basin, it is estimated that slight severe erosion could occur in 50.40%, moderate severity in 17.33%, severe in 8.92%, very severe in 10.21%, and extremely severe erosion in 13.15% of total area (Tables 7). In case of rehabilitation of degraded forest ecosystems, the average soil loss is estimated to decrease from 24.45 to 7.33 ton ha-1 (Tables 8). For this reason, rehabilitation projects should be implemented as soon as possible in the region. Terranova et al., (2009) emphasized that within the scope of protective land management, soil loss has decreased from 30 to 12.3 Mg-1ha-1 due to measures and application to reduce soil losses as cause of water erosion in southern Italy. A study conducted with RUSLE method by Ettazarini et al. (2017) in Argana Basin of Morocco has shown that almost 82.77% of the basin is under severe erosion. Differences in factors that play active role in soil loss cause different results. The important thing is to implement the proper methods in the field to reduce these effects.
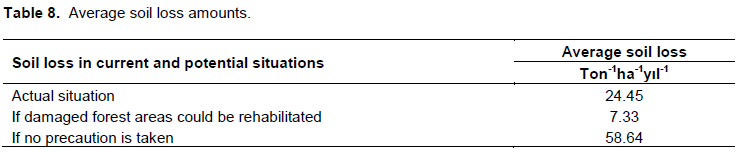
According to the scenarios, if no precautions are taken (if the grazing activities continue, and current degraded forest areas become completely bare), it is estimated that slight severe erosion could occur in 31.76% and very severe erosion may occur in 68.24% of the study area (Table 7). Finally, it is also estimated that the average soil loss in the basin could be increased from 24.45 to 58.64 ton ha-1year-1 (Table 8).
Field observations made in the research area and the studies conducted in the basin, has shown that the floods occur frequently in the research area and basin and this situation causes damages in agricultural land, animals and barns.
As the basin has generally steep structure, the soil has been transported by surface flow, and in some areas the bedrock has been surfaced. Productive forests and enough vegetation cover in some areas of the research basin can relatively reduce the damage that may occur. However, livestock, which is the main source of livelihood in the basin, causes grazing pressure in degraded forests. Due to this heavy and incorrect land use in the basin, the vegetation has been severely damaged and the soil has become extremely sensitive to erosion.
This high amount of soil transport demonstrates the importance of rehabilitation projects which should be planned in the basin (Table 8).
CONCLUSIONS
In order to determine the amount of soil loss and its spatial distribution in the Oltu Anzav Basin, the Revised Universal Soil Loss Equation (RUSLE) method, which is one of the most used methods, was used.
When the results of potential erosion maps generated by the RUSLE method were evaluated, the current soil losses at the basin are estimated as 24.45 ton ha-1year-1.
If the degraded forest areas could be rehabilitated (afforestation), the potential amount of annual soil loss may be 7.33 ton ha-1. However, if erosion control measures can be implemented in this area, this value could be lowered. If no precautions are taken and the existing degraded forest areas become completely bare under overgrazing pressure, the potential annual amount of soil loss could increase from 24.45 to 58.64 ton ha-1.
For this reason, taking soil conservation measures has become a basic condition for sustainability of the soil. The damaged forest areas belonging to the General Directorate of Forestry should be rehabilitated urgently and also afforestation work should be done. If there is no social problem for the local people, afforestation studies can be practiced within the scope of rehabilitation, and as such rosehip (Rosa canina), almond (Amygdalus communis L), walnut (Juglans regia sp.), yellow pine (Pinus sylvestris), and juniper (Juniperus sp.) seedlings can be planted in forest areas. Flooding terraces, contour stone bunds, stone threshold and cage wire threshold should be made in slopes of the study basin and then used to prevent floods and erosion at the same time.
CONFLICT OF INTERESTS
The authors have not declared any conflict of interests.
REFERENCES
|
Atala I (2008). Ecosystem ecology and geography. Volume: 1. Ä°zmir: META. Printing Services. |
|
|
Aydin M (2009). Determination of soil losses by WEPP (Water Erosion Prediction Project) according to Land use in the Gumushane-Torul dam watershed. Kastamonu Uni., Journal of Forestry Faculty 9(1):54. |
|
|
Balci AN (1996). Soil Conservation. Istanbul University Publication No. 3947, Faculty of Forestry Publication No. 439, Istanbul-Turkey. |
|
|
Bouaziz M, Leidig M, Gloaguen R (2011). Optimal parameter selection for qualitative regional erosion risk monitoring: A remote sensing study of SE Ethiopia, Geoscience Frontiers 2(2):237. |
|
|
Bouyoucos GI (1962). Hydrometer method improved for making particle size analysis of soils. Agronomy Journal 54:464-465. |
|
|
Canga M (1995). Soil Erosion. |
|
|
Celik V (2011). Risk analysis of soil erosion in Degirmen Dere Watershed (Bolvadin-Afyonkarahisar). Afyon Kocatepe University, Social Sciences Institute, Geograpy Department graduate thesis. |
|
|
CEM (2016). Characteristics of rainfall of Turkey RUSLE "R" Factor, General Directorate of Combating Desertification Publications(CEM) 43 p. |
|
|
CEMGM (A legal department related of Forestry) (2018). Combating Desertification and Erosion General Directorete of Turkey. |
|
|
Ekinci D (2007). Estimating of Soil Erosion in Lake Durusu Basin Using Revised USLE 3D with GIS, Çantay Press. |
|
|
Irvem A, Tulucu K (2004). Modelling for Estimation of Soil Loss and Sediment Yield Using Geographic Information System (EST) and Application to Seyhan-Korkun Sub watershed. Cukurova University, Cukurova University Science Institute Journal 13:1-7. |
|
|
Karabulut M, Kucukonder M (2008). Determination of Erosive areas by using GIS in KahramanmaraÅŸ plain and vicinity, KSU Journal of Science and Engineering 11(2):14. |
|
|
Karaoglu M (2012). Evaluation soil in terms of erosion in Igdır. Igdır University Journal of Science Institute 2(1):23. |
|
|
Karakas E (2005). Sustainable Management of Küçükelmalı and Güvenç Basins by Water and Sediment Yields. Unpublished PhD Thesis. Ankara University Institute of Science and Technology. |
|
|
Kumar S, Kushwaha SPS (2013). Modelling soil erosion risk based on RUSLE-3D using GIS in a Shivalik sub-watershed. Journal of Earth System Science 122(2):389-398. |
|
|
Meghraoui M, Habi M, Morsli B, Regagba M, Seladji A (2017). Mapping of soil erodibility and assessment of soil losses using the RUSLE model in the Sebaa Chioukh Mountains (northwest of Algeria). Journal of Water and Land Development (34):205-213. |
|
|
Meteorological General Directorate (MGD) (2018). Meteorological General Directorate. |
|
|
Molla T, Sisheber B (2016). Estimating Soil Erosion Risk and Evaluating Erosion Control Measures for Soil Conservation Planning at Koga Watershed, Highlands of Ethiopia. Solid Earth Discuss. View |
|
|
Mineral Research and Exploration (MRE) (2018). General Directorate of Mineral Research and Exploration. View |
|
|
Ozdemir AO, Tatar S (2016). GIS- Based RUSLE Method of the Erosion Risk Analysis in Isıklı Lake Basin. Electronic Journal of Map Technologies 8 (1):1-21. |
|
|
Ozsahin E (2014). Evaluation of erosion risk using RUSLE in Tekirdag, 11(3):45. |
|
|
Ozsahin UE, Keles K (2016). Erosion analysis by RUSLE method in Alakır Watershed (Antalya), Journal of Tekirdag Agricultural Faculty 13(2):123. |
|
|
Renard KG, Foster GR, Weesies GA, Mccool DK, Yoder DC (1997). Predicting Soil Erosion by Water: a Guide to Conservation Planning with the Revised Universal Soil Loss Equation (RUSLE). U.S. Department of Agriculture Handbook No: 703, US Department of Agriculture. |
|
|
Sahu A, Baghel T, Sinha MK, Ahmad I, Verma MK (2017). Soil Erosion Modeling using Rusle and GIS on Dudhawa Catchment. International Journal of Applied Environmental Sciences ISSN 0973-6077 12(6):1147-1158. |
|
|
Ettazarini S, Jakani ME, Najoui H (2017). Assessment of Soil Loss Risk Using Integrated Remote Sensing and Geographic Information System (gis) Techniques in the Argana Basin, Morocco. American Journal of Innovative Research and Applied Sciences 4(5):186-194. |
|
|
Sonmez ME, Celik MA, Seven M (2013). Determination of erosion risk areas using GIS and RUSLE in Kilis, Kahramanmaras Sutçu Imam University Journal of Social Sciences 10(1):21. |
|
|
Tagil S (2007). Evaluation land degradation risk using RUSLE model in Tuzla Watershed, Ecology Journal 17(65):11. |
|
|
Tufekcioglu M, Yavuz M (2016). Estimating surface soil erosion losses and mapping erosion risk for Yusufeli micro-catchment (Artvin). Artvin Coruh Univ. Journal of Forest Faculty 17(2):188-199 |
|
|
Terranova O, Antronico L, Coscarelli R, Iaquinta P (2009). Soil erosion risk scenarios in the Mediterranean environment using RUSLE and GIS: An application model for Calabria (southern Italy). Geomorphology 112(3-4):228-245. |
|
|
Thomas J, Joseph S, Thrivikramji KP (2017). Assessment of soil erosion in a tropical mountain river basin of the southern Western Ghats, India using RUSLE and GIS, Geoscience Frontiers. |
|
|
Uzunsoy O, Gorcelioglu E (1985). Basic principles and practices of watershed improvement. Publication of Istanbul University Forestry Faculty. |
|
|
Williams JR, Berndt HD (1972). Sediment yield computed with universal equation. Journal of Hydraulic Division. Proceedings of the American Society of Civil Engineers 98:2087-2098. |
|
|
Wischmeier WH, Johnson CB, Cross BW (1971). A Soil Erodibility Nomograph for Farmland and Construction Sites, Journal of Soil and Water Conservation 26 (5). |
|
|
Wischmeier WH, Smith DD (1978). Predicting rainfall erosion losses. A Guide to conservation planning. United States Department of Agriculture, Agricultural Research Service (USDA-ARS) Handbook, No.537. USDA, Science and Education Administration 62 p. |
|
|
Yarbasi N (2016). Geotechnical mapping of Oltu (Erzurum) residential area and its vicinity. Pamukkale University Journal of Engineering Sciences 22(6):538-545. |
|
|
Yuksel A, Akay AE, Reis M, Gundogan R (2007). Using The WEPP Model To Predict Sediment Yield In A Sample Watershed In Kahramanmaras Region. International Congress on River Basin Management pp. 1-21. |
|
|
Zengin M, Ozer S, Ozgul M (2009). Determination of erosion degree by GIS in Coruh Watershed (Ispir-Pazaryolu) and solution proposals, Atatürk University Journal of Agriculture Faculty 40(1):9-19. |
|
Copyright © 2024 Author(s) retain the copyright of this article.
This article is published under the terms of the Creative Commons Attribution License 4.0


