ABSTRACT
Extraction of non-degraded and contaminant-free DNA from field specimen requires collection under liquid nitrogen which is not readily available in resource constrained laboratories in low and middle income countries (LMICs). A method of extracting DNA from silica gel-preserved common bean (Proteus vulgaris L.) leaves is presented. The method, which does not involve the use of phenol, chloroform or isoamyl alcohol also obviates the need for low temperature incubation during the DNA extraction steps and the grinding of desiccated leaf tissue in liquid nitrogen. It relies on inactivating proteins using SDS and proteinase K along with precipitation of polysaccharides using a high salt solution (0.8 M NaCl). DNA is further purified by exploiting its insolubility in aqueous media. High quality pure DNA (mean concentration 2.84 ± 0.013 µg/g of dry leaf tissue) with mean DNA purity values of 2.1 ± 0.1 was extracted. The DNA was also found to be free of protein and polysaccharide contamination. This method enables DNA amplification using molecular markers routinely used in molecular biology laboratories like random amplified polymorphic (RAPD) markers, inter simple sequence repeat (ISSR) markers, sequence-characterized amplified region (SCAR) markers and simple sequence repeat (SSR) markers. The findings of this study show that it is possible to obtain high quality DNA from leaf tissue preserved in silica gel. The method used in this research will be invaluable to resource constrained laboratories in low and middle income countries (LMICs) that cannot afford to buy or access liquid nitrogen in order to extract high quality DNA and for research groups undertaking field surveys that require several days or weeks off station without laboratory freezers to maintain the integrity of the tissues which is crucial for obtaining high quality DNA.
Key words: Random amplified polymorphic (RAPD), inter simple sequence repeat (ISSR), simple sequence repeat (SSR), sequence-characterized amplified region (SCAR), deoxyribonucleic acid (DNA), low and middle income countries (LMICs).
Good quality of DNA is a pre-requisite for most applications in a molecular biology laboratory. A number
of DNA mini prep protocols have been developed and some of them (Agbagwa et al., 2012; Sahu et al., 2012; Aubakirova et al., 2014; Abdel-Latif and Osman, 2017; Shu et al., 2018) rely on modification of earlier sodium dodecylsulphate (SDS) or cetyltrimethyl ammonium bromide (CTAB) protocols (Rogers and Bendich, 1985; Edwards et al., 1991). Others are fast methods and rely on release of DNA from plant tissue using sodium hydroxide (Wang et al., 1993), by boiling (Thompson and Henry, 1995) or microwave treatment (Saini et al., 1999).
Extraction of DNA from plant tissues using in-house DNA extraction buffer formulations generally involves three stages; breaking the cell wall to release cellular constituents by grinding tissue in dry ice, liquid nitrogen or fine sand using a pestle and mortar or grinder; disrupting the cell membrane to release DNA into the extraction buffer; and use of detergents like SDS or CTAB to solubilize cell wall components and protect the DNA from nucleases using a chelating-like ethylenediaminetetracetic acid (EDTA). EDTA deprives the nucleases of magnesium ions thereby rendering them inactive.
Separation and denaturation of proteins from DNA is achieved by either emulsifying the buffer-tissue mixture with chloroform and/or phenol or by incorporating reducing agents like β- mercaptoethanol, dithiothreitol or sodium sulphite in the DNA extraction buffer (Baranwal et al., 2003; Abu-Romman, 2011; Das et al., 2013). Additional steps to minimize DNA degradation include minimizing turbulence by gently pipetting the DNA solution and exposure time between pulverization and contact with the DNA extraction buffer. However, despite all these safeguards, producing high quality DNA devoid of degradation remains a big challenge.
To mitigate the effects of degraded DNA, DNA extraction kits have been developed to facilitate the rapid extraction of very highly pure DNA. Such kits use a membrane within a column that binds DNA. Commonly used kits include DNeasy plant mini and maxi kits, Wizard genomic DNA purification kit and GENEspin (Tamari and Hinkley, 2016). The disadvantage of such kits is that they are not economically feasible in resource constrained laboratories or laboratories that process a huge volume of samples. In addition, the experimenters have limited options modifying the standard protocols. However, the kits are easy to use, contain all reagents for DNA extraction, require minimal laboratory equipment (usually a centrifuge and micropipettes) and use very few consumables (only pipette tips and micro centrifuge tubes). Another alternative to the DNA extraction kits is the extraction of DNA from leaf tissue immobilized on a paper matrix. A number of proprietary methods of extracting DNA from leaf tissue prepared this way include; IsoCode card (Schelidher and Schuell, Dassel, Germany), generation capture system (Biozym diagnostika GmBH, Hessisch-Oldendorf, Germany) and FTA cards (Whatman, Kent, UK). FTA methodology relies on spotting tissue onto the cards and cutting small discs (1.5 to 2 mm) using a tissue biopsy punch followed by washing of the discs using a proprietary reagent and isopropanol. The DNA remains are impregnated onto the disc which is then used for polymerase chain reaction (PCR) analysis. The method has been successfully used for human forensic studies (Zhong et al., 2001), wildlife DNA (Smith and Burgoyne, 2004), PCR based genotyping and plant diagnostics (Drescher and Graner, 2002).
Extraction of high quality DNA in the laboratory using in-house DNA extraction buffer formulations requires either freshly picked specimen collected under liquid nitrogen for immediate use or specimen collected under liquid nitrogen and stored at -80°C for later use. Both options are impractical because most field surveys are conducted hundreds of kilometers off station and therefore maintaining the integrity of the tissue to obtain high quality DNA is usually hard. The objective of this study was to develop a safe, inexpensive and robust protocol for extracting high quality DNA from silica gel dried common bean leaf specimen using equipment that is expected to be available in a basic molecular biology laboratory. In addition, the utility of the DNA obtained using common molecular marker systems- simple sequence repeat (SSR) markers, inter simple sequence repeat markers (ISSR), sequence characterized amplified region (SCAR) markers and random amplified polymorphic DNA (RAPD) markers is also demonstrated.
Bean seed was sown into sterilized soil in 5-L plastic pots in the screenhouse at Kawanda, Wakiso district of Uganda. A trifoliate leaf was picked from one of the three plants 10 days after sowing, weighed, wrapped in aluminum foil and put in a sealable plastic bag containing 10 g silica gel. The plastic bag was then put in a Secador desiccator (LabSource, Northlake, IL), stored for seven days and re-weighed. Just before DNA extraction, a DNA extraction buffer containing 0.2 M Tris-HCl, 0.8 M NaCl, 1% SDS, 20 mM EDTA and 60 µg/mL Proteinase K was prepared.
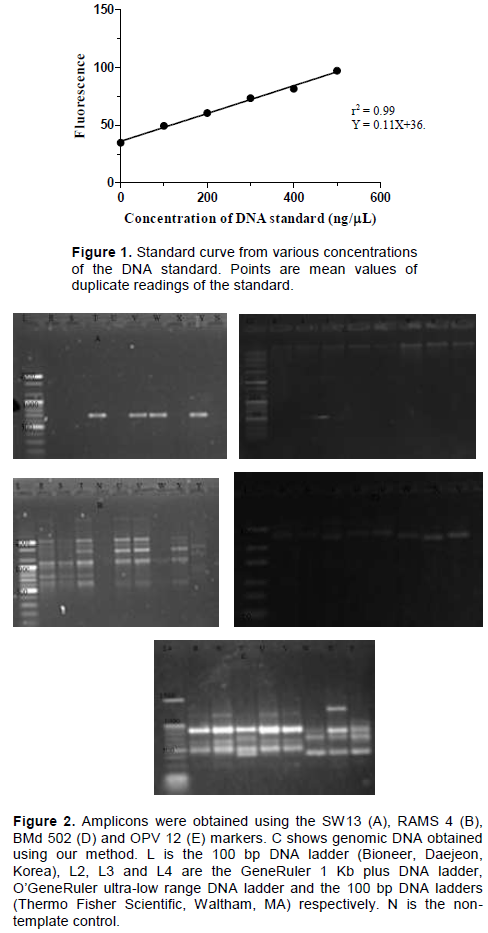
DNA extraction began by grinding the dry leaf in 700 µL of the buffer using a pestle and mortar. The solution was then incubated in a water bath at 65°C for 1 h. After incubation, the mixture was centrifuged at 13200 rpm for 10 min and 300 µL was transferred to a fresh 1.5 mL tube. Thereafter, 150 µL of 5 M NaCl and 900 µL of room temperature absolute ethanol was then added to the supernatant and the mixture was left at room temperature for 2 h to precipitate the DNA. The mixture was further centrifuged at 13200 rpm for 10 min and the supernatant discarded. The resultant pellet was washed twice with 70% ethanol at room temperature. The pellet was then dried at room temperature for 20 min and dissolved in 70 µL of 1 X TE buffer (10 mM Tris-HC1 [pH 8], 1 mM EDTA). The DNA solution was then treated with RNase A at a final concentration of 50 µg/mL for 2 h, quantified using the DQ300 fluorometer and immediately used for molecular assays. DNA quality and purity were further assessed by comparing the ratio of the absorbance at 260 nm to absorbance 280 nm (A260/280) and the ratio of absorbance at 260 nm to absorbance 230 nm (A260/230) respectively, using a NanoDrop 2000c spectrophotometer (Thermo Fisher, Wilmington, DE). Prior to quantification of the DNA, a standard curve (Figure 1) was generated from various concentrations (100-500 ng/µL) of a known DNA standard (calf thymus DNA) using the DyNAquant DQ 300 fluorometer (Hoefer, Holliston, MA) with the Hoechst 33258 stain (Thermo Fisher, Wilmington, DE) as the fluorescent dye. The standard curve was plotted using the GraphPad prism software v.5.00 (GraphPad Software, La Jolla California USA, www.graphpad.com).
PCR amplification
All PCR amplifications were carried out in 20 µL reactions consisting of 100 ng of DNA, 0.2 mM dNTPs, 2 mM MgCl2, 1 × PCR buffer, 0.5 U Taq DNA polymerase (Bioneer, Daejeon, Korea) and 0.5 µM of primers.
For the SSR marker BMd 502 (Blair et al., 2009), the reaction mixture was amplified using an initial denaturation at 95°C for 5 min and 36 cycles of a touchdown profile each consisting of a denaturation step at 95°C for 20 s, an annealing step at 0.5 to 70°C each cycle for 20 s and an extension step at 72°C for 30 s. Thereafter, a final extension step was performed at 72°C for 5 min and the reaction was stored at 8°C.
The RAPD marker OPV 12 (Operon RAPD 10mer kit, Cosmogenetech, Seongdong-gu, Korea) and the ISSR marker RAMS 4 (Hantula et al., 1996) both used a similar thermal cycling profile consisting of an initial denaturation at 95°C for 5 min and 40 cycles each consisting of a denaturation step at 95°C for 20 s, an annealing step at 45°C for 40 s and an extension step at 72°C for 60 s with a final extension step at 72°C for 10 min and storage at 8°C.
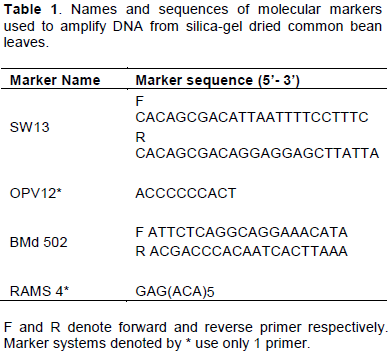
The SCAR marker SW13 (Melotto et al., 1996) was amplified with the following thermal profile; initial denaturation at 95°C for 5 min and 30 cycles each consisting of a denaturation at 94°C for 10 s, annealing at 50°C for 20 s and extension at 72°C for 40 s. Thereafter, there was a final extension at 72°C for 5 min and finally, the reaction was stored at 8°C. The marker names, types and sequences used are shown in Table 1.
Electrophoresis, staining, visualization and gel documentation
The amplicons obtained with the BMd 502 marker were resolved on acrylamide gel using the horizontal polyacrylamide gel electrophoresis (hPAGE) set (Cleaver Scientific, Warwickshire, UK). Briefly, 50 mL of a 6% denaturing polyacrylamide gel consisting of 21 g urea, 1 mL 50 X TAE, 7.5 mL of 40% acrylamide-bis acrylamide (19:1 acrylamide: bis-acrylamide) mix, 100 µL TEMED and 500 µL of 10% APS was made. The solution was then cast onto a hPAGE gel casting unit and a quarter plate overlaid. The mixture was left at room temperature for 30 min to allow complete polymerization of the acrylamide gel mixture. Electrophoresis was performed at 100 V in 1 X TAE (0.04 M Tris–Acetate, 0.0001 M EDTA) for 2 h after which the gel was put for staining in 0.5 µg/mL ethidium bromide for 40 min. Finally, the image was captured using the G: BOX gel documentation system (Syngene, Fredrick, MD).
Amplicons of the RAMS 4, SW13 and OPV12 markers were resolved on 1.5% agarose gel in 1 X TAE at 100 V for 1 h. The staining procedures and image documentation were like for the SSR marker.
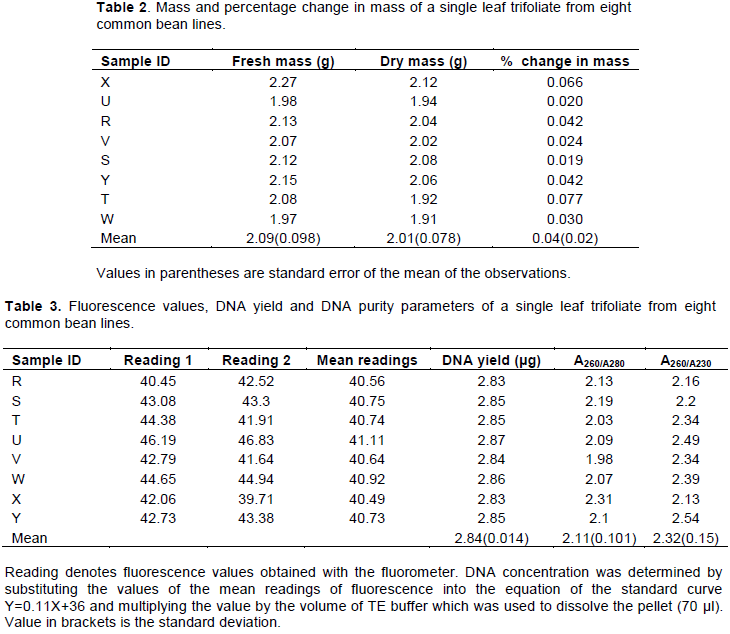
A clear, non-viscous DNA solution was obtained after dissolving the DNA pellet in the TE buffer. The DNA also showed minimum degradation and it was amplified by all the molecular markers assayed (Figure 2). The readings were derived from the standard curve (Figure 1) which showed high accuracy. The standard curve had a high value of r2 (0.99).
The average mass of the fresh and dry leaves was 2.09 and 2.01 g respectively representing a 4% change in mass of tissue (Table 2). The mean amount of DNA per gram of dry tissue was 2.84 µg. The DNA obtained was also pure with a mean value of the ratio of the absorbance at 260 nm to absorbance 280 nm (A260/280) of 2.1. The mean value of the ratio of absorbance at 260 nm to absorbance 230 nm (A260/230) indicates that the protein concentration was 2.3. These values are summarized in Table 3.
The objective of this study was to develop a DNA extraction protocol for the recovery of high quality DNA for the DNA concentration were very accurate since they from field specimen. A moderate amount of DNA was extracted. The findings here are lower than those of Agbagwa et al. (2012) who obtained up to 10 µg of DNA per gram of tissue of Cajanus species. The reason for the difference in the amount of DNA recovered could be the method of quantification. The study by Agbagwa et al. (2012) used spectrophotometric methods to quantify the DNA while the present study used fluorescence. Spectrophotometric (absorbance) methods overestimate the amount of DNA by quantifying single stranded DNA and RNA alongside double stranded (ds) DNA (O’Neill et al., 2011; Sironen et al., 2011) but fluorescent dyes bind only to dsDNA. The Hoechst 33258 dye used in our study is a class of non-intercalating benzimidazole fluorescent dyes that preferentially binds to A/T-rich regions in the minor groove of dsDNA (Weisblum and Haenssler, 1974). Therefore, the amount of DNA obtained with our method will vary according to the proportion of A+T content of the genomic DNA of various plant species.
The DNA solution was clear and not viscous. These observations are indicative of the quality of the DNA and they are supported by our values of the measures for DNA purity and absence of DNA contaminants being within the ranges stipulated for highly pure DNA (A260/280 = 1.7-2, A260/230 >2, respectively) (Thermo Scientific, 2010; Green and Sambrook, 2018). The clarity of the DNA is suggestive of absence of contaminating secondary metabolites especially polyphenolic compounds like tannins and terpenoids. These compounds are rapidly oxidized when released from tissue and bind to the phosphate backbone of DNA imparting a brown-red color to the DNA (Sahu et al., 2012). A non-viscous DNA solution is indicative of minimum contamination of DNA with polysaccharides. It has been reported that the chemical properties of polysaccharides make them co-precipitate with genomic DNA giving DNA solutions a viscous appearance (Porebski et al., 1997). Two reasons were advanced for the low levels of contaminants. The age of the tissue used and use of high concentration of NaCl in the extraction buffer and in the precipitation of DNA (instead of sodium, potassium or ammonium acetate). Young leaf tissues contain low levels of secondary metabolites like polysaccharides and polyphenols while NaCl not only minimizes the formation of polysaccharides but also prevents them from co-precipitating with the DNA (Carrier et al., 2011; Sahu et al., 2012).
The DNA obtained showed minimal degradation. It is believed this was due to the activity of DNases during the maceration with sand. Labuza (1970) reviewed the properties of water under food preservation conditions and concluded that the water in food does not leak out unless there is damage to the membranes. Based on this observation, we want to think that drying under silica gel is somewhat stringent resulting in the lysis of the membranes. DNases then gain access to the DNA causing its degradation. Macerating the tissue in liquid nitrogen can reduce degradation.
This research has demonstrated an inexpensive, reliable and scalable method that recovers good quality DNA from field specimen without prior preservation in liquid nitrogen. The DNA was also amplified using common molecular marker systems. The method used in this study will find particular utility in resource constrained laboratories in low and middle income countries (LMICs) that are keen on using marker assisted selection (MAS) in their breeding activities.
The authors have not declared any conflict of interests.
The authors thank CIAT for funding this study. The technical support provided by the CIAT staff (Musoke Stephen, Hasifa Nababi and Samuel Kiviri) is also highly appreciated.
REFERENCES
|
Abdel-Latif A, Osman G (2017). Comparison of three genomic DNA extraction methods to obtain high DNA quality from maize. Plant methods 13:1.
Crossref
|
|
|
|
Abu-Romman S (2011). Comparison of methods for extracting high quality DNA from sage (Salvia officinalis). Journal of medicinal plants research 5(6):938-941.
|
|
|
|
|
Agbagwa IO, Datta S, Patil PG, Singh P, Nadarajan N (2012). A protocol for high-quality genomic DNA extraction from legumes. Genetics and Molecular Research 11(4):4632-4639.
Crossref
|
|
|
|
|
Aubakirova K, Omasheva M, Ryabushkina N, Tazhibaev T, Kampitova G, Galiakparov N (2014). Evaluation of five protocols for DNA extraction from leaves of Malus sieversii, Vitis vinifera, and Armeniaca vulgaris. Genetics and molecular research 13(1):1278-1287.
Crossref
|
|
|
|
|
Baranwal VK, Majumder S, Ahlawat YS, Singh RP. (2003). Sodium sulphite yields improved DNA of higher stability for PCR detection of citrus yellow mosaic virus from citrus leaves. Journal of Virological Methods 112(1-2):153-156.
Crossref
|
|
|
|
|
Blair MW, Mu-oz-Torres M, Giraldo MC, Pedraza F (2009). Development and diversity assessment of Andean-derived, gene-based microsatellites for common bean (Phaseolus vulgaris L.) BMC
|
|
|
|
|
Carrier G, Santoni S, Rodier-Goud M, Canaguier A, De Kochko A, Dubreuil-Tranchant C, This P, Boursiquot J-M, Le Cunff L (2011). An efficient and rapid protocol for plant nuclear DNA preparation suitable for next generation sequencing methods. American Journal of Botany 98(1):e13-15.
Crossref
|
|
|
|
|
Das SS, Das S, Ghosh P (2013). Optimization of DNA isolation and RAPD-PCR protocol of Acanthus volubilis wall., a rare mangrove plant from Indian Sundarban, for conservation concern. European Journal of Experimental Biology 3(6):33-38.
|
|
|
|
|
Drescher A, Graner A (2002). PCR genotyping of barley seedlings using DNA samples from tissue. Plant breeding 121:228-231.
Crossref
|
|
|
|
|
Edwards K, Johnstone C, Thompson C (1991). A simple and rapid method for the preparation of plant genomic DNA for PCR analysis. Nucleic Acids Research 19:1349.
Crossref
|
|
|
|
|
Green MR, Sambrook J (2018). Rapid Isolation of Yeast DNA. Cold spring harbor protocols.
Crossref
|
|
|
|
|
Hantula J, Dusabenyagasani M, Hamelin RC (1996). Random amplified microsatellites (RAMS)-a novel method for characterizing genetic variation within fungi. European Journal of Forest Pathology 26:159-166.
Crossref
|
|
|
|
|
Labuza TP (1970). Water content and stability of low moisture and intermediate moisture foods. Food Technology 24:543-550.
|
|
|
|
|
O'Neill M, McPartlin J, Arthure K, Riedel S, McMillan N (2011). Comparison of the TLDA with the Nanodrop and the reference Qubit system. Journal of Physics: Conference series 307(1):1-6.
Crossref
|
|
|
|
|
Melotto M, Afanador L, Kelly J (1996). Development of a SCAR marker linked to the I gene in common bean. Genome 39:1216-1219.
Crossref
|
|
|
|
|
Porebski S, Bailey LG, Baum BR (1997). Modification of a CTAB DNA extraction protocol for plants containing high polysaccharide and polyphenol components. Plant molecular biology reporter 15:8-15.
Crossref
|
|
|
|
|
Rogers SO, Bendich AJ (1985). Extraction of DNA from milligram amounts of fresh, herbarium and mummified plant tissue. Plant Molecular Biology 5:69-76.
Crossref
|
|
|
|
|
Saini HS, Shepherd M, Henry NJ (1999). Microwave extraction of total genomic DNA from barley grains for use in PCR. Journal of the Institute of Brewing 105:185-190.
Crossref
|
|
|
|
|
Sahu SK, Thangaraj M, Kathiresan K (2012). DNA extraction protocol for plants with high levels of secondary metabolites and polysaccharides without using liquid nitrogen and phenol. ISRN Molecular Biology 6(4).
Crossref
|
|
|
|
|
Shu Y, Wan-Ting J, Ya-Ning Y, Yu-Han F (2018). An optimized CTAB method for genomic DNA extraction from freshly-picked pinnae of fern, Adiantum capillus-veneris L. bio-protocol 8(13). e2906.
|
|
|
|
|
Sironen A, Uimari P, Vilkki J (2011). Comparison of different DNA extraction methods from hair root follicles to genotype Finnish landrace boars with the illumina porcineSNP60 beadchip. Agricultural and Food Science 20(2):143-150.
Crossref
|
|
|
|
|
Smith LM, Burgoyne GA (2004). Collecting archiving and processing DNA from wildlife samples using FTA databasing paper. BMC Ecology 4:4.
Crossref
|
|
|
|
|
Tamari F, Hinkley CS (2016). Extraction of DNA from plant tissue: review and protocols. In: Micic M (ed), sample preparation techniques for soil, plant and animal samples pp245-263.
Crossref
|
|
|
|
|
Thermo Scientific (2010). NanoDrop spectrophotometers technical bulletin T-042.
|
|
|
|
|
Thompson D, Henry R (1995). Single step protocol for preparation of plant tissues for analysis by PCR. Biotechniques 19:394-400.
|
|
|
|
|
Wang H, Qi M, Cutler AJ (1993). A simple method for preparing plant samples for PCR. Nucleic Acids Research 21: 4153-4154.
Crossref
|
|
|
|
|
Weisblum B, Haenssler E (1974). Fluorometric properties of the bibenzimidazole derivative Hoechst 33258, a fluorescent probe speciï¬c for AT concentration in chromosomal DNA. Chromosoma 46:255-260.
Crossref
|
|
|
|
|
Zhong KJ, Salas CJ, Shafer R, Gubanov A, Gasser RA, Magill AJ, Forney JR, Kain KC (2001). Comparison of IsoCode STIX and FTA Gene Guard collection matrices as whole- blood storage and processing devices for diagnosis of malaria by PCR. Journal of Clinical Microbiology 39(3):1195-1196.
Crossref
|
|