ABSTRACT
Maize (Zea mays L.) is the staple food in Kenya, and mapping the qualitative trait loci (QTL) associated with resistance to maize stem borer pest is important towards marker assisted breeding for this quantitative trait. The objective of this study was to identify any QTL associated with resistance to Chilo partellus and Busseola fusca, the two important stem borer pests in maize production in Kenya. A total of 203 F2:3 individuals from a cross between CML442, a stem borer susceptible maize inbred line and CKSBL10026, a stem borer resistant maize inbred line; and 152 SNPs were used for mapping the QTL. Data were collected on leaf damage, stem borer exit holes and stem tunneling length as putative stem borer damage traits. A likelihood odds ratio (LOD) scores of 3.0 and maximum recombination frequency of 0.50 were used to declare linkage. LOD scores between 2.5 and 2.9 were considered strong indications of a QTL. Resistance QTL for the three putative traits were detected on chromosomes 1-7 and 9 for both individual locations and stem borer species analysis. In B. fusca sites, one QTL for reduced stem tunnelling was revealed on chromosome 4 while in the C. partellus sites, one QTL for reduced stem tunnelling was identified on chromosome 4 and another for reduced stem borer exit holes was identified on chromosome 5. Phenotypic variances explained ranged from 6 to 10%, suggesting a need to validate these QTL using a larger population and in different environments.
Key words: Busseola fusca, Chilo partellus, mapping, quantitative trait loci (QTL), resistance, single nucleotide polymorphisms (SNPs), stem borer.
Insect pests affect 46% of global maize growing area causing about 24.5% of world maize loss annually. In economic terms, 52 million tons of grain valued at $5.7 billion is lost, and US $550 million worth of insecticide is
used annually to curb losses (Mugo et al., 2012). Annual losses due to pests in Africa are about 17%. Maize stem borer species are the primary field pests that feed on leaves, cob and pith resulting in stem damage and grain yield losses in the entire world wherever maize is grown (Mihm, 1997; Samayoa et al., 2015a). The stem borer pest is also one of the most important maize field pests in sub-Saharan Africa (Kfir et al., 2002; Smale et al., 2011; Calatayud et al., 2014). Increased maize productivity beyond the current two (2) tons per hectare is critical for food security in sub- Saharan Africa. The stem borers are some of the major pests that account for the low maize production, with lepidopteran stem borers, including the African stem borer (Busseola fusca Fuller), the spotted stem borer (Chilo partellus Swinhoe) and the pink stem borer (Sesamia Calamistis Hampson) being the most damaging pests in eastern and southern Africa, where they cause 13 to 40% yield losses (De Groote, 2002; Mailafiya et al., 2011). In Kenya, the major maize stem borer species are C. partellus, B. fusca and S. calamistis. C. partellus is found in the warmer and lower areas, B. fusca is predominant in the cooler and higher altitudes areas while S. calamistis is found in low densities in all ecologies in Kenya (Ong’amo et al., 2006).
Lepidopteran maize stem borers are serious pests in sub-Saharan Africa region because besides the reduced grain cereal yields, they cause direct losses through loss of photosynthetic leaf area, results in dead hearts which leads to lodging from damaged stems. Plants also suffer from increased ear rots and are predisposed to infections by Aspergillus flavus and contamination with mycotoxins (Kfir et al., 2002; Mugo et al., 2012; Muturi et al., 2012). The lepidopteran stem borers, therefore, poses major threats to sustained food sufficiency in sub-Saharan Africa region causing annual yield losses of approximately 15%, and particularly in Kenya where they cause losses estimated at 13.5% (De Groote, 2002). The recommended control methods which include cultural, chemical and biological have not been successful. The most recently recommended control method has been by use of Bt (Bacillus thuringiensis) gene, however, its use has not been authorised in Kenya and in majority of the sub-Saharan African countries. The Bt control solution further remains elusive because recent studies have reported reduced efficacy of Bt transgenes as some of the important pests have already developed resistance since its registration in 1996 (Campagne et al., 2013; Jiménez-Galindo et al., 2017). Natural levels of resistance in elite maize varieties remain insufficient to manage the stem borer pest and detection of resistance QTL could enhance breeding for this trait through marker-assisted breeding or genomic selection (Samayoa et al., 2015a). Host plant resistance could be the most economically feasible and ecologically sound method as it is technically and socially acceptable.
The stem borer resistance is quantitatively inherited and progress in breeding for resistance through conventional methods has been slow (Jampatong et al., 2002). Stem borer resistance using conventional breeding methods has been elusive due to limited genetic variation, the difficulty in maintaining a quantitative trait, and having to deal with two organisms; pests and hosts (Mugo et al., 2002). The trait is controlled by many genes of small effects, thus, there has not been any immune inbred lines developed for its control this far. International Maize and Wheat Improvement Center (CIMMYT) has, however, endeavoured to continue developing inbred lines with high resistance levels and commits much resource in maintaining and improving them. Marker assisted selection for this trait might fast track the breeding process for the many regions in sub-Saharan Africa region where maize stem borers remain a threat to food security.
Mapping of quantitative trait loci (QTL) associated with stem borer resistance would be an important step towards improving efficiency in breeding using marker assisted breeding (MAB). To date, there are several molecular markers available and coupled with the completion of sequencing of the sorghum genome (Bedell et al., 2005) provides opportunities to exploit advances in genomics and genetics for resistance breeding. Such markers especially when tightly linked to resistance loci can support the introgression and selection of associated traits in early generations of breeding, thus minimizing the need for extensive and expensive phenotypic analysis (Drinic et al., 2004). Quantitative trait loci (QTL) for insect resistance in some temperate and tropical maize germplasm against various maize stem-borer species have been detected and documented (Bohn et al., 2000; Samayoa et al., 2015b; Jiménez-Galindo et al., 2017). Such results lead to the conclusion that QTL too can be found for resistance to tropical stem borers including C. partellus and B. fusca and could underpin MAB in the future. It should also be noted that marker-assisted breeding is an expanding breeding frontier to improve the efficiency of plant breeding through the transfer of specific genomic regions of interest and accelerating the recovery of the elite parent background (Robyn, 2008).
Several methods for QTL mapping have been used and include simple interval mapping, composite interval mapping (fairly similar to multiple QTL mapping) and association mapping (Toure et al., 2000). Both simple interval mapping and composite interval mapping are mainly based on maximum likelihood regression and calculate the most likely position of a QTL within a certain interval between two flanking markers. However, though composite mapping is quite similar to simple interval mapping it possesses improved power because it includes additional genetic predictors, called ‘cofactors’ that represent QTL elsewhere in the genome and which absorb background genetic noise (Van Eeuwijk et al., 2010). Multiple QTL mapping (MQM) method was used in this study because theoretically, it reduces the error variance and increases the power for detecting QTL. Multiple QTL mapping (MQM) is a mapping method that has advantages above other QTL mapping methods as it reduces linkage by considering cofactors to obtain a higher power when mapping QTLs. It applies a backward model selection procedure using an analysis of deviance approach. The use of co-factors and employing a backward model selection can help identify previously unknown locations underlying complex traits (Scott et al., 1966; Arends et al., 2010).
While association mapping (linkage disequilibrium mapping) is a recent and more reliable method of locating putative QTL, the method does not deal with a fixed population like interval and multiple QTL mapping but is based on a random and larger population (Yan et al., 2011). Because of the fixed nature of the 203 F2:3 populations used in this study, multiple QTL mapping was applied for locating putative QTL. The objective of this study was to map the QTL associated with resistance to C. Partellus and B. fusca stem borer species in a tropical maize population using stem tunnelling, number of stem borer exit holes and leaf damage score as putative stem borer-resistance traits.
Field trials for phenotypic data
The F2:3 mapping population was developed from the cross between CIMMYT’s highly susceptible inbred line CML442 and multiple borer resistant (MBR) inbred line CKSBL10026. These two parents, both developed by CIMMYT were genetically divergent and had great differences for the resistance traits of interest (leaf damage score, cumulative stem tunnel length and number of stem borer exit holes). The F2 and F3 progenies were developed by self pollinating previous F1 and F2 materials, respectively. Concurrently, three male rows of single cross tester CML395 x CML444 were sown preceding the female F2:3 rows. These families were used for the purpose of harvesting leaves for molecular analysis and were also crossed with the single cross tester for seed increase to enable multi locational phenotyping. Leaf samples for molecular analysis were collected from the F2:3 generation. Tender leaves from 15 representative plants were picked at seedling stage and transferred to Biosciences east and central Africa (BecA) laboratory in Nairobi and preserved at -80°C. The testcross ears were harvested and a population of 203 selected based on amount of seeds achieved after the hand pollination. These ears were shelled for the purpose of multi-environmental phenotyping.
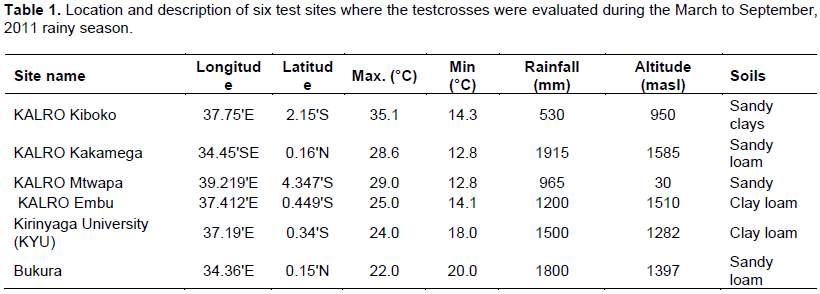
In March 2011, the 203 F2:3 testcrosses were planted for phenotyping across six environments across Kenya that included Kenya Agricultural Livestock Research Organization (KALRO) Kiboko, KALRO Mtwapa, Kirinyaga University, KALRO Kakamega, Bukura and KALRO Embu sites (Table 1). The α- lattice design replicated three times was used in a 2 × 5 m rows plot spaced at 75 cm between rows and 25 cm between plants. B. fusca stem borer larvae were used for infestation at Kakamega, Bukura and Embu sites, while C. partellus larvae were used for Mtwapa, Kiboko and Kirinyaga University sites. Ten plants in each plot were each artificially infested with five stem borer neonates three weeks after planting. The remaining plants were concurrently treated with an insecticide (Bulldock® 25 EC = 25 g/l Beta-Cyfluthrin - AI) to act as a control. The trials were grown under rain-fed conditions but supplemental irrigation was applied as needed. Fertilizers were applied at the rate of 60 kg/ha N and 102 kg/ha P2O5 at planting. The crop was top-dressed at the rate of 48 kg N/ha 30 days after planting. Planting, weeding, harvesting and shelling operations were performed manually.
Data collection
Data was taken on leaf-damage visual-rating score two weeks after infestation on a scale of 1 to 9 on an individual plant basis, according to Tefera et al. (2011), where 1 = no visible leaf damage and 9 = plants dying as a result of leaf damage. At harvest, the numbers of stem exit holes were counted and the cumulative tunnel length (cm) was measured after splitting the maize stems. Grain yield (t/ha) was computed from shelled grain weight and standardized to 12.5% moisture content.
Phenotypic data analysis
Analysis of variance was performed using the PROC GLM procedure SAS package (2007) and the means compared using Fishers protected least significant difference test (LSD) at “P<0.05”. Calculation of heritability for both individual and combined sites was done using PROC mixed method of SAS 9 (BLUPS). Due to the zero heritability observed from the Mtwapa site, the site was dropped from combined analysis. A selection index based on leaf damage score, number of stem borer exit holes and cumulative tunnel length was computed by summing up the ratios between values and the overall mean and dividing by the number of damage parameters evaluated. Germplasm with selection indices values less than 0.8 were regarded as highly resistant, 0.8 to 1.0 as moderately resistant, 1.0 to 1.2 as moderately susceptible and above 1.2 as highly susceptible as described in Tefera et al. (2011).
DNA extraction and analysis
Leaf samples from 15 representative three week old seedlings for each of the 203 F2:3 families were collected in November 2010. DNA was extracted from the lyophilized leaf tissue from 15 F2:3 plants of each family in August 2011. DNA extraction was done using the 96-well format high throughput protocol (Mace et al., 2003).
DNA quantity and quality check
After DNA isolation, quality and quantity checks were done using agarose gel electrophoresis and Nanodrop™ (ND-1000) quantification, respectively. The DNA was subjected to electro-phoresis using 0.8% agarose gel containing 0.3 µg/mL GelRed (Biotium Inc., USA) at 100V for 45 min in 1× TAE running buffer after which the integrity and intensity of the bands were used to indicate quality and quantity of the DNA. Samples with smeared bands were re-extracted and subjected to electrophoresis once more to confirm integrity. After DNA electrophoresis, the samples were quantified using Nanodrop™ spectrophotometer. Absorbance ratios A260/A280 ranging from 1.7 to 2.0 was considered pure with no protein contamination, while A260/A230 ratios above 1.5 were considered to be free of salt contaminants. The isolated DNA was normalized to 50 ng/µL using 0.1X TE (10 mM Tris-HCl, pH 7.5 and 0.1 mM EDTA, pH 8.0), and 50 µL of the normalized DNA was shipped to KBiosciences (present LGC genomics) for genotyping. KASPar SNP Genotyping System (allele-specific PCR amplification of target sequences and endpoint fluorescence genotyping) was used for the SNP analyses, and the generated data were used in subsequent analysis.
Single nucleotide polymorphisms (SNPs) marker analysis
One thousand two hundred and thirty (1230) SNPs were initially screened for polymorphism between the parental lines, the F1s and F2s. Two hundred and seventy nine (279) out of 1230 SNPs (22.7%) were heterozygote in one or both parents, that is, nine (9) were heterozygote in parent CML442, 265 (21.5%) were heterozygous in the multiple borer resistant parent, and five (5) were heterozygote in both parents. One hundred and ninety-two (192) SNPs were homozygous and polymorphic, and 98.5% of these (184) were true to type for F1 and F2. Out of the 184 SNPs, 152 polymorphic SNPs (Appendix 1) were used to genotype the F2:3 plants of the 203 individuals, because the chi-square (χ2) test of fit revealed several markers that had high significance deviations from the 1:2:1 ratio expected for an F2:3 populations (“P<0.001”), such markers were, therefore, excluded from the linkage map which reduced the markers to 152 SNPs. The linkage map was constructed with the 152 SNP markers using JoinMap 4 software package (Van Ooijen, 2006). Information on the SNPs used is available on maize panzea database website (http://www.panzea.org/database). Segregation at each marker locus was analyzed using chi-square (χ2) goodness of fit test for the expected Mendelian segregation ratio of an F2 population. The linkage map was developed using Kosambi’s mapping function. A log10 of the likelihood odds ratio (LOD) value of 6.0 was used to construct linkage maps. QTL detection (mapping) was performed using MapQTL 6 (Van Ooijen, 2009). Interval mapping and multiple QTL mapping (similar to composite interval mapping) were used for QTL detection. Automatic cofactors selection function was used to set cofactors for multiple QTL mapping (MQM), a process that allowed markers used as cofactors to absorb the effects of nearby QTL and increases power and precision of QTL analyses. For declaration of linkage, a threshold LOD score of 3.0 and a maximum recombination frequency of 0.50 were used. Series of 1000 permutations were performed to determine experiment wise significance levels at “P < 0.05” of LOD 3.0 for both insect species. Interval mapping with LOD score of above 2.5 were assumed to be highly indicative of QTL. Gene action for each QTL was calculated using the dominance ratio using absolute additive and dominance values as described in Stuber et al. (1987). Values of 0 to 0.20 were interpreted for additive gene action, 0.21 to 0.80 as partial dominance, 0.81 to 1.20 as dominance and >1.20 as over dominance. The source of resistant allele was detected by the +/- of the additive value with reference to the resistant parent CKSBL10026 where negative values showed alleles came from the resistant parent CKSBL10026, and positive additive values showed resistance came from the sensitive parent CML442 as described in Jampatong et al. (2002).
Phenotypic data
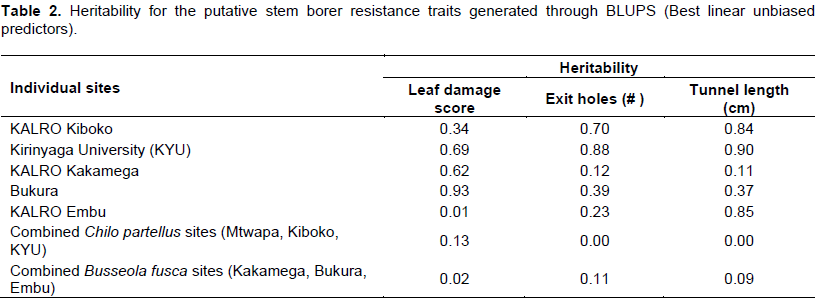
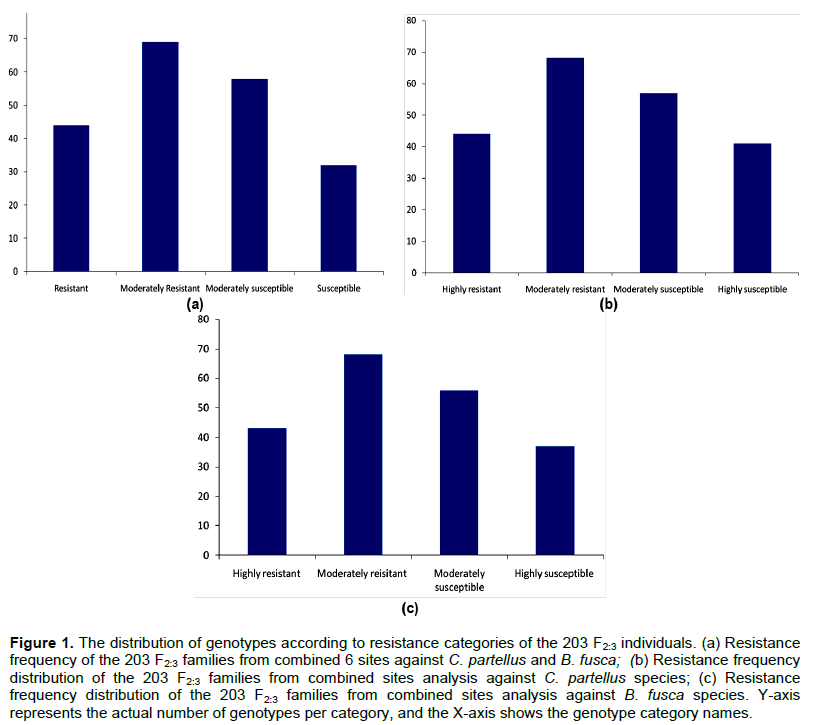
In the C. partellus infested sites (Kirinyaga University, Mtwapa and Kiboko), only progeny evaluated at Kiboko showed significant differences for number of exit holes and tunnel length. In B. fusca infested sites, only progeny evaluated at Bukura showed significant difference for leaf damage. Heritability for resistance traits based on combined sites analysis was low for both stem borer species but high when estimated for evaluations at individual sites except at Mtwapa (Table 2). The selection index computed for all sites and both borer species identified 44 individuals that were highly resistant, 69 moderately resistant, 58 moderately susceptible and 32 highly susceptible with normal distribution frequency (Figure 1). The selection index based on individual stem borer species such as categorized B. fusca species as 43 progeny as highly resistant, 68 as moderately resistant, 56 as moderately susceptible and 37 as highly susceptible. In the C. partellus infested sites, 44 progeny were highly resistant, 68 moderately resistant, 57 moderately susceptible and 41 highly susceptible. Forty-four of the progenies were, therefore, highly resistant to both stem borer species across all locations.
Mapping of the quantitative trait loci
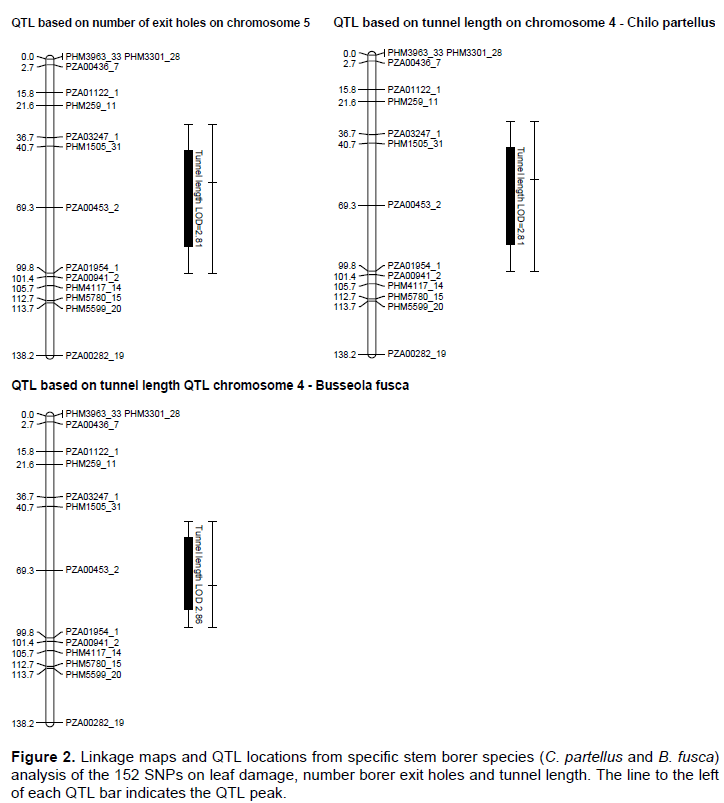
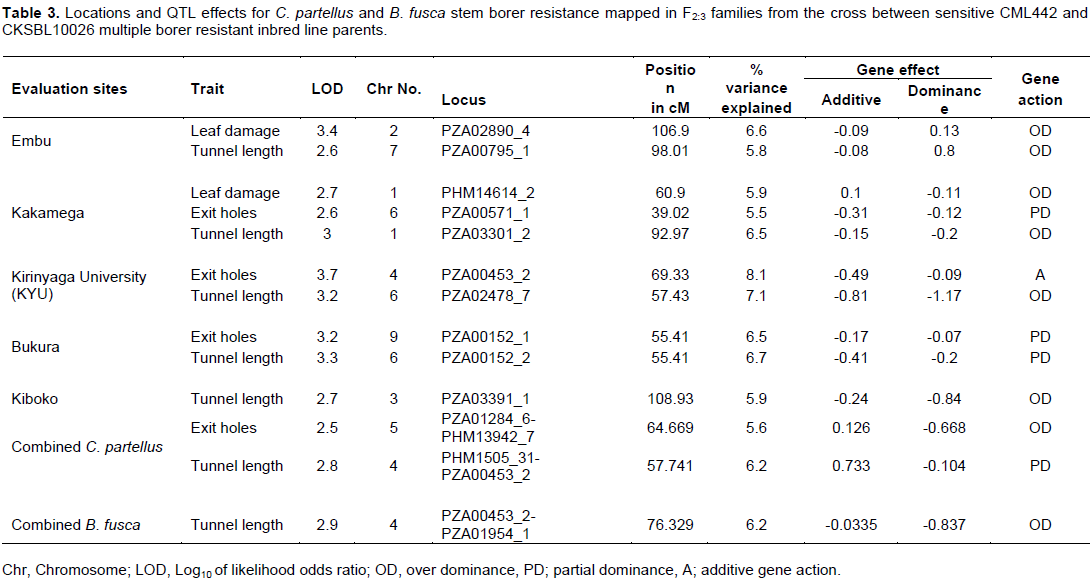
The genetic map was constructed with 152 SNP markers that spanned 1248.01 cM on 10 chromosomes of maize with an average interval length of 8.21 cM. Several QTL for resistance were detected on chromosomes 1, 2, 3, 4, 5, 6, 7 and 9 based on individual sites and different species (Figure 2). Quantitative trait loci detection varied among sites and further, more QTL were detected for B. fusca than for the C. partellus. In B. fusca combined sites analysis, one QTL for resistance to stem tunnelling was detected on chromosome 4 (LOD 2.86) at position 76.33 cM and accounted for 6.2% of phenotypic variation. In the C. partellus combined sites, two QTL for stem tunnelling on chromosome 4 (LOD 2.81) and number of stem exit holes on chromosome 5 (LOD 2.53) were detected and accounted for 6.2 and 5.6% of the phenotypic variation, respectively (Table 3).

QTL for resistance to leaf damage
Two (2) QTL affecting leaf damage feeding score were detected on chromosome 2 for Embu site (LOD 3.37) and one indicative QTL on chromosome 1 for Kakamega site (LOD 2.68). The most significant was the QTL detected on the Embu site which explained 6.6% of the phenotypic variation. Gene action was due to over dominance for both QTL.
QTL for resistance to stem tunnelling
Combined sites analysis for both stem borer species revealed stem tunnelling QTL on chromosome 4 (LOD 2.81 for C. partellus sites and LOD 2.86 for B. fusca sites). Five QTL for reduced tunnelling were detected on different chromosomes on the individual sites for the two stem borer species. The strongest QTL for C. partellus stem tunnelling resistance was detected at Kirinyaga University site on chromosome 6 (LOD 3.24), while that for B. fusca stem tunnelling resistance was similarly detected for Bukura site on chromosome 6 (LOD 3.33), they explained 7.1 and 6.7% of the phenotypic variation, respectively. Suggestive QTL for resistance to stem tunnelling to B. fusca were detected at both Kakamega (LOD 2.99) and Embu (LOD 2.61) sites. A similar indicative QTL for resistance to stem tunnelling against C. partellus was detected at Kiboko (LOD 2.67). Stem tunnelling QTL was conditioned by over dominance gene action except for the Bukura QTL which was due to partial dominance.
Phenotypic data
The extremely low heritability in the combined sites analysis found in this study was a probable indicator of significant genotype by environmental interactions. In a recent similar study, Jiménez-Galindo et al. (2017) reported that resistance traits are associated with high experimental error because they are affected by the plant genotype,
the pest pressure and the environment and, therefore, are difficult to measure. All these factors lead to insect resistance traits showing low to moderate heritability values. The phenotypic data did not reveal distinct differences in resistance levels in the different sites except at Kiboko and Bukura sites. The high heterozygosity revealed in the parents after screening for polymorphism could have compounded the phenotypic differentiation between resistance and susceptible progenies in the field. This phenomenon may have caused the low levels of trait significance for resistance traits in both individual and combined sites. High and significant differences were, however, recorded for the Kiboko site in stem borer tunnel length and exit holes number, and leaf damage at Bukura site. The selection index computed from the three resistance traits leaf damage, number of borer exit holes and cumulative tunnel length in the combined analysis revealed several individuals that were resistant to C. partellus or B. fusca, or/and both. Forty four (44) individuals were resistant to both borer species in all sites, a clear confirmation that the resistant parent carried genes for multi-borer resistance. These results agree with the findings of Mwololo et al. (2015) and Odinga et al. (2016) who reported multiple resistances in some tropical maize germplasm against both C. partellus and B. fusca maize stem borer species. The phenotypic means distribution for resistance traits exhibited a normal distribution curve for specific species sites, and combined sites analyses (Figure 1). This was in agreement with Jampatong et al. (2002) who reported similar phenotypic means distribution for European corn borer resistance mapping study. There was a high correlation between the number of stem borer exit holes and stem tunnelling in the combined sites analysis which was a strong indication of the two parameters reliability and consistence as putative measures of resistance. These findings suggest that these parameters were neither dependent on the environments nor the stem borer species.
Quantitative trait loci for resistance to stem borers
Combined mapping of QTL based on data across sites for both species mapped resistance loci to chromosome 4 for stem tunnelling at position 57.74 cM (LOD 2.81) for C. partellus and at position 76.33 cM (LOD 2.86). One QTL for number of exit holes (LOD 2.53) was detected on chromosome 5 for C. partellus at position 64.67 cM. The close proximity of these stem tunnelling QTL within 18 cM on chromosome 4 for the both stem borer species suggested that there could be a gene with significant effects on reduced stem tunnelling between positions 57.74 and 76.33 cM. In other studies of a related lepidopteran pest (the European corn borer), QTL for resistance traits occurred in clusters (Papst et al., 2005). It is thus possible that in the case of resistance to stem borer in tropical maize, similar genome setup may occur as found in this study. Quantitative trait loci for resistance to stem borers mapped based on data from individual sites were mostly inconsistent, with only two sites (Kirinyaga University and Bukura) having consistently revealed QTL on chromosome 6. These inconsistencies in QTL detection may have been due to low levels of segregation in the mapping population, or it could underscore the enormous contribution and interaction of the environmental effects on QTL detection. Several QTL may, therefore, have been undetected in this study due to the environmental effects. Similar results have been reported in other studies on the European corn borer due to environmental effects (Jampatong et al., 2002; Krakowsky et al., 2004). The phenotypic variances associated with the QTL reported in this study were fairly low (mostly slightly below 10%). This study was in agreement with other QTL mapping studies in maize that reported low phenotypic variances on both the European corn borer, and storage insect pests (Jampatong et al., 2002; Garcia-Lara et al., 2009; Samayoa et al., 2015b; Jiménez-Galindo et al., 2017). Small phenotypic variation values may suggest that the QTL have only small effects, or have larger effects but were only more loosely linked to the marker locus (Edwards et al., 1987; Bohn et al., 2000).
The detected QTL in this study were conditioned by over dominance, partial dominance and additive gene actions. In 12 of the 13 QTL detected, resistance was conditioned by over-dominance and partial dominance. Partial dominance was found on three (3) QTLs for number of exit holes and stem tunnelling whilst additive gene action accounted for 1 QTL for the number of exit holes. In maize, resistance to the European corn borer is conditioned in a similar manner, albeit with additive gene action accounting for the majority of the QTL than dominance and over dominance gene actions (Guthrie and Russell, 1989; Bohn et al., 2000; Krakowsky et al., 2004; Jampatong et al., 2002). Scott et al. (1966) showed that resistance to the European corn borer, a lepidopteran pest just like C. partellus and B. fusca was conditioned by a relatively large number of genes with small effects on chromosomes 1, 2, 4, 6 and 8. The caution is that some QTL may not have been detected and, or, were dissimilar to those reported for related stem borers species due to the low heritability of the putative traits, and differences in trait characterization (Khairallah et al., 1998; Jiménez-Galindo et al., 2017). In a similar study, Samayoa et al. (2015b) attributed such discrepancies to QTL by environment interaction effects and stressed the importance of making phenotypic evaluations in environments similar to those for which breeding materials are intended to be used.
Overall these results show the presence of QTL for maize stem borer resistance in the tropical maize population studied and thus could provide an opportunity to pyramid them into elite material as has been done for the European corn borer (Jampatong et al., 2002). Majority of the LOD scores were below 3.0 (at “P<0.05”), and that was most likely due to the low heritability of the trait under study, and phenotype differences under the different environments. The probability of detecting strong QTL with small sample sizes should be comparatively low unless the QTL explains a substantial proportion of the genetic variance. Melchinger et al. (1998) also reported that with a large number of minor QTLs influencing a quantitative trait such as insect resistance, the power of QTL detection and number of common QTLs should be smaller than for a trait governed by a small number of major QTL. The low heritability for stem borer resistance which was indicative of their polygenic nature should not be considered an impediment to maize improvement breeding activities in the tropics or elsewhere (Stuber et al., 1987; Bohn et al., 2000; Garcia-Lara et al., 2009).
Quantitative trait loci for the three putative resistance traits were detected in the tropical maize population studied. Relative to other maize stem borer QTL mapping studies, fewer QTL were detected in this study. Among the three traits, QTL for stem tunnelling were the strongest and were the most detected in both individual and combined specific borer species environments. The variances explained by QTL-marker associations were, however, low, indicative of many QTL with small variances that could have escaped detection. Individual sites analysis revealed stronger QTL and it was noted that more QTL were detected against B. fusca than C. partellus. The low reproducibility of QTL across environments for both stem borer species underscores the need for finer mapping and need for larger populations in succeeding mapping activities in the tropics.
The authors declare that there are no conflicts of interests.
REFERENCES
|
Arends D, Prins P, Jansen RC, Broman KW, Barrett J (Ed.) (2010). R/qtl: high-throughput multiple QTL mapping. Bioinformatics 26:2990-2992.
Crossref
|
|
|
|
Bedell JA, Budiman MA, Nunberg A, Citek RW, Robbins, D (2005). Sorghum genome sequencing by methylation filtration. PLoS Biol. 3(1):e13.
Crossref
|
|
|
|
|
Bohn M, Schulz B, Kreps R, Klein D, Melchinger AE (2000). QTL mapping for resistance against the European corn borer (Ostrinia nubilalis H.) in early maturing European dent germplasm. Theor. Appl. Genet. 101:907-917.
Crossref
|
|
|
|
|
Calatayud PA, Le Ru BP, van den Berg J, Schulthess F (2014). Ecology of the African Maize Stalk Borer, Busseola fusca (Lepidoptera: Noctuidae) with Special Reference to Insect-Plant Interactions. Insects 5:539-563.
Crossref
|
|
|
|
|
Campagne P, Kruger M, Pasquet R, Le Ru B, Van den Berg J (2013). Dominant Inheritance of Field-Evolved Resistance to Bt Corn in Busseola fusca. PLoS ONE 8(7):e69675.
Crossref
|
|
|
|
|
De Groote H (2002). Maize yield losses from stem borers in Kenya. Insect Sci. Appl. 22:89-96.
|
|
|
|
|
Drinic SM, Micic DI, Eric I, Andelkovic V, Jelova D, Konstantinov K (2004). Biotechnology in breeding. Genetika 36:93-109.
Crossref
|
|
|
|
|
Edwards MD, Stuber CW, Wendel JF (1987). Molecular-Marker-Facilitated Investigations of Quantitative-Trait Loci in Maize. I. Numbers, Genomic Distribution and Types of Gene Action. Genetics 116:113-125.
|
|
|
|
|
Garcia-Lara S, Khairallah MM, Vargas M, Bergvinson DJ (2009). Mapping of QTL Associated with Maize Weevil Resistance in Tropical Maize. Crop Sci. 49:139-149.
Crossref
|
|
|
|
|
Guthrie WD, Russell WA (1989). Breeding methodologies and genetic basis of resistance in maize to the European corn borer. In. CIMMYT, ed. Towards Insect Resistant Maize for the Third World. Proceedings of the International Symposium on Methodologies for Developing Host Plant Resistance to Maize Insects. Mexico, D.F. pp. 192-202.
|
|
|
|
|
Jampatong C, McMullen MD, Barry BD, Darrah LL, Byrne PF, Kross H (2002). Quantitative Trait Loci for First- and Second-Generation European corn borer Resistance Derived from the Maize Inbred Mo47. Crop Sci. 42:584-593.
Crossref
|
|
|
|
|
Jiménez-Galindo JC, Ordás B, Butrón A, Samayoa FL, Malvar RA (2017). QTL Mapping for Yield and Resistance against Mediterranean Corn Borer in Maize. Front. Plant Sci. 8:698.
Crossref
|
|
|
|
|
Kfir R, Overholt WA, Khan ZR, Polaszek A (2002). Biology and management of economically important lepidopteran cereal stem borers in Africa. Annu. Rev. Entomol. 47:701-731.
Crossref
|
|
|
|
|
Khairallah MM, Bohn M, Jiang C, Deutsch JA, Jewell DC, Mihm JA, Melchinger AE, Gonzalez-de-leon, D, Hoisington DA (1998). Molecular mapping of QTL for south-western corn borer resistance, plant height and flowering in tropical maize. Plant Breed. 117:309-318.
Crossref
|
|
|
|
|
Krakowsky M, Lee M, Woodman-Clikeman WL, Long MJ, Sharopova N (2004). QTL Mapping of Resistance to Stalk Tunnelling by the European Corn Borer in RILs of Maize Population B73 × De81. Crop Sci. 44:274-282.
|
|
|
|
|
Mace ES, Buhariwalla HK, Crouch JH (2003). A high-throughput DNA extraction protocol for tropical molecular breeding programs. Plant Mol. Biol. Rep. 21:459-460.
Crossref
|
|
|
|
|
Mailafiya DM, Le Ru BP, Kairu EW, Stéphane D, Paul-André C (2011). Parasitism of lepidopterous stem borers in cultivated and natural habitats. J. Insect Sci. 11:15-25.
Crossref
|
|
|
|
|
Melchinger H, Friedrich U, Chris CS (1998). Quantitative Trait Locus (QTL) Mapping Using Different Testers and Independent Population Samples in Maize Reveals Low Power of QTL Detection and Large Bias in Estimates of QTL Effects. Genetics 149:383-403.
|
|
|
|
|
Mihm JA (ed.) (1997). Insect Resistant Maize: Recent Advances and Utilization; Proceedings of an International Symposium held at the International Maize and Wheat Improvement Center (CIMMYT) 27 November-3 December, 1994. Mexico, D.F.: CIMMYT.
|
|
|
|
|
Mugo S, Songa J, DeGroote H, Hoisington D (2002). Insect Resistant Maize for Africa (IRMA) Project: An overview. CIMMYT, Washington DC.
|
|
|
|
|
Mugo S, Tefera T, Beyene Y (2012). Stem Borer Pest Resistant Maize: An Update from Africa. Presented to the SI 4 Stress tolerant maize for the poorest (Tues 17th Jan., 2012, Session M1 – Group 1) During the Global Launch of the MAIZE and WHEAT CGIAR Research Programs, Mexico City, 16-20 Jan 2012.
|
|
|
|
|
Muturi PW, Rubaihayo P, Mgonja M, Kyamanywa S, Sharma HC, Hash CT (2012). Novel source of sorghum tolerance to the African stem borer, Busseola fusca. Afr. J. Plant Sci. 6:295-302.
|
|
|
|
|
Mwololo JK, Munyiri SW, Semagn K, Mugo S, Okori P (2015). Genetic Diversity Analysis in Tropical Maize Germplasm for Stem Borer and Storage Pest Resistance using Molecular Markers and Phenotypic traits. Mol. Plant Breed. 6:1-22.
|
|
|
|
|
Odinga R, Karua JC, Awori TG, Nicholas CK (2016). Assessment of the response of tropical maize inbred lines in resistance to B. fusca and C. partellus in Eastern Africa. Int. J. Plant Breed. Genet. 3:189-199.
|
|
|
|
|
Ong'amo GO, Le Ru BP, Dupas S, Moyal P, Calatayud PA, Silvain JF (2006). Distribution, pest status and agro-climatic preferences of lepidopteran stem borers of maize in Kenya. Ann. Soc. Entomol. Fr. 42:171-177.
Crossref
|
|
|
|
|
Papst C, Bohn M, Utz HF, Melchinger AE, Klein D, Eder J (2005). Evaluation of resistance factors against European corn borer (Ostrinia nubilalis HBn.) in central European dent material. Proceedings of the 54th Annual Meeting of the growers and the seed merchants Austria: Hybrid maize breeding and utilization, 25-27 November 2003, Gumpenstein Irdning, Austria.
|
|
|
|
|
Robyn S (2008). Prospects for using marker-assisted breeding to improve maize production in Africa. J. Sci. Food Agric. 88:745-755.
Crossref
|
|
|
|
|
Samayoa LF, Malvar RA, McMullen MD, Butrón A (2015b). Identification of QTL for resistance to Mediterranean corn borer in a maize tropical line to improve temperate germplasm. BMC Plant Biol. 15:265.
Crossref
|
|
|
|
|
Samayoa LF, Malvar RA, Olukolu BA, Holland JB, Butrón A (2015a). Genome-wide association study reveals a set of genes associated with resistance to the Mediterranean corn borer (Sesamia nonagrioides L.) in a maize diversity panel. BMC Plant Biol. 15:35.
Crossref
|
|
|
|
|
SAS (2007). Proceedings of the Twenty-Eighth Annual SAS®Users Group International Conference. SAS Institute Inc., Cary, NC, USA.
|
|
|
|
|
Scott GE, Dicke FF, Pesho GR (1966). Location of genes conditioning resistance in corn to leaf feeding of the European corn borer. Crop Sci. 6:444-446.
Crossref
|
|
|
|
|
Smale M, Byerlee D, Jayne T (2011). Maize revolutions in sub-Saharan Africa. Policy Research Working Paper 5659. World Bank Development Research Group: Agriculture and Rural Development Team.
Crossref
|
|
|
|
|
Stuber CW, Edwards MD, Wendel JF (1987). Molecular Marker-Facilitated Investigations of Quantitative Trait Loci in Maize. II. Factors Influencing Yield and Its Component Traits. Crop Sci. 27:639-648.
|
|
|
|
|
Tefera T, Mugo S, Tende R, Likhayo P (2011). Methods of Screening Maize for Resistance to Stem Borers and Post-harvest Insect Pests. International Maize and Wheat Improvement Centre (CIMMYT). Nairobi. Kenya.
|
|
|
|
|
Toure A, Haussmann BIG, Jonesc N, Thomasd H, Oughame H (2000). Application of molecular markers in plant breeding, B. I. G. Haussmann, et al., (eds.) Training manual for a seminar held at IITA, Ibadan, Nigeria from 16-17 August 1999. International Crops Research Institute for the Semi-Arid Tropics (ICRISAT), Patancheru 502 324, Andhra Pradesh, India.
|
|
|
|
|
Van Eeuwijk FA, Bink MC, Chenu K, Chapman SC (2010). Detection and use of QTL for complex traits in multiple environments. Curr. Opin. Plant Biol. 13:193-205
Crossref
|
|
|
|
|
Van Ooijen JW (2006). JoinMap ® 4, Software for the calculation of genetic linkage maps in experimental populations. Kyazma B.V., Wageningen, Netherlands.
|
|
|
|
|
Van Ooijen JW (2009). MapQTL ® 6 Software for mapping quantitative trait loci in experimental populations of diploid species. Kyazama B.V., Wageningen, Netherlands.
|
|
|
|
|
Yan J, Warburton M, Crouch J (2011). Association Mapping for Enhancing Maize (Zea mays L.) Genetic Improvement. Crop Sci. 51:433-444.
Crossref
|
|