Full Length Research Paper

ABSTRACT
Dacryodes edulis is a multipurpose tree integrated in the cropping system of Central African region still dominated by subsistence agriculture. Some populations grown are wild which can provide information on the domestication process, and could also represent a potential source of gene flow. Leaves samples for DNA extraction were collected from wild forms in Mbakwa supe region and from cultivated forms in Yaounde and Santchou region. Six microsatellites DNA markers were employed in genotyping to analyze population structure and gene flow. Amplification rate was high and genotyping revealed high level of genetic variation. The overall polymorphic level at the six loci was also high with average expected heterozygosity of 0.53; polymorphism of 0.46; mean allelic diversity of 0.5 and mean allele number of 8.33. There were no clear differences with only 1% variation among the three populations and 6% variation among individuals within populations. In contrast, the rate of heterozygosis was high in all the three populations. Both the number of migrant per generation (Nm=20) and the Wright’s F-statistics (FST=0.012) suggest that there was substantial gene flow among the populations. These findings indicate that D. edulis possess a great potential of pollen dispersal and dominant cross-pollination within populations. Most of the loci with private alleles (45%) were found in wild individuals which could be a source of pollen for crossing their cultivated relatives.
Key words: Dacryodes edulis, domestication, genetic diversity and structure.
Abbreviation: EDTA, Ethylenediaminetetraacetic acid; PVP, polyvinylpyrrolidone; DNA, deoxyribonucleic acid; PCR, polymerase chain reaction; He, expected heterozygoty; PIC, polymorphism index content.INTRODUCTION
The knowledge of trees diversity is very important for the planning of conservation programs. Genetic diversity is fundamental for the evolution of species and it made the plants to be adapted to environment changes since thousand years. Fire, forest destruction and factors like exploitation, affect continuously agro forestry genetic resources (Achard et al., 2002). Most of them are still under-utilised, meanwhile sustainability use of genetic diversity of agroforest contributes to the achievement of the new challenges and the promotion of economic, social and cultural values as well as services and environmental incomes (FAO, 2010). Unfortunately, advances in the fields of genomics and molecular genetics of agroforestry’s species are not remarkable although biochemical and DNA markers are developed for an increasing number of tropical species (Baird et al., 1996; Mhameed et al., 1997; Ude et al., 2006). These tools increases knowledge on forests tree and allows for better plan of the domestication process.
The characterisation of many groups of agroforestry plants is now well established. Among them, is Dacryodes edulis (Don.), a multipurpose tree known for its potential dietary uses and economic properties with a great potential of industrial applications. The plant is a source of edible oils and nutritious fruits (Vivien and Faure, 1996; Ajibesin, 2011). It has been classified as priority species for domestication by the International Centre for Research in Agroforestry (ICRAF) (Tchoundjeu et al., 2002). In central Africa, cultivated forms are integrated into the cropping systems in a region still dominated by subsistence agriculture and is the centre of diversity for the species (Mbeuyo et al., 2013). The ecological and cultural conditions under which traditional agriculture is carried out have helped to preserve large amounts of their diversity (Kengue, 2002). The cultivated forms consist of heterogeneous genetic material, resulting from empirical selections in different ecological regions (Youmbi et al., 2010). Actually, the selection pressure especially among Cameroonian populations, for the choice of plant material by farmers is high and may leads to the erosion of the genetic base of the species. Some populations grown are wild but the species has evolved very little over time (Okafor, 1983; Kengue, 2002). The species is essentially allogamous; pollination is entomophilous and achieved by insects (Fohouo et al. 2002). The pollen can be spread over a long distance (Kengue, 1990). The wild genetic materials could have many important influences on their cultivated relatives, and store great amounts of genetic variation which may be of interest for future crop improvement programs (Kengue, 2002). In addition, they can provide information on the domestication process, and could also represent a potential source of gene flow with their domesticated materials. Thus there is need to enhance genetic richness of this important crop. This will help in identification, germplasm collection, improvement and conservation. The aim of this study was to assess genetic diversity, population structure and gene flow of D. edulis.
MATERIALS AND METHODS
Study area and sample collection
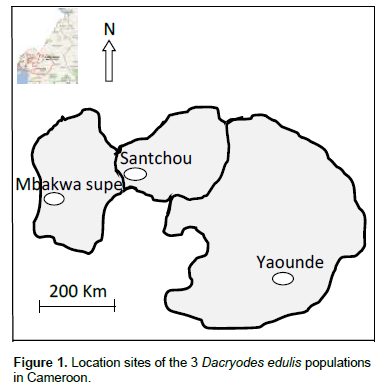
The plant material was collected in three localities: Yaounde (Latitude 11° 31 ′ 12 ″ N, Longitude 3° 52 ′ 12 ″ E ) in the central region of Cameroon, approximately 813 m a.s.l; Santchou (Latitude 4° 37’ N, Longitude 9° 50’ E, rainfall 1500 mm, altitude 320 m) in the western region of Cameroon and Mbakwa Supe (Latitude 5° 1’ 59” N, Longitude 9° 25’ 0” E, altitude 425 m) in the south west region of Cameroon (Figure 1). The choice of localities was based on preliminaries survey to know the origin and estimated age of cultivated material and be sure that cultivated populations were not established from the natural stand sampled. Santchou and Yaounde are one of the most important regions respectively for production and commercialization of D. edulis. In these localities, populations of D. edulis are integrated into cropping systems in gardens among food crops, in cocoa based agroforests and in fallow (Mbeuyo et al., 2013).
Three populations consisting of wild forms at Mbakwa supe and cultivated forms at Yaounde and Sancthou were assessed. 25 samples’ leaves were collected in duplicate per population for a total of 75 samples. The plant material was dried in silica gel and kept for short time in container until DNA extraction.
DNA extraction and microsatellite loci
The total genomic DNA was extracted from dried leaves with a modified Saghai-Maroof et al. (1984) protocol. Approximately 0.4 g of tissue was macerated in 15 mL tubes in a tabletop vortexer. Tissue was then incubated at 65°C in extraction buffer (2% CTAB; 100 mM Tris-HCl pH 7.5; 700 mM NaCl; 50 mM EDTA pH 8.0; 2% PVP and 140 mM β-mercaptoethanol just prior to use). Approximately 50 ng of genomic DNA was used in PCR reactions under standard conditions.
Six microsatellites loci (CB09, CC01, CE09, CG11, LB12 and LD06) previously developed by Benoit et al. (2011) were employed. The allele size ranged from 125 to 375 and the repeats motifs concerned were guanine-adenine (GA) and cytonine-thymine (CT). PCR was carried out in two thermocyclers (Ependort and Corbet) in 0.2 mL individual tube and 96 well plates. It started with an initial step of 95°C for 5 min, followed by 35 cycles of 30 s at 95°C, 1 min at 57°C and 30 s at 72°C. Final elongation was carried out at 72°C for 20 min. The products were separated by electrophoresis in 1.8% agarose gels with a running time of 40 min at 100 V in 0.5X TBE buffer. A 50 bp DNA ladder (Invitrogen) was used as molecular size marker. Gels were stained with Gelred and the DNA bands were visualized under ultraviolet light; digital images were recorded using the software Image Aide, version 3.06.04.r®.
Genotyping by capillary gels
For each genotyping sample, 1 µL of PCR product was diluted with 9 µL mixture of 1 mL deionized Formamide and 15 µL ROX-labeled y internal sizing standard with a total reaction volume of 10 µL. The fragments of the DNA were denatured (3 min at 95°C with thermocycler and immediately cooled in ice bath) and size fractioned using capillary electrophoresis on an ABI 3730 automatic DNA sequencer. The GeneMapper software Version 4.1 was applied to size peak patterns, using the internal GS500LIZ 3730 size standard and for allele calling.
Statistical analysis
For each loci site, the number of alleles, expected heterozygot (He), polymorphism index content (PIC) and imbreeding coefficient were calculated using Popgen32 software (Yeh et al., 2000). The genotype frequency within samples was tested for agreement with Hardy-Wemberg expectation by Chi square test to compare observed versus expected outcomes.
Wright’s F-statistics (1965) were calculated by analysis of molecular variance (AMOVA) to evaluate the level of population structure. Values and were estimated through variance among populations; variance among and within individuals.
The rate of inter-population gene flow among all populations was estimate using the procedure based on Wright’s , where (Wright,1965). This method estimated which is the average number of migrants into a population per generation. The calculation of genotype frequency, Wright’s F-statistics and the rate of inter-population gene flow were done by GenAlEx_6.4 (Peakall and Smouse, 2006).
RESULTS
Microsatellite variability and heterozygosity
Level of genetic variation and related parameters at each locus for the three populations are summarized in Table 1. Of the six loci sites used, a total of 50 alleles ranging from 5 to 14 with an average of 8.33 were detected in the populations. Apart from LB12, each locus was revealed to be polymorphic. The expected He ranged from 0.11 to 0.92, with an average of 0.53. High rate of polymorphism was confirmed with calculation of PIC ranging from 0.15 to 0.78, with an average of 0.46.

Population variability and heterozygosity
Allele’s frequency for each population is given in Table 2. In terms of individual, Mbakwa supe population was the least polymorphic with an average of 4.83 alleles per locus (Table 2) and unbiased expected heterozygosity (He) of 0.49 (Table 3). The population of Yaounde and Santchou were the most polymorphic respectively with an average of 5.67 and 5.50 alleles per locus and unbiased expected heterozygosity of 0.53 and 0.51.


For 3 populations at 6 loci, 10 out of 18 cases had a single dominant allele with frequency exceeding 0.5 (Table 2): 1 population (Yaounde) at CB09 and the 3 populations (Yaounde, Santchou and Mbakwa supe) at CC01, CG11 and LB12. Otherwise, all the populations had at least 4 alleles at each locus and the frequencies were largely spread out among all alleles. Shanon index confirmed a great level of genetic diversity with the highest values in cultivated forms (Yaounde and Santchou) (Table 3).
Hardy-Weinberg expectation
Genotype frequency was compared at 6 loci with Hardy- Weinberg expectation using Chi square test. Considering 18 combinations of the three populations over 6 loci, significant departures (P < 0.05) were found in 5 cases, all showing deficiencies in heterozygotes (P < 0.05). The distribution of the 5 cases was clustered by 5 loci and all belong to the cultivated populations. Two of these deficiencies were found in Santchou population for CC01 and LB12 loci while 3 of each were found in Yaounde populations for CB09, CE09 and CG11 loci.
Genetic population differentiation and gene flow
Wright’s F-statistics expressed by FIS FST and FIT were used to assess population structure by analysis of molecular variance. The probability (FIS) that two alleles in an individual are identical by descent (relative to the subpopulation from which they are drawn) was equal to 0.058 and showed that there was a high average heterozygotes in each D. edulis population. The probability (FIT) that two alleles in an individual are identical by descent (relative to the combined population) was equal to 0.069 and showed that there was a high average heterozygotes in a 3 groups of populations. The last probability (FST) for which two alleles drawn at random are identical by descent (relative to the combined populations) was equal to 0.012 and showed that the degree of gene differentiation among populations in terms of allele frequencies was low. Otherwise, there were no clear differences with only 1% variation among the three populations, 6% variation among individuals within populations and 93% within individual of the populations. The level of gene flow was estimated by the number of migrant. Both the number of migrant/generation and the values suggest that there was substantial gene flow among the populations.
Private alleles were assessed within individuals of the 3 populations. Private alleles in the context of this study are alleles unique to a single population; all the other alleles totaled were shared between them. These alleles were found in 17 individuals of the three populations (8 for Mbakwa supe, 4 for Santchou and 5 for Yaounde). The total number of loci (9) and loci sites (5) in wild forms with private allele was highest as compared to those of the two cultivated forms which were (10) and (5), respectively.
DISCUSSION
The main areas where microsatellite markers are being applied in forest trees include studies of genetic diversity in natural and breeding populations, particularly in species with low levels of isozyme variation, gene flow, pollen and/or seed dispersal and mating systems. As these parameters are relevant to the conservation of forest genetic resources, microsatellites are being used to monitor genetic impacts of forest management practices and of fragmentation. It is the case of Eucalyptus sieberie (Glaubitz et al., 1999) and Pinus radiate (Echt et al., 1999). In the present study, the number of alleles was high and the loci sites were polymorphic. The calculation of polymorphism index contain suggest that we can get a reliable results of the population genetic estimate using the six SSRs.
There was not structure in the populations. This cannot be understood without considering that there is no genetic drift occurring in some of its subpopulations. In addition, migration might be uniform throughout the population, or mating is random throughout the population. A population’s structure might affect the extent of genetic variation and its patterns of distribution
A high degree of polymorphism was observed within all the groups and particularly in wild forms. In terms of genetic resource, this suggests that wild forms present a significant genetic diversity. In addition, most of the species like D. edulis have a greater genetic diversity among wild population in terms of number of alleles (Saghai-Maroof et al., 1984). Both the number of migrant/generation (Nm=20) and the FST=0.012 values suggest that there was substantial gene flow among the populations. Our very low estimates are lower than the average reported for outcrossing seeds plants (Hamrick, 1989; Vigouroux et al., 2008). These results can be explained by great potential of pollen dispersal and dominant cross-pollination within populations. In addition, in a separate study regarding growing of D. edulis under different cropping conditions in Makenene region of Cameroon, it was found that the majority of D. edulis plants (88%) are planted from seeds derived from adult individuals, while 12% are from conventional breeding techniques (aerial layering). The seeds used are selected from trees bearing large, nonacid fruits that are rich in oils (Mbeuyo et al., 2013). Meanwhile, gene flow between cultivated plants and their wild relatives may have increased likelihood of rapid decrease of wild relatives. In fact, during this surveys, populations in the field reported their decreasing and coexistence with cultivated form in certain regions. However, studies that examine the extent of introgression between wild and cultivated populations are necessary.
There was no significant difference (p < 0.01) between expected and observed genotype frequency in wild’s population. For these reasons, Hardy-Wemberg equilibrium was respected, assuming no unbalanced external factor is affecting wild's population. In contrast, 05 cases of deficiencies in heterozygotes were mentioned in cultivated forms. In the domestication process of D. edulis, farmers grow plants requiring only agronomic and food traits (Kengue, 2002). These cultural practices increased the selection pressure for the choice of planting material by farmers and might progressively lead to the erosion of the genetic base of the species from where deficiencies in heterozygotes is observed in some cultivated individuals.
It is noted from the concluding remarks that there was no difference in the three population’s structure. In contrast, variability and heterozygosis were very high within the populations. There could be substantial gene flow among the populations and the greatest number of private alleles was found in wild’s individuals. For breeding programs, self-pollinations of selected individuals followed by crossing should be useful to produce hybrids of economic and agronomic interest such as size, taste and oil content of fruits. Some wild individuals could be a source of pollen for crossing their cultivated relatives.
CONFLICT OF INTERESTS
The authors have not declared any conflict of interests.
ACKNOWLEDGEMENTS
The authors gratefully acknowledge the financial support provided to the Biosciences Eastern and Central Africa Hub at the International Livestock Research Institute (BecA-ILRI Hub) by the Australian Agency for International Development (AusAID) through a partnership between Australia's Commonwealth Scientific and Industrial Research Organization (CSIRO) and the BecA-ILRI Hub; and by the Syngenta Foundation for Sustainable Agriculture (SFSA); the Bill and Melinda Gates Foundation (BMGF); and the Swedish Ministry of Foreign Affairs through the Swedish International Development Agency (SIDA), which made this work possible.
ABBREVIATIONS
EDTA, Ethylenediaminetetraacetic acid; PVP, polyvinylpyrrolidone; DNA, deoxyribonucleic acid; PCR, polymerase chain reaction; He, expected heterozygoty; PIC, polymorphism index content.
REFERENCES
|
Achard F, Ev HD, Stibig HJ, Mayaux P, Gallego J, Richards T, Malingreau JP (2002). Determination of deforestation rates of the world's humid tropical forests. Science 297:999-1002. |
|
|
Ajibesin KK (2011). Dacryodes edulis G. (Don) H.J. Lam: A review on its medicinal, phytochemical and economical properties. Res. J. Med. Plant 5:32-41. |
|
|
Baird WV, Ballard RE, Rajapakse S, Addott AG (1996). Progress in Prunus mapping and application of molecular to germplasm improvement. HortScience 31:1099-1106. |
|
|
Benoit L, Born C, Vignes H, Chevallier MH, Todou G, Debain C, Joly H (2011). Polymorphic microsatellite loci from Dacryodes edulis (Burseraceae), A Central African rainforest and fruit-tree species. Am. J. Bot. 98(4):e74-e75. |
|
|
Echt CS, Vendramin GG, Nelson CD, Marquardt P (1999). Microsatellite DNA as shared genetic markers among conifer species. Can. J. For. Res. 29:365-371. |
|
|
FAO (2010). Recent status and options for forestry's biotechnologies in developing countries. International technical conference of FAO. Guadalajara (Mexique), 1-4 March 2010. |
|
|
Fohouo FNT, Messi J, Pauly A (2001). The activity of Meliponula erythra on the flowers of Dacryodes edulis and its effect on fructification. Fruits 56:179-188. |
|
|
Glaubitz JC, Strk J, Moran GF (1999). Genetic impacts of different silvicultural practices in native eucalypt forests. In: Cs. Matyas (ed) Forest Genetics and Sustainability. Kluwer, Dordrecht, Netherlands. |
|
|
Hamrick JL (1989) Isoenzymes and the analysis of genetic structure in plant population. In: Isozymes in plant biology (Eds. DE Soltis, PS Soltis), Vol. 5. Dioscorides Press, Porland, Oregon, USA, pp. 87-105. |
|
|
Kengue J (1990). Safou: Dacryodes edulis (G. Don.), first data on morphology and biology. Doctorate thesis, University of Yaounde. 204p. |
|
|
Kengue J (2002). Safou: Dacryodes edulis (G. Don.), In: Hughes A., Haq N., Smith R., (Eds.), International Center for Underutilized Crops, Fruits for the Future, No. 3, Southamton, U.K. 145p. |
|
|
Mbeuyo M, Donfagsiteli TN, Youmbi E, Amougou A (2013). Performance of Dacryodes edulis mycorrhized layers under different cropping conditions in Makenene, Cameroon. Turk. J. Agric. For. 37:335-343. |
|
|
Mhameed S, Sharon D, Kaufman D, Lahav E, Hillel J, Degani C, Lavi U (1997). Genetic relationships within avocado (Persea Americana Mill) cultivars and between Persea species. Theor. Appl. Genet. 94:394-401. |
|
|
Okafor JC (1983). Varietal delimitation in Dacryodes edulis (G. Don) H.J. Lam. (Burseraceae). Int. Tree Crops J. 2:255-265. |
|
|
Peakall R Smouse PE (2006). GENALEX 6: genetic analysis in Excel. Population genetic software for teaching and research. Mol. Ecol. Notes 6:288-295. |
|
|
Saghai-Maroof MA, Soliman K, Jorgensen RA, Allard RW (1984). Ribosomial DNA spacer-length polymorphisms in barley: Mendelian inheritance, chromosomal location, and population dynamic. Proc. Natl. Acad. Sci. USA. 81:8014-8018. |
|
|
Tchoundjeu Z, Tonye J, Anegbeh P (2002). Domestication of key indigenous non-timber forest products: their economic and environmental potentials in degraded zone of West and Central Africa. In: Proceedings of the International Conference on Enhancement of Safou and Other Non-Conventional Oilseeds (Eds. J Kengue, C Kapseu, GJ Kayem), Vol. 3. Yaounde, Cameroon. pp. 51-59. |
|
|
Ude GN, Dimkpa CO, Anegbeh PO, Shaibu AA, Tenkouano A, Pillay M, Tchoundjeu Z (2006). Analysis of genetic diversity in accessions of Irvingia gabonensis (Aubry-Lecomte ex O'Rorke) Baill. Afr. J. Biotechnol. 5(3):219-223. |
|
|
Vigouroux Y, Glaubitz JC, Matsuoka Y, Goodman MM, Sanchez JG, Doebley J (2008). Population structure and genetic diversity of new world maize races assessed by DNA microsatellites. Am. J. Bot. 95:1240-1253. |
|
|
Vivien J, Faure J (1996) Wild fruits of Africa: species of Cameroon. Editions Nguilou-Kerou. Paris, France: CTA. 416p. |
|
|
Wright S (1965). The interpretation of populations structure by F-statistics with special regard to systems mating. Evolution 19:395-420. |
|
|
Yeh FC, Yang RC, Boyle TBJ, Ye ZH Mao JX (2000). POPGENE 32, Microsoft Window based software for population genetic analysis (version 1.32). Endmonton, AB: Molecular Biology and Biotechnology Centre, University of Alberta. |
|
|
Youmbi E, Mbeuyo M, Donfagsiteli TN Amougou A (2010). Physico-chemical characterisation and classification trial of fruits of Dacryodes edulis from the major agro-ecological zones of Cameroon. Fruits 65:355-365. |
|
Copyright © 2024 Author(s) retain the copyright of this article.
This article is published under the terms of the Creative Commons Attribution License 4.0


