African Journal of
Biotechnology

  • Abbreviation: Afr. J. Biotechnol.
  • Language: English
  • ISSN: 1684-5315
  • DOI: 10.5897/AJB
  • Start Year: 2002
  • Published Articles: 12488

Full Length Research Paper

Adaptation of sweet potato [Ipomoea batatas) (L.) Lam] genotypes in various agro-ecological zones of Malawi

Felistus Chipungu
  • Felistus Chipungu
  • Bvumbwe Agricultural Research Station, PO Box 5748, Limbe, Malawi.
  • Google Scholar
Wisdom Changadeya
  • Wisdom Changadeya
  • Molecular Biology and Ecology Research Unit (MBERU) DNA Laboratory, Department of Biological Sciences, Chancellor College, University of Malawi, P.O. Box 280, Zomba, Malawi.
  • Google Scholar
Aggrey Ambali
  • Aggrey Ambali
  • NEPAD African Biosciences Initiative, Policy Alignment and Programme Development Directorate, NEPAD Agency, c/o CSIR Building 10F, Meiring Naude Road, Brummeria, Pretoria, Republic of South Africa.
  • Google Scholar
John Saka
  • John Saka
  • University of Malawi, University Office, P.O. Box 278, Zomba, Malawi.
  • Google Scholar
Nzola Mahungu
  • Nzola Mahungu
  • The International Institute of Tropical Agriculture (IITA), Central Africa Hub, 4163, Avenue Haut-Congo, Commune de la Gombe, Kinshasa, Democratic Republic of Congo.
  • Google Scholar
Jonathan Mkumbira
  • Jonathan Mkumbira
  • Tea Research Foundation of Central Africa, P.O. Box 51, Mulanje, Malawi.
  • Google Scholar


  •  Received: 01 December 2017
  •  Accepted: 05 March 2018
  •  Published: 18 April 2018

 ABSTRACT

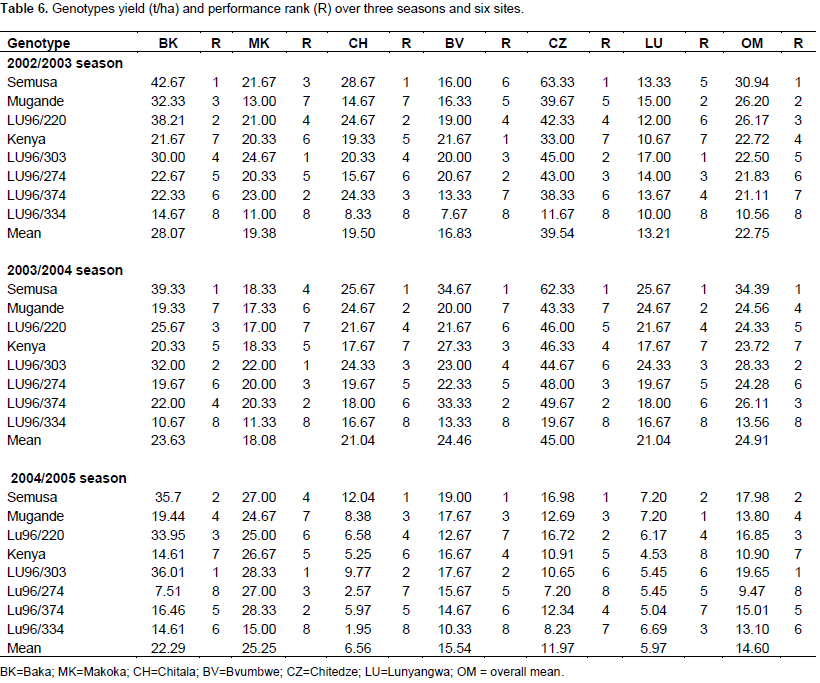
Sweet potato [Ipomoea batatas) (L.) Lam] is grown by small holder farmers across a wide range of environments in Malawi. A multi-location trial of eight genotypes for three seasons at six research stations was undertaken using additive main effects and multiplicative interaction (AMMI) model analysis to determine the genotypes’ stability and influence of genotype × environment interactions (GEI) on storage root yield.  ANOVA showed high significant differences in storage root yield of the genotypes among seasons and locations (p≤0.01). Genotype, environment and genotype × environmental interaction significantly influenced storage root yield variation of the cultivars (p≤0.01). The variance in yield was mainly attributable to environment variability (62.86%) than genotypes variation (14.25%) and G × E interactions (15.06%). Semusa was superior for storage root yield (27.77t/ha) and Lu96/334 was the most inferior (11.19 t/ha). AMMI stability analysis revealed that LU96/303 (24.72 t/ha) was the most stable genotype across sites. Biplot analysis showed that Chitedze and Baka were sites conducive for high yields hence can be used for preliminary yield evaluation to capture maximum genotypes’ yield potential, while Lunyangwa was the lowest yields site; therefore useful for assessing the potential of worst performance of genotypes under unfavourable environmental conditions.

Key words: G × E interactions, multi-locational trial, stability, sweet potato, genotypes, root yield.


 INTRODUCTION

A better understanding of genotypes and environment interactions (GEI) is critical for any crop varieties improvement program (Singh et al., 2006; Osiru et al., 2009; Andrade et al., 2016) as it helps breeders to identify superior genotypes and their best environments (Yan and Rajcan, 2002; Thiyagu et al., 2013). GEI refers to differential sensitivity of genotype performance from one environment to another (Chalwe et al., 2017). While modern plant breeders work to improve various attributes of crops ranging from pest and disease resistance to biofortification, yield improvement has remained the main drive for most breeding programs (Yahaya et al., 2015). Yield is a complex quantitative trait that is determined by an interaction of various factors including external environment such as soil fertility, rainfall, pests and diseases (Dia et al., 2016). Sweet potato [Ipomoea batatas) (L.) Lam], like other crops suffers yield losses that are due to abiotic and biotics limitations (Tekalign, 2007; Kivuva et al., 2014; Chalwe et al., 2017) hence an understanding of the nature and magnitude of GEI among sweet potato genotypes is essential in both sweet potato breeding and variety release (Singh et al., 2006; Rukundo et al., 2013). From time in memorial, genotypic yield levels have been the focus of many sweet potato farmers but adaptation to environments and stability (consistency of yield) of the genotypes have always been the underpinning determinants of final yields (Eberhart and Russell, 1966; Bilbro and Ray, 1976; Rea and Vieira, 2002). Thus, a variety is considered more adaptive and stable if it has a high mean yield but a low degree of yield fluctuation in diverse environments (Kang, 2002; Osiru et al., 2009; Khamphas et al., 2015). Sweet potato [I. batatas) (L.) Lam] is grown under varying agro-ecological conditions in the tropical and subtropical regions (Thiyagu et al., 2013; Boney et al., 2014) and it is postulated that because of its high genetic diversity and expansive distribution, it exhibit large variability in genotypic expression in multi-environmental trials across regions (Grünerberg et al., 2005). Therefore, this study used the additive main effect and multiplicative interaction (AMMI) model to assess elite sweet potato genotypes in Malawi to determine their stability and influence of genotype × environment interactions (GEI) on storage root yield in order to identify superior cultivars.


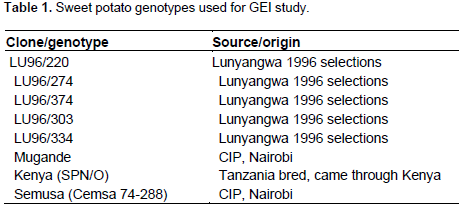
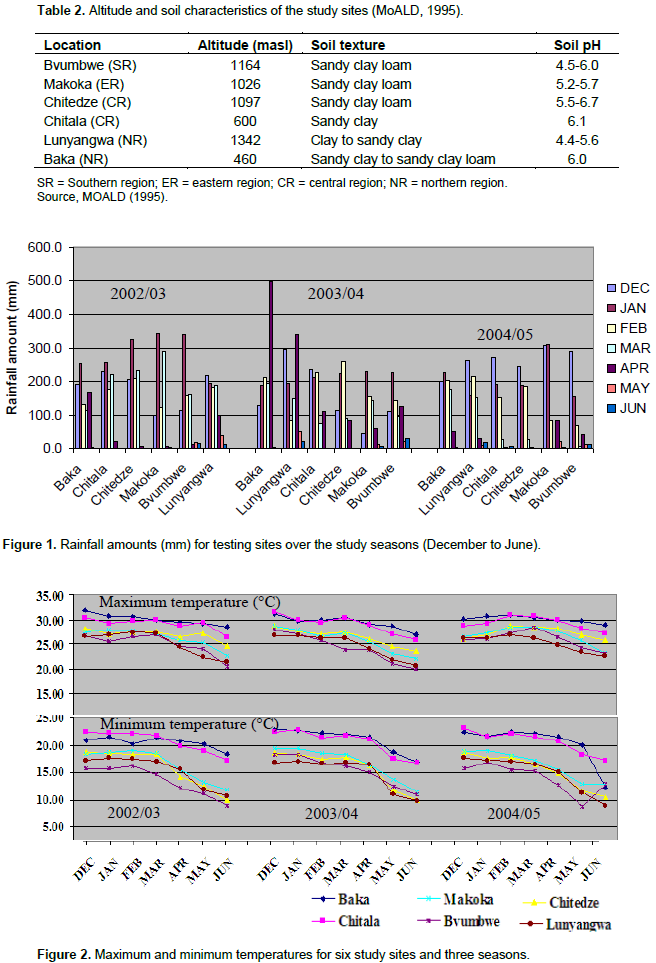
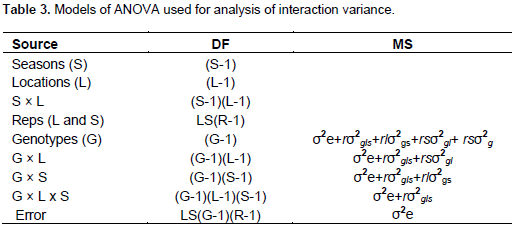
 MATERIALS AND METHODS

Table 1 presents eight genotypes of sweet potato used in this study. Materials included selections from open pollinated seeds in a crossing block that was established at Lunyangwa Research Station in 1995. Scarified (using sulphuric acid in 99 parts of water) true seeds were initially planted in a seedling nursery in 1996 where clonal selections were made, hence the coding of LU96. LU96 clones were combined with introductions from the International Potato Centre (CIP) and evaluated together in preliminary, advanced and uniform (multi-location) yield trials. Inferior clones in terms of pests and diseases, root yield, root shape, dry matter content, palatability, fiber content, etc. were dropped while the rest were maintained over the seasons. In the final entry, six genotypes were evaluated against Kenya (low yield check genotype) and Semusa (high yield check genotype) (Table 1) at six sites.


Evaluation sites and seasons
 
 
The multi-location trial was conducted during the 2002/2003, 2003/2004 and 2004/2005 seasons at Bvumbwe, Makoka, Chitedze, Chitala, Lunyangwa and Baka government agricultural research stations (Table 2). The testing sites represent sweet potato agro-ecological zones in Malawi. The sites differ by altitudes, soil texture, pH and climatic characteristics (rainfall and temperatures) as presented in Table 2 and Figures 1 and 2.

 
Trial design and field lay out
 
The clones were laid out in three replicates using a randomized complete block design (RCBD) at the six locations. The plots were planted and maintained following standard procedures with no fertilizer and herbicide application.
 
Collection of data
 
Harvesting was done five months after planting (5MAP) at all sites and data on final stand count, representing final surviving plants in a net plot was recorded. Using a weighing scale, storage root yield (kg) per plot was determined with only marketable roots considered for analysis.
 
Data analyses
 
Analysis of variance
 
The effects of the genotype, location and season as well as their first and second order interactions were determined using analysis of variance (ANOVA) in Agrobase (1999) Agronomic Software 71. The effects of genotypes were assumed to be fixed, while those of seasons and location effects were considered to be random. Table 3 shows the models of the ANOVA used in the study. The ANOVA for estimating variance components is based on the model proposed by Allard (1960), and further developed by Comstock and Moll (1963) for the determination of interaction variance components. In the model, S, L, G and R are the number of seasons, locations, genotypes and replications, respectively. The σ2e and σ2g are components of variance of error and genotypes, respectively. Combinations of the subscript identify the components for the interactions.


AMMI stability analysis of root yield
 
 
Similarities among test environments based on environmental main and GEI effects were evaluated using additive main effect and multiplicative interaction (AMMI; Zobel et al., 1988) analyses (Agrobase, 1999). The method uses a combination of ANOVA and principal components analysis (PCA). While ANOVA partitioned the variance into three components: genotype, environment and G× E deviations from the grand mean, the PCA partitioned the G × E deviations into different interaction principal component axes (IPCA). These were tested for statistical significance using ANOVA.


 RESULTS AND DISCUSSION

Genotypic variability for root yield
 
The analysis of variance (ANOVA) indicated high significant differences in storage root yield (t/ha) among genotypes at p≤0.01 within and among locations and seasons (Table 4). The variability in yield by different genotypes indicated their differing responses to diverse environments and seasons (Mulema et al., 2008). The difference in performance among the genotypes in a given environment is in part due to genetic variability which accounted for 14.25% of the total sum of squares (Table 4). The mean storage root yields of the genotypes (Table 5) ranged from 11.19 (LU96/334) to 28.33 t/ha (Semusa). The coefficient of variance (CV) was 19.19% which was reasonable and reflective of the study results reliability under field and rain fed conditions. The r2 value = 0.94 represented a high (94%) repeatability (reproducing similar yields) of the trial. The relative yields of the eight genotypes (Table 5) showed that Semusa, the highest yielding reference was the most superior (27.77 t/ha) in two of the three seasons and six locations. The rest of the genotypes had different ranks in different seasons.


The selection criterion for early maturing and high yielding cultivars in Malawi is based on mean root yields of 20 t/ha at 5 months after planting (Chipungu et al.,1999). Such a selection criterion however, is a factor in stability in yield as illustrated by the yields of cultivars in 2005 which were below 20 t/ha. Breeders have always considered both yield levels and stability of performance, in order to present farmers with genotypes that are suitable (Farshadfar, 2008; Fikere et al., 2009). Considering the least significant difference (LSD), the root yield means were over 20 t/ha and above the lower yielding check, Kenya, except for Lu96/274 and LU96/334 (Table 5). Therefore, five of the six tested genotypes are good candidates for release in the national program assuming their performance is equally good in other traits such as tolerance/resistance to pests and diseases, palatability (dry matter content, colour, taste, texture, fiber content, etc.), root sizes and numbers.
 
Presence and magnitude of GEI on root yield
 
ANOVA (Table 4) showed significant effects of genotypes, locations, seasons and their interactions (P≤0.01) on root yield. Similar results were shown by Mwololo et al. (2009) in their study on 17 genotypes, three sites and two seasons in Kenya. Khamphas et al. (2015) also found that location, genotypes and G × L interaction were significant for all characters of purple waxy maize genotypes. This underscores the importance of stability studies before recommendation of any crop genotypes for various locations.  In the present study, location which is a predictable environment had a variability of 27.60% (Table 4) of the total variation of yield and could be attributed to differences in soil type and pH and altitude (Table 2). The variability among seasons which is the unpredictable environment (13.46% contribution to total SS) may be attributed to seasonal rainfall and temperatures variations (Figures 1 and 2). When GEI is due to variation in predictable environmental factors, sweet potato breeders can either develop specific varieties for different environments (locations, soil types, management systems, etc.), or broadly adapted varieties that perform well under variable conditions (Farshadfar, 2008; Fikere et al., 2009). However, when GEI stems from variations in unpredictable environmental factors, such as year to year variation in rainfall distribution, as is the case in this study, stable varieties that can perform reasonably well under a range of conditions are needed. Such breeding strategies assist the farmers in risk avoidance. Fikere et al. (2008) indicated that farmers favor genotypes that yield constantly better across seasons and environments. In general, the environment accounted for 62.86% (27.60 + 13.46 + 21.80%) of the total variation in storage root yield. This finding is indicative of a high influence of the environment on root yield, further supporting the need for evaluation of candidate genotypes over multiple sites and seasons for accurate inference (Sial et al., 2001).  Table 6 shows that the best yield was from Semusa in2002/2003 and 2003/2004 seasons (30.94 and 34.39 t/ha, respectively) while LU96/303 had the highest yield (19.65 t/ha) in the 2004/2005 season. The most productive season was 2003/2004 (24.91 t/ha), while 2004/2005 (14.60 t/ha) was the worst season (Table 6). The seasonal difference was attributed to uneven distribution of rainfall amounts in 2004/2005 season (Figure 1). The season had recurrent dry spells between January and March. The seasons 2002/2003 and 2003/2004 were similar in terms of rainfall (Figure 1) amounts and distribution. However, all the three seasons were similar in terms of minimum and maximum temperatures (Figure 2). LU96/303 on average was second in yield after Semusa (Table 5) but highest in the drought season (19.65 t/ha) (2004/2005) attaining the Malawian selection criterion (20 t/ha) (Chipungu et al., 1999). This implies that LU96/303 is an ideal cultivar because it combines both drought tolerance and high yield (Makunde et al., 2017). Drought is known to affect root yield negatively (Andrade et al., 2016).


The best site in terms of yield performance was Chitedze in 2002/2003 (39.54 t/ha) and 2003/2004 (45.00 t/ha) while in 2004/2005, Makoka was first (25.25 t/ha). Cultivar Semusa ranked first in five sites in 2003/2004, four sites in 2004/2005 and three sites in 2002/2003. LU96/303 was rated first in each season at Makoka, while LU96/334 was classified as last in each location in 2002/2003 and 2003/2004 seasons and in three sites in 2004/2005 season. The rest of the clones varied from positions 2 to 8 across sites over the seasons (Table 6), yet good cultivars must show high performance for yield and other essential agronomic traits over a wide range of environments (Becker and Leon, 1988).
 
Root yield additive main effect and multiplicative interaction (AMMI) for the genotypes across environments
 
The AMMI analysis of variance of root yield (kg/ha) of eight genotypes in 18 environments showed that genotype main effects, environmental main effects and their interactions were all highly significant for root yield (p≤0.01). This finding concurs with those of Chalwe et al. (2017) whose study on sweet potato genotypes in Zambia showed significant AMMI analysis variance of genotype, environment and their interactions on root yield and weevil damage. Gedif and Yigzaw (2014) and Daba et al. (2015) observed similar significant environment, genotype and genotype × environment interactions influence on yield of potato (S. tuberosum L.) and sesame, respectively, in Ethiopia (p≤0.01).  A total of 62.86% of the total sum of square (SS) was attributable to environmental effects, 14.25% to genotypic effects, and 15.06% to GEI effects (Table 7). This means that G × E interaction effects did not impact more on the resultant root yield than the variation in environments, suggesting that the environments (test sites) were highly diverse, hence causing most of the variation in root yield. Mitrović et al. (2012) also reported large portion (77.83%) of the total variation in maize yield as ascribed to the environment, while genotype and genotype × environment accounted for 30% of the total variation. Contrary results which showed greater G × E effects than environmental or genotypic effects were obtained by Andrade et al. (2016) in their study on 58 sweet potato genotypes evaluated over three seasons at one research station. These findings could be due to use of a single site for testing genotypes. In the present study, the total percentage attributed to environment and G × E interaction accounted for 77.92% of the disparity in storage root yield. Comparable results were found by Mwololo et al. (2009) in sweet potato (70%) and Ntawuruhunga et al. (2001) in cassava (50 to 90%).


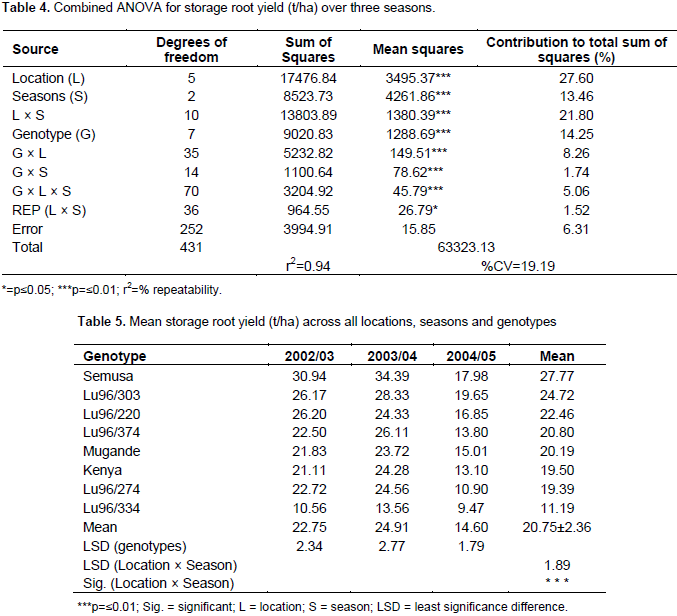
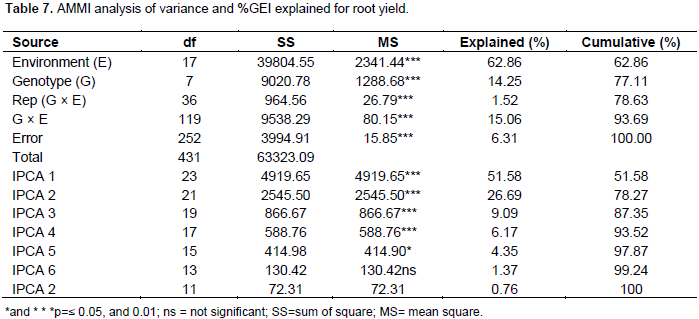
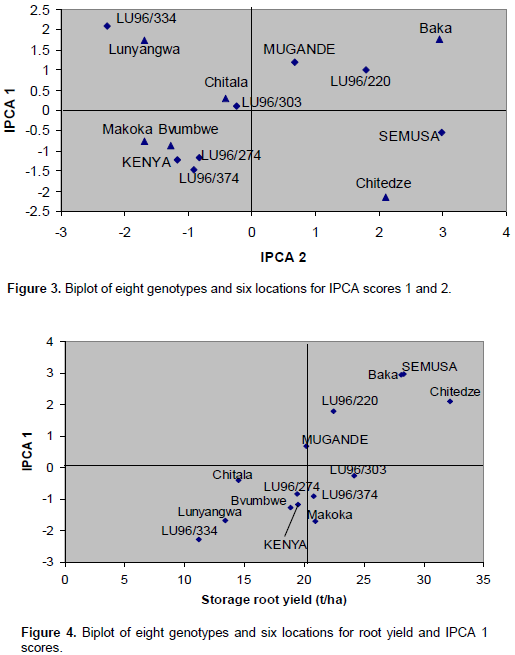
The magnitude of the GEI (15.06%) sum of squares was above that of genotypes (14.25%), indicating that there were differences in genotypic response across environments (Table 7). Results of the AMMI analysis (Table 7) also showed that the first principal component axis (PCA 1) captured 51.58% of the interaction sum of squares. Similarly, the second principal component axis (PCA 2) explained a further 26.69% of the GEI sum of squares. The mean squares for the PCA 1 and PCA 2 were significant at P≤0.01 and cumulatively contributed to 78.27% of the total GEI. A F-test at P≤0.01 suggested that the two principal component axes of interaction were significant for the model with 44 degrees of freedom. Zobel et al. (1988) and Kaya et al. (2002) showed in their prediction assessment that AMMI with only two IPCA axes was the best model. Further interaction principal component axes capture mostly noise and therefore did not help to predict the interactions (Daba et al., 2015). Thus, the interaction of the eight genotypes with 18 environments in this study was best predicted by the first two principal components and the rest were less informative. Thiyagu et al. (2013) reported in their stability study that sweet potato accumulated contribution of IPCA1 and IPCA2 of 85.26%. Comparably, in studies on linseed yield by Adugna and Labuschagne (2002), the two IPCAs accounted for 69.5% of the total interaction and the remaining 30.5% was considered residual or noise not interpretable and was therefore discarded.  In order to identify genotypes adapted to specific test environments and their yield performance and stability, biplots were used (Yan, 2002). The biplot (Figure 3) was generated using genotypic and environmental scores of the first two PCA components as suggested by Vargas and Crossa (2000). Genotypes and location environments that appear almost on horizontal line (y axis) have a similar negative or positive interaction pattern for the IPCA 2 and equally those that fall along the x axis or close to it have similar interaction pattern along IPCA 1. Therefore, genotype LU96/334 is best for Lunyangwa while Kenya, LU96/274 and LU96/374 are best for Bvumbwe and Makoka and LU96/303 for Chitala. LU96/303 is located near the plot origins of both IPCA1 and 2 and therefore less responsive than the vertex genotypes, hence more stable across the testing environments since its IPCA scores are closer to zero (Figure 3) (Mwololo et al., 2009; Osiru et al., 2009; Thiyagu et al., 2013). Such a stable performance is a desirable attribute of cultivars, particularly in Malawi where environmental variations especially the rainfall pattern are very high and unpredictable as shown in Figure 2. Semusa was unstable (Figure 4) across the six sites when variation was explained by IPCA 1 but stabilised (Figure 3) when IPCA 2 was included. In contrast, LU96/334 is a non-adaptable genotype as indicated by its large IPCA 1 and IPCA 2 scores. Mugande and LU96/220 (high yielding) are moderately stable and are not closely associated with any site (Figure 3). Other genotypes of interest are LU96/274 and LU96/374 which are stable when explained by IPCA 2. Makoka and Bvumbwe are similar environments and Kenya, LU96/274 and LU96/374 exhibit similarity in interaction patterns (Figure 3).


Figure 4 is a biplot of average yield of a genotype at different sites and PCA 1 effects. Genotype Semusa had the highest average yield because it yielded the highest at sites Chitedze and Baka, and yielded above average at all other sites. On the other hand, the average yield of genotype LU96/334 was the least while the yield of Mugande was average. LU96/220, LU96/303 and LU96/374 yielded above average. Piepho (1996) indicated that if cultivars are selected for varying environments, stability and mean yield across all environments are more important than yield for specific environments. This is even more important in view of climate change hence farmers would prefer widely adapted cultivars (Zhang et al., 2006; Fikere et al., 2009; Khamphas et al., 2015).  In this study therefore, LU96/303 is considered the most stable genotype (Figures 3 and 4) suitable for the variable production conditions under small holder farmers in the country. It is not uncommon for stability studies to recommend one or two genotypes from a test of many genotypes. Chalwe et al. (2017) and Makunde et al. (2017) both identified two out of eight and 48 genotypes respectively as most stable for root yield and weevil damage and root yield and drought tolerance, respectively. In a study done on winter wheat genotypes in Turkey, two were also reported as stable for all environments by Altay (2012).  Erratic rains in 2004/2005 season, which resulted in low root yields across sites for most of the genotypes, exemplified the variability of cropping seasons in Malawi. Makunde et al. (2017) showed that drought (water stress) reduced sweet potato storage root yield by as much as 35%. This observation indicates that though sweet potato generally grows in marginal areas characterized by poor soils and low rainfall, differential genotypic responses are registered in varying environmental conditions (Chalwe eta l., 2017). Chitedze and Baka were conducive for high yields (above average) and Makoka though close to Bvumbwe hence similar environments, Makoka yields were however above average (Figure 4), hence a better site of the two. Osiru et al. (2009) reported that high and positive PCA scores show that genotypes are likely to yield more in that environment and conversely high and negative PCA scores are indicative of lower yields in these environments. By implication, Figure 4 confirms that Semusa would yield highly at Baka and Chitedze and yields of Lu96/334 would be lower at Lunyangwa. These findings show that knowledge on GEI of a crop in a country helps plant breeders reduce cost of extensive genotype evaluation by eliminating redundant testing sites (Shafii et al., 1992; Kang and Magari, 1996). The ultimate goal of any breeding program is to produce genotypes that consistently yield more in different environments (Khamphas et al., 2015).


 CONCLUSION

Sweet potato [I. batatas) (L.) Lam] cultivars in the study varied significantly in yield across locations and seasons as shown by combined analysis of variance (p<0.01). The variance in yield was mainly attributable to environment variability (62.86%) than genotypes variation (14.25%) and G × E interactions (15.06%). Stability analysis (AMMI) revealed that LU96/303 (24.16 t/ha) was the most stable, while ANOVA identified Semusa as the highest yielding cultivar (28.33 t/ha). While Lunyangwa was a low yielding site, Chitedze was the highest; therefore Chitedze should be used to screen cultivars for maximum yield potential. In times of limited resources, Baka and Bvumbwe sites are not necessary for yield evaluation as they are similar to Chitedze and Makoka, respectively.


 CONFLICT OF INTERESTS

The authors declare that there is no conflict of interest.


 ACKNOWLEDGEMENTS

The authors acknowledge the International Program in the Chemical Sciences (IPICS) under International Science Program (ISP); the International Institute of Tropical Agriculture (IITA)/Southern Africa Root Crops Research Network (SARRNET); the Malawi Government, Ministry of Agriculture and Food Security and the International Potato Centre (CIP) for their technical and financial of the project. Finally, they appreciate technical and material support rendered to the project by staff and officers in-charge of Bvumbwe, Makoka, Chitedze, Chitala, Lunyangwa and Baka agricultural research stations. 


 REFERENCES

Adugna W, Labuschagne MT (2002). Genotype-environment and phenotypic stability analysis of linseed in Ethiopia. Plant Breed. 121:66-71.
Crossref


Agrobase TM (1999). Agronomic Software. 71 Waterloo St Winnipeg, R3N0S4, Canada.


Allard RW (1960). Principles of plant breeding. John Wiley and Sons, NY, pp. 88-92.


Altay F (2012). Yield stability of some Turkish winter wheat (Triticum aestivum L.) genotypes in the western transitional zone of Turkey. Turk. J. Field Crops 17:129-134.


Andrade MI, Naico A, Ricardo J, Eyzaguire R, Makunde, GS, Ortiz R, Gruneberg W (2016). Genotype X environment interaction and selection for drought adaptation in Sweet potato (Ipomoea batatas [L] Lam) in Mozambique. Euphytica 209:261-280.
Crossref


Becker HC, Léon J (1988). Stability analysis in plant breeding. Plant Breed. 101:1-23.
Crossref


Bilbro JD, Ray LL (1976). Environmental stability and adaptation of several cotton cultivars. Crop Sci. 16:821-824.
Crossref


Boney W, Yalu A, Ramakrishna A, Deros M (2014). Genotypic Variability Estimates of Agronomic Traits for Selection in A Sweet potato [Ipomoea batatas (L.) Lam.] Poly crosses Population in Papua New Guinea. J. Plant Breed. Genet. 2(3):131-136.


Chalwe A, Chiona M, Sichilima S, Njovu J, Chama C, Ndhlovu D (2017). Genotype stability index for root yield and tolerance to Sweet potato weevil (Cylas puncticolis): A tool for identifying climate smart varieties. Open Agric. 2:166-174.


Chipungu FP, Benesi IRM, Moyo CC, Mkumbira J, Sauti RFN, Soko MM, Sandifolo V (1999). Field evaluation of introduced Sweet potato clones in Malawi. In: food security and crop diversification in SADC Countries: the role of cassava and sweet potato. Proceedings of the scientific workshop of the Southern African Root Crops Research Network (SARRNET). Pamodzi Hotel, Lusaka, Zambia. Akorod MO, Teri JM (Eds.). pp. 151-156.


Comstock RE, Moll RH (1963). Genotype-environment interactions. In: Statistical genetics and plant breeding. National Academy of Sciences-National Research Council Publication 982. Hanson WD, Robinson HF (Ed.). NAS-NRC, Washington, DC. pp. 164-196.


Daba C, Ayana A, Zeleke H, Wkjira A (2015). Genotype x Environment interactions for seed yield in Sesame in western Ethiopia. East Afr. J. Sci. 9(2):85-96.


Dia M, Wehner TC, Hassell R, Price DS, Boyhan GE, Olson S, King S, Davis AR, Tolla GE (2016). Genotype x environment interaction and stability analysis for watermelon fruit yield in the United States. Crop Sci. 56:1645-1661.
Crossref


Eberhart SA, Russel WA (1966). Stability parameters for comparing varieties. Crop Sci. 6:36-40.
Crossref


Farshadfar E (2008). Incorporation of AMMI stability value and grain yield in a single non-parametric index (GSI) in bread wheat. Pak. J. Biol. Sci. 11:1791-1796.
Crossref


Fikere M, Fikiru E, Tadesse T, Legesse T (2009). Parametric stability analysis in field peas (Pisum sativum L.) under South Eastern Ethiopian condition. World J. Agric. Sci. 5:146-151.


Gedif M, Yigzaw D (2014). Genotype by Environment Interaction Analysis for Tuber Yield of Potato (Solanum tuberosum L.) using a GGE Biplot Method in Amhara Region, Ethiopia. Agric. Sci. 5:239-249.
Crossref


Gruneberg WJ, Manrique K, Zhang D, Hermann M (2005). Genotype-by-environment interactions for a diverse set of Sweet potato clones evaluated across varying eco-geographic conditions in Peru. Crop Sci. 45:2160-2171.
Crossref


Kang MS, Magari R (1996). New developments in selecting for phenotypic stability in crop breeding. In: Genotype by environment interaction. Kang MS, Zobel Jr HG (Eds.). CRC Press, Boca Raton, New York. pp. 51-174.


Kang MS (2002). Genotype-environment interaction: progress and prospects. In: Quantitative genetics and plant breeding. Kang MS (Ed.). CABI Pulishing, Wallingford, New York. pp. 221-243.


Kaya YK, Palta E, Taner S (2002). Additive Main Effects and Multiplicative Interactions Analysis of Yield Performances in Bread Wheat Genotypes across Environments. Turk. J. Agric. 26:275-279.


Khamphas S, Lertrat K, Lomthaisong K, Simla S, Suriharn B (2015). Effect of location, genotype and their interactions for anthocyanins and antioxidant activities of purple waxy corn cobs. Turk. J. Field Crops 20(1):15-23.


Kivuva BM, Githiri SM, Yencho GC, Sibiya J (2014). Genotype and environment interaction for storage root yield in Sweet potato under managed drought stress conditions. J. Agric. Sci. 6:41-56.


Makunde GS, Andrade MI, Ricardo J, Alvaro A, Menomussanga J, Gruneberg W (2017). Adaptation to mid- season drought in a Sweet potato (Ipomoea batatas [L] Lam) germplasm collection grown in Mozambique. Open Agric. 2:133-138.


Ministry of Agriculture and Livestock Development (MoALD) (1995). The agricultural and livestock development strategy and action plan. Lilongwe, Malawi.


Mitrović B, Stanisavljevi D, Treski S, Stojaković M, Ivanović M, Bekavac G, Rajković M (2012). Evaluation of Experimental Maize Hybrids Tested in Multi-Location Trials Using AMMI and GGE Biplot Analyses. Turk. J. Field Crops 17:35-40.


Mulema JK, Adipala E, Olanya OM, Wagoire W (2008). Yield stability analysis of late blight resistant potato selections. Exp. Agric. 44:145-155.
Crossref


Mwololo JK, Muturi PW, Mburu MWK, Njeru RW, Kiarie N, Munyua JK, Ateka EM, Muinga RW, Kapinga RE, Lemaga B (2009). Additive main effects and multiplicative interaction analysis of genotype x environmental interaction among Sweet potato genotypes. J. Anim. Plant Sci. 2(3):148-155.


Ntawuruhunga P, Rubaihayo P, Whyte JBA, Dixon AGO, Osiru DSO (2001). Additive main effects and multiplicative interaction analysis for storage root yield of cassava genotypes evaluated in Uganda. Afr. Crop Sci. J. 9:591-958.
Crossref


Osiru MO, Olanya OM, Adipala E, Kapinga R, Lemaga B (2009). Yield stability analysis of Ipomoea batatas L. cultivars in diverse environments. Aust. J. Crop Sci. 3(4):213-220.


Piepho HP (1996). Analysis of genotype by environment interaction and phenotypic stability. In: Genotype by environment interaction. Kang MS, Zobel Jr HG (Eds.). CRC Press, Boca Raton, New York, pp. 151-174.
Crossref


Rea R, De Sousa Vieira O (2002). Genotype by environment interactions in sugar cane yield trials in the Central-Western Region of Venezuela. Interciencia 27 (11):620-624.


Rukundo P, Shimelis H, Laing M, Gahakwa D (2013). Storage root formation, dry matter synthesis, accumulation and genetics in Sweet potato. Aust. J. Crop Sci. 7:2054-2061.


Shafii B, Mahler KA, Price WJ, Auld DL (1992).Genotype-environment interaction effects on winter rapeseed yield and oil content. Crop Sci. 2:922-927.
Crossref


Sial MA, Arain MA, Javed MA, Rajput MA (2001). Genotype-environment interaction for grain yield in bread wheat. Proc. Pak. Acad. Sci. 38:41-46.


Singh D, Guaf J, Okpul T, Wiles G, Hunter D (2006). Taro(Colocasia esculenta) variety release recommendations for Papua New Guinea based on multi-location trials. New Zealand J. Crop Hort. Sci. 34:163-171.
Crossref


Tekalign T (2007). Genotype 9 environment interaction for root yield of elite Sweet potato (Ipomoea batatas (L.) Lam.) genotypes. S. Afr. J. Plants Soil 24:144-146.
Crossref


Thiyagu D, Rafii MY, Mahmud TMM, Latif MA, Malek MA, Sentoor G (2013). Genotype by environment assessment in Sweet potato as leafy vegetable using AMMI model. Pak. J. Bot. 45(3):843-852.


Vargas MV, Crossa J (2000). The AMMI analysis and graphing the biplot. CYMMIT, Mexico. pp. 1-23.


Yahaya SU, Saad AM, Mohammed SG, Afuape SO (2015). Evaluating the performance of improved Sweet potato (Ipomoea batatas L. Lam) advanced lines in Kano, Sudan savanna of Nigeria. Int. J. Agron. Agric. Res. 7(4):52-60.


Yan W, Rajcan I (2002). Biplot evaluation of test sites and trait relations of soybean in Ontario. Crop Sci. 42:11-20.
Crossref


Yan W (2002). Singular-value partitioning in biplot analysis of multi-environment trial data. Agron. J. 94:990-996.
Crossref


Zhang Y, He Z, Zhang A, Van Ginkel M, Ye G (2006). Pattern analysis on grain yield of Chinese and CIMMYT spring wheat cultivars grown in China and CIMMYT. Euphytica 147:409-420.
Crossref


Zobel RW, Wright MJ, Gauch HG (1988). Statistical analysis of yield trial. Agron. J. 80:388-393
Crossref


          */?>