Full Length Research Paper

ABSTRACT
Assessment of genetic diversity among wheat cultivars is important to ensure that a continuous pool of cultivars with varying desirable traits is maintained. In view of this, a molecular study was conducted to assess the genetic diversity of sixty wheat cultivars using sixty microsatellite markers. Amplified alleles from each cultivar were scored after running in 6% poly acrylamide gel electrophoresis (PAGE). A dendrogram was constructed based on the genetic similarity coefficient of un-weighted pair-wise group method with arithmetic average (UPGMA). The results showed that 276 alleles were amplified by 48 polymorphic microsatellite markers averaging 5.7 alleles per locus. A total of 12 markers did not amplify any alleles from the 60 cultivars. Polymorphism of alleles and genetic diversity measured by polymorphic information content (PIC) and Shannon index (SI) respectively, found that genome A had the highest genetic diversity followed by genome B while genome D was the lowest diverse. Cluster analysis resulted in formation of four clusters comprising of 3, 7, 9 and 41 cultivars. Genetic distance between the clusters ranged from 0.56 to 0.87 and most cultivars showed high diversity between genetic distances of 0.65 and 0.75. The four clusters and their similarities will help breeders to breed new disease resistant cultivars and make rational deployment of cultivars in production based on the established relationships.
Key words: Genetic diversity, molecular marker, microsatellite (SSR marker), Triticum aestivum.
INTRODUCTION
Common wheat (Triticum aestivum L.) is among the most important cereals currently grown in most parts of the world. The crop is among the three world’s major cereal export earners with others including maize and rice (Tong et al., 2003; Abdellatif and Abouzeid, 2011). It forms more than 40% of the world’s commonly consumed food and 95% of people in the developing countries eat wheat or maize in form of flour as a main food source (Akhtar et al., 2011; Coventry et al., 2011). The crop provides one fifth of the global required calories (Reynolds et al., 2011; Friedrich et al., 2014). Currently, wheat is grown on approximately 216 million hectares of land worldwide with an estimated production of 605 million tons (Abdellatif and Abouzeid, 2011). China is the largest wheat producer and consumer in the world (FAO, 2014). As at 2013, the crop was produced on approximately 24 million hectares of land yielding 121 million tons nationally, representing 11.2 and 17.6% of the world’s total harvest area and production tonnage, respectively (FAO, 2014; Li et al., 2014). The crop is mostly produced in 30 provinces across China with 1.9 million hectares (8%) covered by spring wheat and 22.3 million hectares (92%) grown with winter wheat. Spring wheat is mainly grown in the northeastern, central northern and northwestern China including parts of Gansu, Xinjiang and Qinghai provinces, while winter wheat is mainly grown in eastern China including parts of Henan, Shandong, Anhui and Hebei provinces among others (Liu et al., 2014).
In order to sustain high levels of wheat production in China, one of the most important requirements is the maintenance of a diverse pool of wheat cultivars where ‘superior’ gene/alleles can be obtained for genetic improvement programs. Intensive activities aimed at improving wheat crop such as selection of cultivars with desirable attributes have led to a reduced genetic diversity over time, increased disease incidences, a decline in crop yield and compromised drought tolerance among many other biotic and abiotic challenges (Roussel et al., 2004; Fu et al., 2005; Mir et al., 2012).
Presently, it is extremely difficult to increase the land area for wheat production in China due to pressure from human population growth, urbanization and competition from other crops (Fu et al., 2001; Lu et al., 2007; Lu and Fan, 2013). By preserving the genetic diversity, growers could achieve a high improvement rate of desired attributes such as pest resistance and high yields in the available wheat cultivars while maintaining land size.
Microsatellite markers also called simple sequence repeats (SSR) or short tandem repeats (STR) (Tautz, 1989; Edwards et al., 1991; Jacob et al., 1991; Kalia et al., 2011) are among the most popular molecular markers used in genetic diversity studies. This type of markers is characterized by its high efficiency, reproducibility, co-dominant nature and high degree of polymorphism (Singh et al., 2007; Royo et al., 2010; Ruiz et al., 2012; Laido et al., 2013; Meti et al., 2013). Microsatellites are vital in cultivar identification and also offer an advantage during pedigree analysis as they are genus specific (Romero et al., 2009; Abdullah et al., 2012). Several studies conducted to identify the genetic diversity of wheat cultivars using SSRs, had shown consistent results with the polymorphism expressed being significantly more reliable than that reported using other types of markers (Corbellini et al., 2002; Ahmed et al., 2010; Khodadadi et al., 2011; Shakeel and Azam, 2012; Spanic et al., 2012).
The aim of the present study was to utilize microsatellite markers in order to assess the genetic diversity of sixty wheat cultivars collected from several parts of main wheat growing regions in China. The outcome of this research could assist breeders to set up the appropriate guidelines for proper management of the wheat cultivars, as a precursor towards the implementation of future programs.
MATERIALS AND METHODS
Selection of cultivars, DNA extraction and PCR protocol
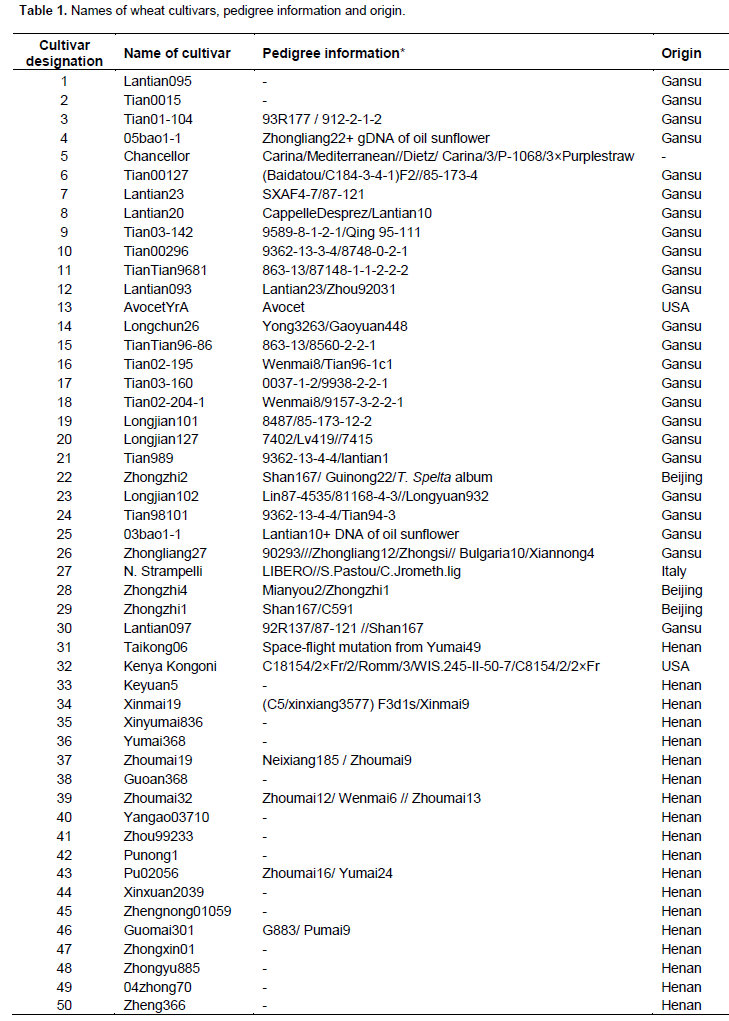
A total of 60 wheat cultivars comprising 57 wheat cultivars collected from parts of main wheat growing regions of China and 3 cultivars collected from USA and Italy were evaluated for genetic diversity. Detailed information of cultivars is shown in Table 1.
Ten seeds of each wheat cultivar were sown on trays in greenhouse located at the Institute of Plant Protection, Chinese Academy of Agricultural Sciences, Beijing, China. About 15 days after sowing, when three to four leaves had been developed, seedling leaves were detached and their DNA was extracted following Zheng (2010) CTAB extraction method.
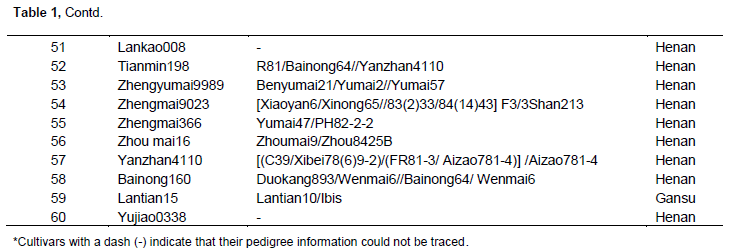
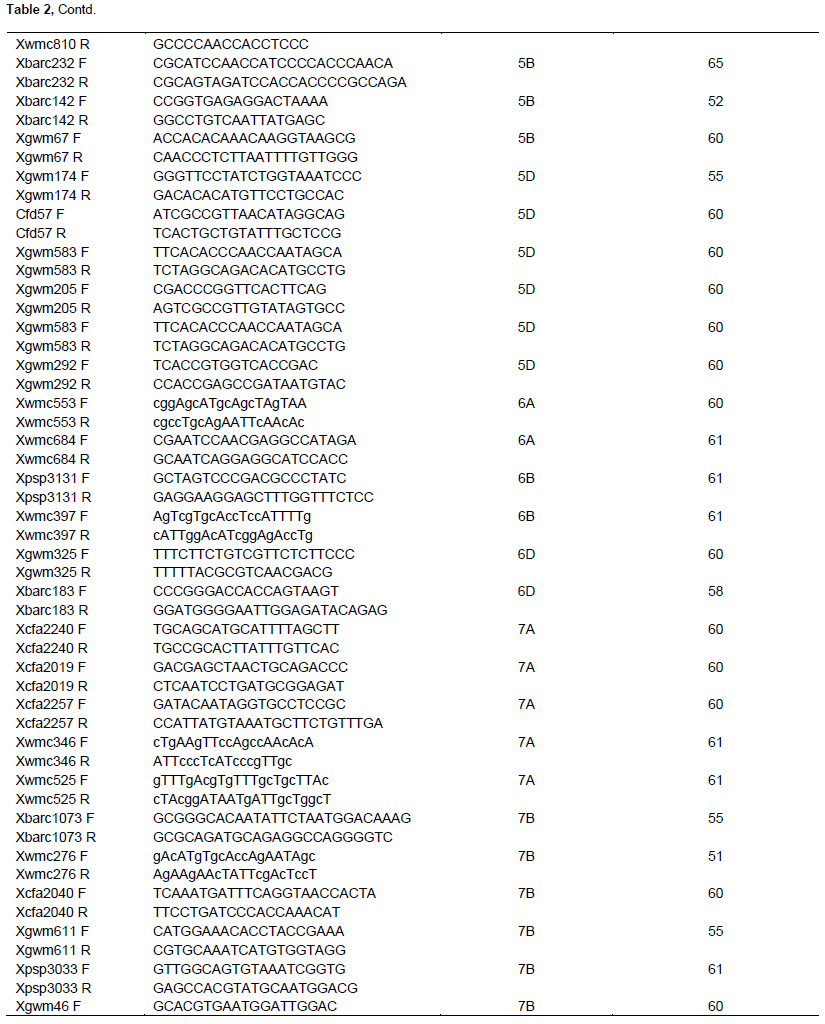
To test DNA purity, all extracted DNA samples were run on 2% Agarose gel of 1% TBE buffer solution and the image was captured using Gel Documentation and Image Analysis System after staining in Ethidium bromide solution for 5 min. For PCR reaction, the DNA was diluted in the range between 50 and 80 ng/µl and the mixture comprised 5 µl PCR master mix, 2 µl double distilled water, 1 µl of 10 mM Forward primer, 1 µl of 10 mM Reverse primer and 1 µl of DNA template, with a final volume of 10 µl. PCR protocol was applied using Bio-Gener Technology, Gene explorer PCR machine with the following conditions: 94°C for 3 min, 35 cycles of 94°C for 1 min, 50 to 60°C (depending on SSR primer annealing temperature) for 30 s, 72°C for 30 s and a final extension of 72°C for 10 min before soaking at 4°C. A total of sixty wheat microsatellite markers were used to estimate the genetic diversity among the sixty cultivars used herein (Table 2). SSR markers that had linkage to designated and temporarily designated wheat powdery mildew resistance genes were selected for the study. This preference was due to the fact that a subsequent study that followed the present one required the utilization of the same cultivars and markers for molecular disease resistance assessment. Marker sequences, chromosomal locations and corresponding annealing temperatures were retrieved from the graingenes website (http://wheat.pw.usda.gov/cgi-bin/graingenes/browse.cgi?class= marker).
Simple sequence repeat protocol
SSR protocol for 6% poly-acrylamide gel electrophoresis (PAGE) was used. The gel glass was stained in 1500 ml of water containing 3 g silver nitrate solution. Thereafter, the alleles were enhanced in 2000 ml of water solution containing 3 ml of 37% formaldehyde (H2CO) and 30 g sodium hydroxide.
Data analysis
All clearly amplified alleles on the cultivars were treated as a single locus. Scoring was based on presence and absence of the alleles. Bivariate 1 and 0 data matrices obtained from the stained gel were used to construct a dendrogram based on the genetic similarity coefficient. Sahn-clustering of un-weighted pair-group method with arithmetic average (UPGMA) were applied using the software NTSYSpc 2.1 (Numerical Taxonomy and Multivariate Analysis System), version 2.1 (Rohlf, 2000). Polymorphism information content (PIC) was calculated using the following formula:

Where, fi = frequency of ith allele for n alleles at a locus (Powell et al., 1996).
PIC measures the informativeness of the DNA markers over a set of genotypes during gene mapping, molecular breeding and germplasm evaluation (Peng and Lapitan, 2005; Varshney et al., 2007; Wang et al., 2007).
A molecular marker with lower PIC indicates less informativeness in expressing the polymorphism of its alleles at a locus while higher PIC value indicates the high ability of the marker to express polymorphism of alleles at a locus. Shannon-weaver index (SI) was calculated as described by Chen and Li (2007). The index estimates species diversity in a community at a particular time. The diversity index, also known as the Shannon-Wiener species diversity index or simply the Shannon index, calculates the number of different species in a community (species richness) and the proportion of individuals from a single species as compared to the number of individuals of other species in the same community. A Shannon-Weaver diversity index of zero indicates that only one species is present in the community; as diversity increases, so does the index number.
The most diverse communities have an index of seven or higher. The formula used for index calculation was:
Where, Pi = number of ith individuals in a particular n species divided by the total number of individuals of all species in the community.
RESULTS
Polymorphism of SSR markers and genetic diversity
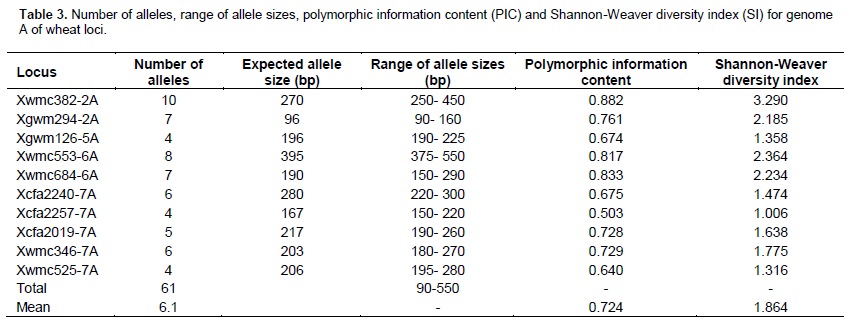
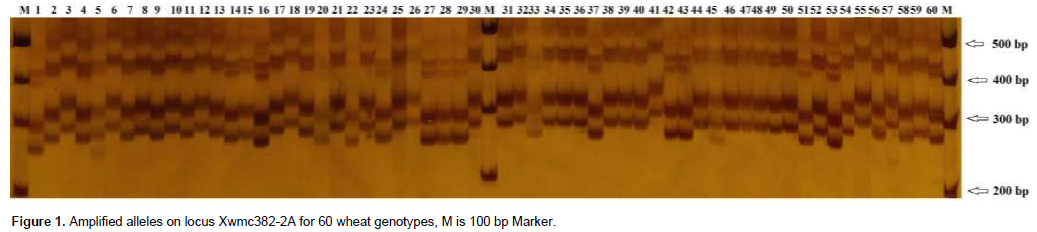
Number of amplified alleles per locus, PIC and SI values varied among wheat genomes A, B and D in the 60 cultivars analyzed. In genome A, locus Xwmc382-2A had the highest number of alleles (10) followed by Xwmc553-6A, which had 8 alleles (Table 3). Locus Xwmc382-2A also had the highest PIC value of 0.882 as well as the highest SI value of 3.290. Locus Xwmc553-6A was second with PIC of 0.817 and SI value of 2.364. The lowest number of alleles per locus (4) in genome A was recorded in the loci Xgwm126-5A, Xcfa2257-7A and Xwmc525-7A. Locus Xcfa2257-7A showed the lowest PIC and SI values of 0.503 and 1.006, respectively (Table 3). For a total of 10 polymorphic loci in the A genome, 61 alleles were recorded and their molecular sizes ranged from 90 to 550 bp. Alleles in locus Xwmc382-2A ranged from 250 to 450 bp and significant polymorphism was observed between 250 and 320 bp (Figure 1).
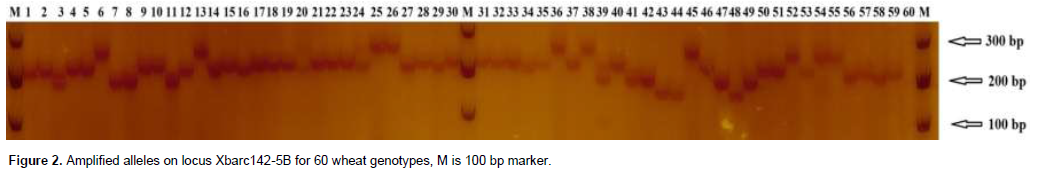
In genome B, locus Xbarc142-5B amplified 10 alleles, being the highest number of all polymorphic loci in the genome, with a range from 175 to 350 bp. Significant polymorphism was observed between 150 and 290 bp (Figure 2). The locus had the highest PIC and SI values of 0.834 and 2.787, respectively (Table 4). This was followed by loci Xwmc810-5B and Xgwm46-7B, having 9 alleles each. Locus Xwmc810-5B showed allele sizes ranging from 150 to 300 bp while the PIC and SI values were 0.868 and 2.533, respectively (Table 4).
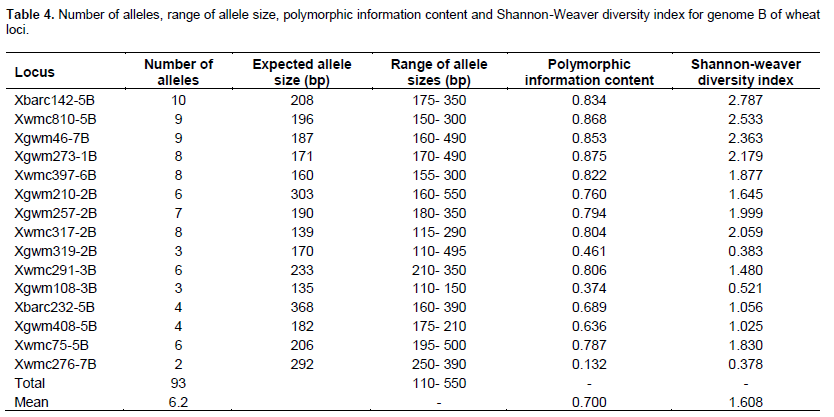
The lowest number of alleles (2) in B genome was recorded in locus Xwmc276-7B with a range between 250 and 390 bp. The locus also exhibited the lowest PIC (0.132) and SI (0.378) value. Loci Xgwm108-3B and Xgwm319-2B amplified 3 alleles each and their molecular sizes ranged from 110 to 495 bp (Table 4).
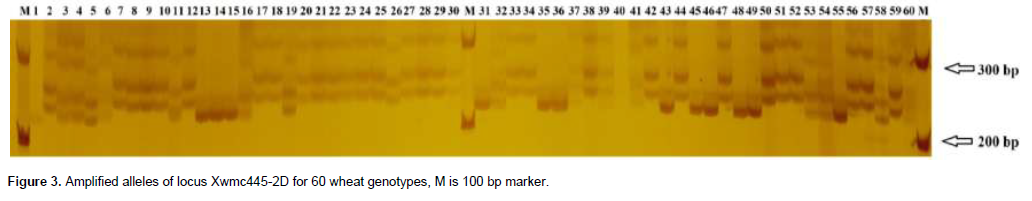
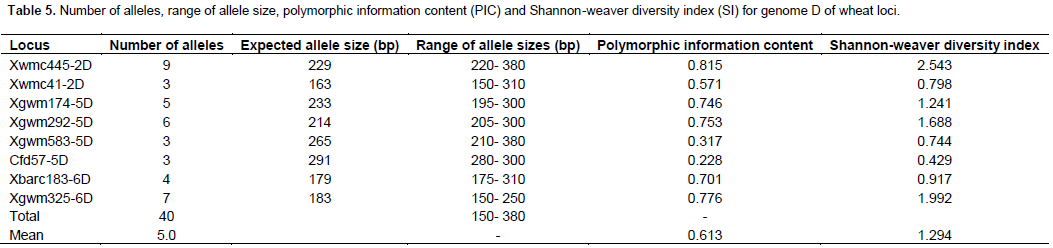
In D genome, the highest number of alleles (9) was recorded in locus Xwmc445-2D (Figure 3) followed by locus Xgwm325-6D with 7 alleles. Xwmc445-2D also had the highest SI and PIC values of 2.543 and 0.815, respectively (Table 5). This was followed by locus Xgwm325-6D, which had an SI value of 1.992 and PIC of 0.776. A total of 40 alleles were recorded in the 8 polymorphic loci of the genome D, with an average of 5 alleles per locus (Table 5). Size of alleles ranged from 150 to 380 bp while average PIC and SI values were 0.613 and 1.294, respectively.
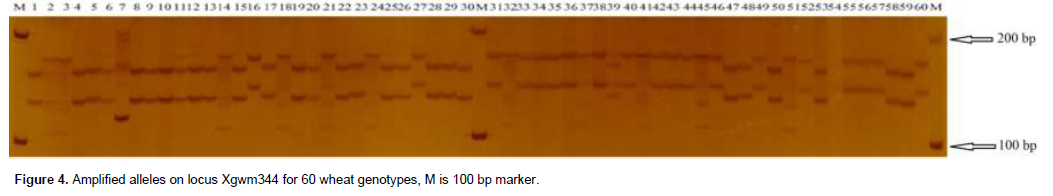
Fifteen markers amplified alleles from multiple loci of the A, B and D wheat genomes. For instance, marker Xgwm344 (Figure 4) amplified alleles from loci in genome A and B for chromosome 7 (Table 6). The marker amplified 7 alleles, as markers Xwmc273 and Xcfd39. It also had the highest PIC and SI values of the group, 0.860 and 1.810 respectively. The lowest number of alleles (4) was found in markers Xcfd81, Xgwm382, Xgwm356 and Xgwm311. These four markers had their SI values below 1.0 (Table 6).
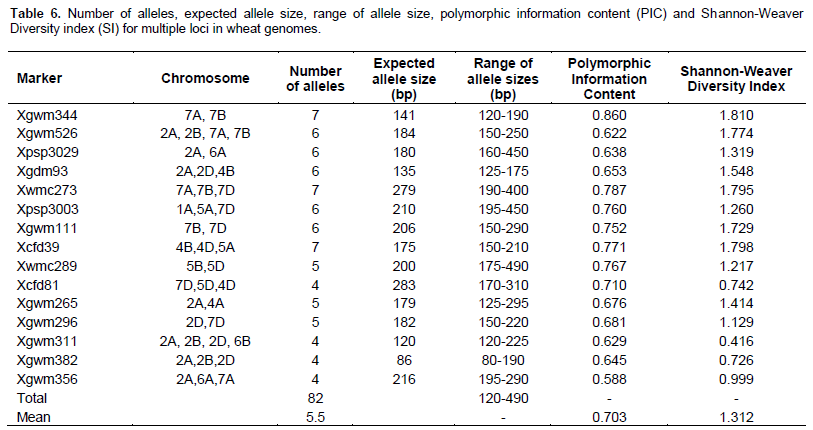
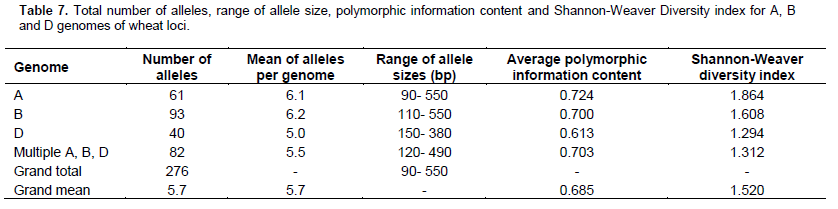
Out of 60 markers studied herein, 48 amplified a total of 276 alleles with an average of 5.7 alleles per locus. 61 alleles were amplified in genome A, 93 in genome B and 40 in genome D. A total of 82 alleles were amplified from markers that detected multiple loci in the wheat genome. Genome A had the highest PIC mean value of 0.724, while the lowest one was recorded in genome D (0.676). Genome A also had the highest SI value of 1.864 while the lowest one of 1.312 was recorded in those markers that detected multiple loci. Sizes of the alleles ranged from 90 to 550 bp with an overall PIC and SI values of 0.703 and 1.543 respectively (Table 7).
Cluster analysis
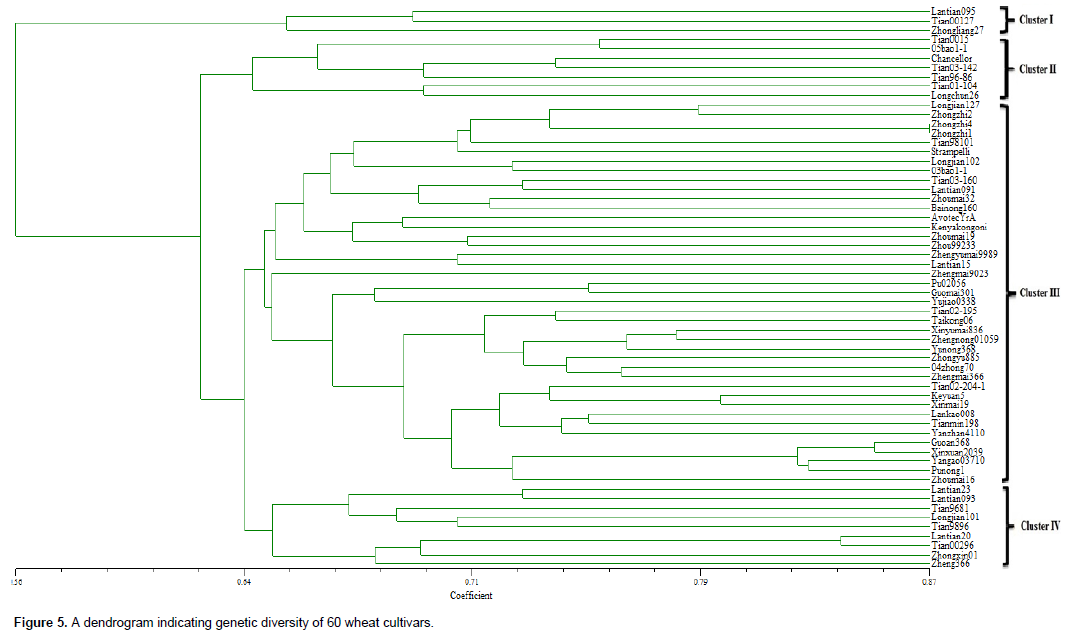
Cluster analysis represented by a dendrogram plotted using the UPGMA method, revealed four major clusters. The genetic distance between clusters ranged from 0.56 to 0.87 and most cultivars showed a high degree of diversity within a range of 0.65 to 0.75 (Figure 5). Cluster 1 was made up of three cultivars namely, Lantian095, Tian00127 and Zhongliang27. The cultivars were spread within a distance range of 0.647 to 0.687. Cluster 2 comprised of seven cultivars, included Tian0015, 05bao1-1, Chancellor, Tian03-142, Tian96-86, Tian01-104 and Longchun26 spread on a distance range of 0.642 to 0.752. Cluster 3 was the largest and most diverse cluster consisting of 41 cultivars. It contained several sub-clusters within a genetic distance range of 0.642 to 0.87. The fourth cluster was composed of 9 cultivars namely Lantian23, Lantian093, Tian9681, Longjian101, Tian989, Lantian20, Tian00296, Zhongxin01 and Zheng366. Its genetic distance ranged between 0.643 and 0.832 (Figure 5).
DISCUSSION
Polymorphism of SSR markers in wheat genomes
SSR markers have been used widely in genetic studies due to their high polymorphism in the genomes (Gupta and Varshney, 2000; Kalia et al., 2011; Jamalirad et al., 2012). In this study, a total of 276 alleles were identified by 48 polymorphic markers with an average of 5.7 alleles per locus. The results are comparable to findings reported elsewhere. In assessing genetic diversity of 62 Sichuan wheat landraces using 114 SSR markers, Li et al. (2013) reported an average of 4.76 alleles per locus, which is slightly lower as compared to the findings herein. Wang et al. (2007) also reported a mean of 3.3 alleles per locus when 60 durum wheat accessions were analyzed using 26 SSR markers. Hazen et al. (2002) found 4.7 and 6.8 alleles per locus in two assays using 24 wheat accessions obtained from Shaanxi province.
However, Spanic et al. (2012) reported a higher mean value of 8.44 alleles per locus following an assessment of 30 wheat genotypes using 24 SSR markers, while Jamalirad et al. (2012) found a mean value of 9.26 allelesper locus when 70 wheat genotypes were evaluated with 50 SSR markers. In some cases, the average number of alleles per locus as 12.06 (Abdellatif and Abouzeid, 2011) and 16.8 (Laido et al., 2013).
Genome A had the highest PIC value followed by genome B while the lowest PIC value was recorded in genome D. The highest PIC value in genome A was recorded for locus Xwmc382-2A (0.882). Kitavi et al. (2014) found a highest PIC of 0.86 in marker Xtxp 265 and a mean PIC value of 0.54, when 30 sorghum accessions were analyzed using 22 markers. Fu et al. (2006) reported a highest PIC value of 0.98 when 37 eSSR markers were tested on 75 Canadian hard red spring wheat. Salem et al. (2008) also obtained a highest PIC value of 0.816 for locus Xgwm437 when 15 SSR markers were analyzed in 9 wheat varieties. In another study, the highest PIC value of 0.93 was found with 45 markers on sixteen bread wheat samples (Cifci and Yagdi, 2012). The results herein are, therefore, consistent with previously reported findings.
Genetic diversity of wheat cultivars
Genetic diversity as measured by Shannon Weaver Index revealed that genome A was the most diverse followed by genome B and then genome D was the least (genome A>genome B>genome D). Similar results were reported by Li et al. (2013). Schuster et al. (2009) also found that genome A had the higher genetic diversity followed by genomes B and D, when analyzing 23 SSRs in 36 Brazilian cultivars. Furthermore, Zhang et al. (2011) reported a low level of polymorphism in D genome when testing DarT markers in 111 common wheat cultivars from northern China. Studies on molecular markers and many other agronomic traits have shown the genetic base of cultivated wheat (Parker et al., 2002; Prasad et al., 2000). The low genetic diversity of genome D has caused a delicate genetic basis for modern cultivated wheat (Jia et al., 2001; Zhang et al., 2002; Chen and Li, 2007).
However, the donor of genome D, Aegilops squarrosa was more diverse than cultivated wheat (Dudnikov, 2000; Pestsova et al., 2000; Gianibelli et al., 2001). It is believed that the low diversity of genome D emanated from evolution of hexaploid wheat. During evolution of hexaploid wheat, genomes A and B produced more tetraploid wheat including Triticum turgidum, Triticum turani-cum, Triticum dicoccoides, Triticum dicoccum, Triticum polonicum, Triticum carthlicum and Triticum durum. These tetraploid wheat species were able to cross with hexaploid wheat thereby enriching the genetic diversity of A and B genome species. The crossing was carried out with Aegilops tauschii, resulting in production of more hexaploid wheat. On the other hand, D genome species did not produce any tetraploid wheat species. This resulted in minor genes exchange in genome D and, consequently, led to the reduction of genetic diversity in this genome benefiting genomes A and B (Perugini, 2007; Wang et al., 2007).
Clustering of wheat cultivars
Cluster analysis using UPGMA method delineated the 60 cultivars into four clusters comprising of 3, 7, 9 and 41 cultivars. Within the major cluster consisting of 41 cultivars, several sub-clusters were formed, showing the effectiveness of microsatellite markers in genetic diversity assays. Several studies using SSR have resulted in successful clustering of wheat cultivars. This type of markers is very effective in delineating diversity based on parental source by grouping cultivars with similar pedigree information (Plaschke et al., 1995; Kitavi et al., 2014) as well as grouping based on agronomic characteristics and geographical origin (Naceur et al., 2012). Depending on the degree of diversity, two (Tahir, 2008; El-Bakatoushi, 2010) or three clusters (Hazen et al., 2002; Wang et al., 2007) can be formed following the UPGMA analysis. In addition, as high as 9 (Naceur et al., 2012) and 13 clusters (Schuster et al., 2009) have been reported in genetic diversity studies. Grouping into four clusters herein is, therefore, within the expected ranges as compared to previously reported results. The 41 cultivars grouped in cluster 3 should be of significant attention to breeders as this may offer a useful guide when doing rational deployment in the field. Most of the cultivars studied herein have not been fully utilized in breeding programs. As such, by belonging to one cluster, it shows that these 41 cultivars share genetic similarities from their parental source, which could make them easily compatible when transferring desirable traits.
CONCLUSION
The present study contributes further to techniques in wheat. It offers an effective and reliable monitoring of wheat genetic diversity, which should be the starting point for future selection programs. Genome A was the most diverse and having most polymorphic loci as shown by SI and PIC values. Genome B was second, followed by genome D. Cluster analysis using UPGMA method delineated the 60 cultivars into four main clusters and several sub-clusters. Furthermore, it was verified that microsatellite markers are effective in conducting genetic diversity studies as a total of 276 alleles were identified by using 48 wheat SSR markers with an average of 5.7 alleles per locus.
The present molecular genetic assay managed to shed more light on the genetic relatedness of wheat cultivars. This might assist breeders to set up the appropriate guidelines for successful breeding of wheat cultivars based on the established relationships.
CONFLICT OF INTERESTS
The authors have not declared any conflict of interests.
ACKNOWLEDGEMENT
The authors thank the Chinese Government through the Chinese Scholarship Council (CSC) for provision of funds to carry out this work.
REFERENCES
|
Abdellatif KF, Abouzeid HM (2011). Assessment of genetic diversity of Mediterranean bread wheat using Randomly Amplified Polymorphic DNA (RAPD) markers. J. Genet. Eng. Biotechnol. 9:157-163. |
|
|
Abdullah NAP, Saleh GB, Putra ETS, Wahab ZB (2012). Genetic relationship among Musa genotypes revealed by microsatellite markers. Afr. J. Biol. 11(26):6769-6776. |
|
|
Ahmed MF, Igbal M, Masood MS, Rabbani MA, Munir M (2010). Assessment of genetic diversity among Pakistani wheat (Triticum aestivum L.) advanced breeding lines using RAPD and SDS-PAGE. J. Biotechnol. 13:3. |
|
|
Akhtar S, Anjum FM, Anjum MA (2011). Micronutrient fortification of wheat flour: Recent development and strategies. F. Res. Int. 44:652-659. |
|
|
Chen G, Li L (2007). Detection of Genetic Diversity in Synthetic Hexaploid Wheats Using Microsatellite Markers. Agric. Sci. Cn. 6(12):1403-1410. |
|
|
Cifci EA, Yagdi K (2012). Study of genetic diversity in wheat (triticum aestivum) varities using Random Amplified Polymorphic DNA (RAPD) analysis. Turkish J. Field Crops 17(1):91-95. |
|
|
Corbellini M, Perenzin M, Accerbi M, Vaccino P, Borghi B (2002). Genetic diversity in bread wheat, as revealed by coefficient of parentage and molecular markers, and its relationship to hybrid performance. Euphytica 123:273-285. |
|
|
Coventry DR, Gupta RK, Yadav A, Poswal RS, Chhokar RS, Sharma RK, Yadav VK, Gill SC, Kumar A, Mehta A, Kleemann SGL, Bonamano A, Cummins JA (2011). Wheat quality and productivity as affected by varieties and sowing time in Haryana, India. Field Crop Res. 123:214-225. |
|
|
Dudnikov AJ (2000). Multivariate analysis of genetic variation in Aegilops tauschii from the world germplasm collection. Genet. Res. Crop Evol. 47:185-190. |
|
|
Edwards A, Civitello A, Hammond HA, Caskey CT (1991). DNA typing and genetic mapping with trimeric and tetrameric tandem repeats. Am. J. Hum. Genet. 49:746-756. |
|
|
El-Bakatoushi R (2010). Genetic diversity of winter wheat (Triticum aestivum L.) growing near a high voltage transmission line. Rom. J. Biol. Plant Biol. 55 (2):71-87. |
|
|
FAO (2014). Food and Agricultural Organization of the United State(FAOSTAT) FAO, http://faostat3.fao.org/browse/Q/QC/E (Accessed 21 November 2014). |
|
|
Friedrich C, Longin H, Reif CJ (2014). Redesigning the exploitation of wheat genetic resources. Trends Plant Sci. 19 (10):631-636. |
|
|
Fu Y, Peterson GW, Gao JUL, Jia J, Richards KW (2006). Impact of plant breeding on genetic diversity of the Canadian hard red spring wheat germplasm as revealed by EST-derived SSR markers. Theor. Appl. Genet. 112:1239-1247. |
|
|
Fu YB, Peterson GW, Richards KW, Somers D, DePauw RM, Clarke JM (2005). Allelic reduction and genetic shift in the Canadian hard red spring wheat germplasm released from 1845 to 2004. Theor. Appl. Genet. 110:1505-1516. |
|
|
Fu ZQ, Cai YL, Yang YX (2001). Research on the relationship of cultivated land change and food security in China. J. Nat. Resour. 16: 313-319. |
|
|
Gianibelli MC, Gupta RB, Lafiandra D, Margiottaa B, MacRitchie F (2001). Polymorphism of high M, glutenin subunits in Triticum tauschii: Characterization by chromatography and electrophoretic methods. J. Cereal Sci. 33:39-52. |
|
|
Gupta PK, Varshney RK (2000). The development and use of microsatellite markers for genetics and plant breeding with emphasis on bread wheat. Euphytica 113:163-185. |
|
|
Hazen SP, Zhu L, Kim H, Tang G, Ward RW (2002). Genetic diversity of winter wheat in Shaanxi province, China, and other common wheat germplasm pools. Genet. Res. Crop Evol. 49:437-445. |
|
|
Jacob HJ, Lindpaintnesr K, Kusumir EL, Bunkery K, Mao IP, Gantenv D, Dzau J, Lander ES (1991). Genetic mapping of a gene causing hypertension in the stroke-prone spontaneously hypertensive rat. Cell 67:213-224. |
|
|
Jamalirad S, Mohammadi SA, Toorchi M (2012). Assessing genetic diversity in a set of wheat (Triticum aestivum) genotypes using microsatellite markers to improve the yellow rust resistant breeding programs. Afr. J. Agric. Res. 7(48):6447-6455. |
|
|
Jia JZ, Zhang ZB, Devos K, Gale MD (2001). RFLP map based genetic diversity in wheat (Tritivum aestivum L). Sci. Cn. 31:13-21. |
|
|
Kalia RK, Rai MK, Kalia S, Singh R, Dhawan AK (2011). Microsatellite markers: an overview of the recent progress in plants. Euphytica 177:309-334. |
|
|
Khodadadi M, Fotokian MH, Miransari M (2011). Genetic diversity of wheat (Triticum aestivum L.) genotypes based on cluster and principal component analyses for breeding strategies. Aust. J. Crop Sci. 5(1):17-24. |
|
|
Kitavi MN, Kiambi DK, Haussman B, Semagn K, Muluvu G, Kairichi M, Machuka J (2014). Assessment of genetic diversity and pattern of relationship of West African sorghum accessions using microsatellite markers. Afr. J. Biol. 13(14):1503-1514. |
|
|
Laido G, Mangini G, Taranto F, Gadaleta A, Blanco A, Cattivelli L, Marone D, Mastrangelo AM, Papa R, De Vita P (2013). Genetic Diversity and Population Structure of Tetraploid Wheats (Triticum turgidum L.) Estimated by SSR, DArT and Pedigree Data. Plos One 8(6):1-17. |
|
|
Li W, Bian C, Wei Y, Liu A, Chen G, Pu Z, Liu Y, Zheng Y (2013). Evaluation of genetic diversity of Sichuan common wheat landraces in China by SSR markers. J. Integr. Agric. 12(9):1501-1511. |
|
|
Li K, Yanga X, Liu Z, Zhang T, Lua S, Liu Y (2014). Low yield gap of winter wheat in the North China Plain. Europ. J. Agron. 59:1-12. |
|
|
Liu H, Wanga ZH, Li F, Li K, Yang N, Yang Y, Huang D, Liang D, Zhao H, Mao H, Liub J, Qiu W (2014). Grain iron and zinc concentrations of wheat and their relationships to yield in major wheat production areas in China. Field Crops Res. 156:151-160. |
|
|
Lu C, Fan L (2013). Winter wheat yield potentials and yield gaps in the North China Plain. Field Crops Res. 143:98-105. |
|
|
Lu CH, Li XB, Tan MH (2007). China's farmland use: A scenario analysis of changes and trends. In: Spoor, M., Heerink, N., Qu, F. (Eds.), Dragons with Clay Feet? Transition, Sustainable Rural Resource Use, and Rural Environment in China and Vietnam. Rowman & Littlefield, Lexington Books, Lanham and Boston, USA. pp. 309-326. |
|
|
Meti M, Samal KC, Bastia DN, Rout GR (2013). Genetic diversity analysis in aromatic rice genotypes using microsatellite based simple sequence repeats (SSR) marker. Afr. J. Biol. 12:4238-4250. |
|
|
Mir RR, Kumar J, Balyan HS, Gupta PK (2012). A study of genetic diversity among Indian bread wheat (Triticum aestivum L.) cultivars released during last 100 years. Genet. Resour. Crop. Evol. 59:717-726. |
|
|
Naceur AB, Chaabane R, El-Faleh M, Abdelly C, Ramla D, Nada A, Sakr M, Naceur MB (2012). Genetic diversity analysis of North Africa's barley using SSR markers. J. Genet. Eng. Biotechnol. 10:13-21. |
|
|
Parker GD, Fox PN, Langridge P, Chalmers K, Whan B, Canter PF (2002). Genetic diversity within Australian wheat breeding programs based on molecular and pedigree data. Euphytica 124:293-306. |
|
|
Peng JH, Lapitan NLV (2005). Characterization of EST-derived microsatellites in the wheat genome and development of eSSR markers. Funct. Inter. Genom. 5:80-96. |
|
|
Perugini LD (2007). Genetic Characterization of Wheat Germplasm with Resistance to Fusarium Head Blight (FHB) and Powdery Mildew. A dissertation submitted to the Graduate Faculty of North Carolina State University in partial fulfillment of the requirements for the degree of Doctor of Philosophy. pp. 2-123. |
|
|
Pestsova EG, BBrner A, Roder MS (2000). Development of a set of Triticum aestivum-Aegilops tauschii introgression lines. Hereditas 135:2-3. |
|
|
Plaschke J, Ganal MW, Roder MS (1995). Detection of genetic diversity in closely related bread wheat using microsatellite markers. Theor. Appl. Genet. 91:1001-1007. |
|
|
Powell W, Morgante M, Andre C, Hanafey M, Vogel J, Tingey S, Rafalski A (1996). The comparison of RFLP, RAPD, AFLP and SSR (microsatellite) markers for germplasm analysis. Mol. Breed. 2:225-238. |
|
|
Prasad M, Varshney RK, Kumar A (2000). A microsatellite marker associated with QTL for grain protein content on chromosome arm 2DL of bread wheat. Theor. Appl. Genet. 100:341-345. |
|
|
Reynolds M, Bonnett D, Chapman SC, Furbank RT, Manes Y, Mather DE, Parry MAJ, 2011. Raising yield potential of wheat. I. Overview of a consortium approach and breeding strategies. J. Exp. Bot. 62:439-452. |
|
|
Rohlf FJ (2000). NTSYS-pc. Numerical Taxonomy and Multivariate Analysis System: Version 2.1. Appl. Biostat. New York. |
|
|
Romero G, Adeva C, Battad Z (2009). Genetic fingerprinting: Advancing the frontiers of crop biology research. Philipp. Sci. Lett. 2:8-13. |
|
|
Roussel V, Koenig J, Beckert M, Balfourier F (2004). Molecular diversity in French bread wheat accessions related to temporal trends and breeding programmes. Theor. Appl. Genet. 108:920-930. |
|
|
Royo C, Maccaferri M, A lvaro F, Moragues M, Sanguineti MC, et al. (2010). Understanding the relationships between genetic and phenotypic structures of a collection of elite durum wheat accessions. Field Crops Res. 119:91-105. |
|
|
Ruiz M, Giraldo P, Royo C, Villegas D, Aranzana MJ (2012). Diversity and genetic structure of a collection of Spanish durum wheat landraces. Crop Sci. 52: 2262-2275. |
|
|
Salem KFM, El-Zanaty AM, Esmail RM (2008). Assessing wheat (Triticum aestivum L.) genetic diversity using morphological characters and microsatallite markers. World J. Agric. Sci. 4(5):538-544. |
|
|
Schuster I, Vieira ESN, da Silva GJ, Franco FDA, Marchioro VS (2009). Genetic variability in Brazilian wheat cultivars assessed by microsatellite markers. Genet. Mol. Biol. 32(3):557-563. |
|
|
Shakeel M, Azam S (2012). Microsatellite based investigation of genetic diversity in 24 synthetic wheat cultivars. Afr. J. Biol. 11(72):13627-13632. |
|
|
Singh R, Nagappan J, Tan S, Panandam JM, Cheah S (2007). Development of simple sequence repeat (SSR) markers for oil palm and their application in genetic mapping and fingerprinting of tissue culture clones. Asia Pac. J. Mol. Biol. Biotechnol. 15(3):121-131. |
|
|
Spanic V, Buerstmayr H, Drezner G (2012). Assessment of genetic diversity of wheat genotypes using microsatellite markers. Period. Biol. 114(1):37-42. |
|
|
Tahir NA (2008). Assessment of Genetic Diversity Among Wheat Varieties in Sulaimanyah using Random Amplified Polymorphic DNA (RAPD) Analysis. Jordan J. Biol. Sci. 1(4):159-164. |
|
|
Tautz D (1989). Hypervariability of simple sequences as a general source for polymorphic DNA markers. Nucl. Acid Res. 17:6463-6471. |
|
|
Tong C, Hall CAS, Wang H (2003). Land use change in rice, wheat and maize production in China (1961–1998). Agric. Ecosyst. Environ. 95:523-536. |
|
|
Varshney RK, Marcel TC, Ramsay L, Russell J, Roder MS, Stein N, Waugh R, Langridge P, Niks RE, Graner A (2007). A high density barley microsatellite consensus map with 775 SSR loci. Theor. Appl. Genet. 114:1091-1103. |
|
|
Wang H, Wang X, Chen P, Liu D (2007). Assessment of Genetic Diversity of Yunnan, Tibetan, and Xinjiang Wheat Using SSR Markers. J. Genet. Genom. 34(7):623-633. |
|
|
Wang H, Wei Y, Yan Z, Zheng Y (2007). EST-SSR DNA polymorphism in durum wheat (Triticum durum L.) collections. J. Appl. Genet. 48(1): 35-42. |
|
|
Zhang L, Liu D, Guo X, Yang W, Sun J, Wang D, Sourdille P, Zhang A (2011). Investigation of genetic diversity and population structure of common wheat cultivars in northern China using DArT markers. Bio- Med. Center Genet. 12(42):1471-2156. |
|
|
Zhang XY, Li CW, Wang LF, Wang HM, You GX, Dong YS (2002). An estimation of the minimum number of SSR alleles needed to reveal genetic relationships in wheat varieties. Information from large-scale planted varieties and cornerstone breeding parents in Chinese wheat improvement and production. Theor. Appl. Genet. 106:112-117. |
|
|
Zheng Y (2010). Detection of latent infection of wheat leaves caused by Blumeria graminis f. sp. tritici using Real-time PCR. MSc thesis. Chin. Acad. Agric. Sci. pp. 9-34. |
|
Copyright © 2024 Author(s) retain the copyright of this article.
This article is published under the terms of the Creative Commons Attribution License 4.0


