ABSTRACT
Anthracnose (Colletotrichum lindemuthianum), Angular leaf spot (Pseudocercospora griseola) and Pythium root rot are important pathogens affecting common bean production in the tropics. A promising strategy to manage these diseases consists of combining several resistance (R) genes into one cultivar. The aim of the study was to determine genetic linkage between gene pairs, Co-42/Phg-2, on bean-chromosome Pv08 and Co-5/“P.ult” on-chromosome Pv07, to increase the efficiency of dual selection of resistance genes for major bean diseases, with molecular markers. The level of recombination was determined by tracking molecular markers for both BC3F6 and F2 generations. Recombination fraction r, among gene pairs, the likelihood of linkage, L(r), and logarithm of odds (LOD) scores were computed using the statistical relationship of likelihood which assumes a binomial distribution. The SCAR marker pair SAB3/PYAA19 for the gene pair Co-5/“P.ult” exhibited moderate linkage (r = 32 cM with a high LOD score of 9.2) for BC3F6 population, but relatively stronger linkage for the F2 population (r = 21 cM with a high LOD score of 18.7). However, the linkage among SCAR marker pair SH18/SN02, for the gene pair Co-42/Phg-2 was incomplete for BC3F6 population (r = 47 cM with a low LOD score of 0.16) as well as F2 population (r = 44 cM with a low LOD score of 0.7). Generally, the weak or incomplete genetic linkage between marker pairs studied showed that all the four genes mentioned earlier have to be tagged with a corresponding linked marker during selection. The approaches used in this study will contribute to two loci linkage mapping techniques in segregating plant populations.
Key words: Genetic linkage, recombination, likelihood, logarithm of odds (LOD) score, sequence characterized amplified regions (SCAR) markers, genes.
Diseases are critical production constraints for common beans in tropical countries, causing total crop failure when several pathogens attack susceptible bean genotypes under favorable conditions (Schwartz and Galvez, 1980; Mahuku et al., 2011). Management of diseases at farm level in short and long term is practical, through genetic control by incorporating resistant alleles for different pathogens into selected cultivars through marker assisted gene pyramiding techniques (Young and Kelly, 1996; Malav et al., 2016).
Marker assisted breeding strategies for pyramiding genes requires information on marker co-transmissions (Mahuku et al., 2011; http://www.extension.org/pages/32465/gene-pyramiding-using-molecularmarkers#.ViTJovlViko). Molecular markers and genetic maps accelerate identification of desirable homozygotes without need for progeny tests (Pathania et al., 2014).
Genetic maps and markers of major disease of beans are reported for bean breeding (Kelly et al., 2003; Oblessuc et al., 2013; Perseguini et al., 2016) and in the Phaseolus Genes database (
http://phaseolusgenes.bioinformatics.ucdavis.edu/; Miller et al., 2018) and may be utilised in gene pyramiding.
Generating breeding information on linkages of sequence characterized amplified region (SCAR) marker pairs and their co-segregations could help to reduce sample sizes and time during marker assisted pyramiding (stacking together) of major genes in breeding programs for managing multiple diseases of common bean.
Practically, a polymorphic marker must co-segregate with the gene of interest and so be present in the resistant progeny lines but absent in susceptible ones (Miller et al., 2018). Once linkage is established between markers, the chromosomal region flanking the marker can then be analyzed for alternative markers.
Genetic linkage is the tendency of genes that are located proximally to each other on a chromosome to be inherited together during meiosis and can therefore be used as a tool for estimating the genetic distance between two loci (Ott et al., 2015). Two statistical approaches, termed parametric and nonparametric linkage analysis have been used to test, linkage analysis or observed recombination between two loci and is detailed by Bailey-Wilson and Wilson (2011).
Parametric linkage analysis was applied in this study and its test statistic is called the logarithm of odds (LOD) score (Balding et al., 2007; Strachan and Read, 2011). A LOD score higher than 3.0 is generally accepted as the evidence supporting linkage, whereas a LOD score lower than -2.0 is considered evidence against linkage (Ott et al., 2015).
LOD score analysis is a simple way to determine the linkage between Mendelian traits (or between a trait and a marker, or two markers). On the other hand, the nonparametric linkage analysis is a model-free approach that studies the probability of an allele being identical by descent. Balding et al. (2007) and Strachan and Read (2011) describe the LOD score method in greater detail. Briefly, it works as follows: estimates of recombinant and non-recombinant fraction is made, the overall likelihood, given linkage and the likelihood, given no linkage and a LOD score is calculated for each estimate of recombination fraction.
The recombination fraction estimate with the highest LOD score is considered the best estimate. The two-point LOD score between two loci, that is, a trait and a marker or marker-marker loci in this study was typically calculated over several recombination fractions between 0 and 1/2, and the recombination fraction that maximizes the likelihood (the maximum LOD score) is considered to be the best estimate of the recombination fraction (Bailey-Wilson and Wilson, 2011).
For most occurrences of crossing-over, genes located at close physical postion are co-inherited due to linkage, while genes far apart tend to segregate independently (Ott et al., 2015). Genetic recombination through chromosomal cross-over after hybridization produces new haplotypes during meiosis through inter-chromosomal genetic material exchange and plays a critical role in the evolution of organisms (Coop and Przeworski, 2007).
Estimates of recombination rates are traditionally obtained by directly counting the number of such events during meiosis (Kaplan and Hudson, 1985). This approach is however, limited by the extremely low fraction of recombinations between tightly linked genes (Gao et al., 2016). Two loci that are far apart on the chromosome have a high probability of recombination in any meiosis, such that they assort independently to offspring (Bailey-Wilson and Wilson, 2011). While, loci that are very far apart experience recombination about 50% of the time, and thus appear to be assorting independently, just as loci on different chromosomes do.
Probability refers to knowing parameters (measurable characteristic of a system) and being able to predict their outcomes, while Likelihood is a synonym for probability where observed data is used to estimate parameters (Edwards, 1972). The likelihood ratio test that is the basis of modern parametric likelihood ratio tests for linkage (Bailey-Wilson and Wilson, 2011) likelihood ratio test that is the basis of modern parametric likelihood ratio tests for linkage (Bailey-Wilson and Wilson, 2011). In this study, the likelihood hypothesing linkage was compared to a hypothesis of no linkage with some specific recombination fraction (r < 1/2).
At data analysis levels, observations are already completed, the data is fixed and there is no probabilistic part of the data anymore (Edwards, 1972). Likelihood of the model parameters that underlie the fixed data would then be of most interest. Maximum likelihood estimation (MLE) thus aims to find the parameter value(s) that makes the observed data most likely (Staub et al., 1996; Toomet and Henningsen, 2009).
This study aimed at estimating recombination frequencies and genetic linkage between gene pairs, Co-42/Phg-2 on bean chromosome Pv08 and Co-5/“P.ult” on chromosome Pv07.
In the study, the gene symbol “P.ult” is for Pythium ultimum root rot resistance gene linked to (SCAR) marker PYAA19 developed by Mahuku et al. (2007) for selecting bean lines resistant to several species of Pythium root rot in common bean. According to the developers of the SCAR marker, the linked gene symbol is Pyult1. The gene symbol for root rot disease used in this study is “P.ult”, shortened from the targeted pathogen’s genus (Pythium) and species (ultimum) names. The gene symbol (“P.ult”) was thus put between quotation marks within the text and not italicised, unlike the other genes in this study (that is, Co-42 , Phg-2 and Co-5) because it is not an official genetic symbol in common beans.
The findings will contribute to the efficiency of marker assisted pyramiding of disease resistance genes in common bean leading to simultaneous expression of more than one gene in a variety to develop durable resistance expression (Malav et al., 2016).
Population development
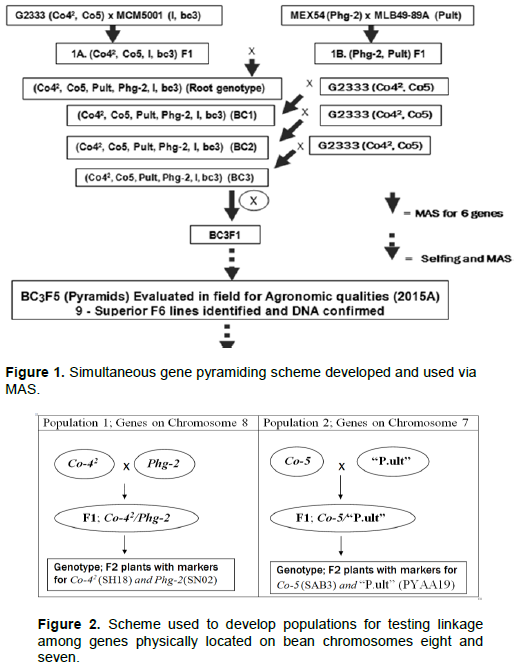
Two segregating bean populations: BC3F6 and F2 were developed for this study and are described as follows. In the start, a BC3F5 population previously developed at CIAT of Kawanda (Uganda) to combine six disease resistance genes of common bean, namely Co-42, Co-5, Phg-2, “P.ult”, I and bc-3 (Figure 1) formed the genetic material for this study.
The BC3F5 population was planted in the fields at CIAT, Kawanda in 2015 to advance it to BC3F6 population from which DNA of 345 plants was collected and genotyped with SCAR markers in the molecular laboratory facility at CIAT, Kawanda as detailed subsequently. Bean plants with single dorminant genes (specifically, Co-42, Co-5, Phg-2, “P.ult”) were identified among the 345 plants of BC3F6 population using genotypic electrophoresis gel profiles, harvested and seed used as parents to develop new crosses and populations (Figure 2) in the screen house facility at CIAT, Kawanda.
Five representative plants from progenies of the BC3F6 population with single genes were planted in 5 litre's plastic pots with sterile soils, labelled and monitored with daily watering until flowering and crosses made through hand pollinations to generate two F1 populations between respective plants with targeted single genes (Co-42 x Phg-2 – population 1 and Co-5 x “P.ult” – population 2). The F1 seeds from the two populations were harvested separatelty dried and planted in the screen house in the second season in 2015 to generate two populations of F2 plants which were monitored until maturity and harvested. The F2 seeds were planted in the screen house in sterile soils in raised wooden trays measuring 75 cm long × 45 cm wide and height of 13 cm during the third season to generate plants for DNA extraction.
DNA extraction
The genomic DNA from 345 plants from BC3F6 population in the field was collected from young leaves before flowering in eppendorf tubes, clearly labelled and transferred to the laboratory for extraction. DNA of each plant was isolated in the molecular laboratory facility at CIAT, Uganda, using the CTAB method according to Mahuku (2004), and kept in Eppendorf tubes at -20°C for further analyses.
The two F2 populations having 219 plants targeting genes; Co-42 x Phg-2 – population 1 and 236 plants targeting Co-5 x “P.ult” - population 2 were planted in trays in the screen house and DNA was extracted from seedlings at the second trifoliate stage. The DNA was extracted using the Whatman FTA card technology according to Chilagane et al., (2013). The leaf sample was placed over the marked area of the FTA Plant Saver card and the leaf was overlaid with parafilm. The leaf was pounded using a pestle, making sure that the leaf material was transferred to the paper by checking the back of the FTA card.
The samples were left to air dry and later transferred to the laboratory. The Harris 2 mm unicore punch, was used to cut the samples from the FTA cards with the assistance of the cutting mat and placed into the PCR tube and then washed twice using 200 ml of FTA purification reagent followed by 200 ml of 1X TE buffer (10 mM Tris HCl, 0.1 mM EDTA, pH 8.0) and the sample left to incubate at room temperature for about 10 min in each wash, then the leaf disks were left to dry and ready for PCR reaction.
Polymerase chain reaction (PCR) and electrophoresis
DNA samples for amplification through PCR were diluted to a factor of 1 in 30 µl solution and sorted out according to the field plan. The PCR reaction mix contained 5 µl of the Accu-Power PCR premix composed of DNA polymerase, dNTPs, reaction buffer, blue tracking dye and patented stabiliser. One microlitre of DNA for plants from BC3F6 population and leaf disk for the two F2 populations, 0.3 µl of forward and reverse primer, and 3.4 µl water was added to the premix to make a total reaction volume of 10 µl. The test sample tubes were placed in a thermocycler (MyGenie, Daejeon) for the PCR reaction cycles. Forward (F) and Reverse (R) primers of SCAR marker SBB14 (F-GTGGGACCTGTT-CAAGAATAATAC, R-GTGGGACCTGGGTAGTGTAGAAAT) was used to tag common bean lines with the Co-42 gene, SN02 (F-ACCAGGGGCATTATGAACAG, R-ACCAGGGGCAACATACTATG) for the Phg-2 gene, PYAA19 (F-TTAGGCATGTTAATT-CACGTTGG, R-TGAGGCGTGTAAGGTCAGAG) for “P.ult” and SAB3 (F-TGGCGCACACATAAGTTCTCACGG, R-TGGCGCACACCATCAAAAAAGGTT) for Co-5. The PCR products of markers used were separated on 1.2% agarose gel in 1X TBE at 140V for 30 min. The gel was then stained in 0.5ug/mL ethidium bromide for 20 min and the image was captured using the Syngene G: BOX gel documentation system (Syngene, Fredrick, MD).
Data analysis
Marker scoring and establishing number of recombinants
The SCAR marker frequencies (SH18 for Co-42, SN02 for Phg-2, SAB3 for Co-5 and PYAA19 for “P.ult”) were computed for BC3F6 and F2 bean populations to determine the number of recombinants and for further linkage analysis. This involved scoring polymorphic bands observed on electrophoresis gel pictures for each genotype using one for presence and zero for absence of bands. Recombinant genotypes were identified by counting band patterns in gel pictures in both BC3F6 and F2 populations.
Recombinants, LOD score and likelihood ratio analysis
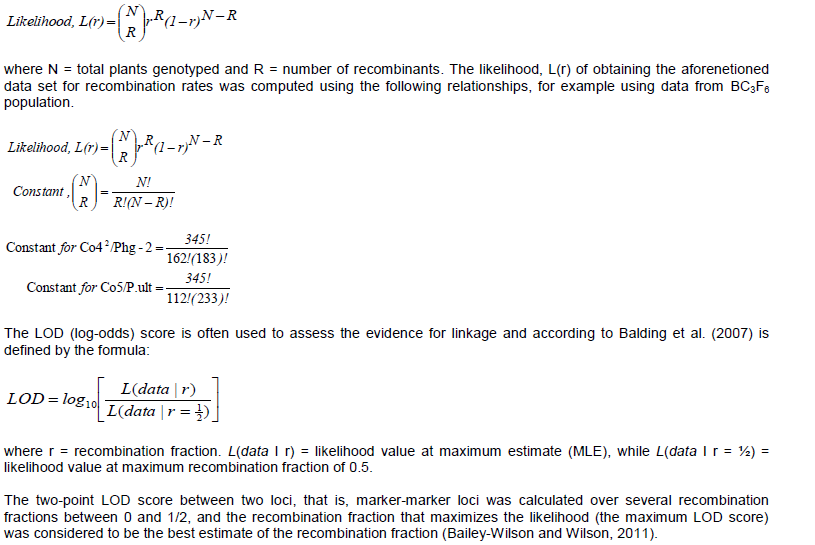
The methods for estimating LOD score, likelihoods and recombination value were previously described by Geffroy et al., (2008). Recombination fraction, r, among gene pairs, the likelihood L(r) and LOD scores were generated using the following statistical relationship, assuming a binomial distribution of data in MS office Excel.
where N = total plants genotyped and R = number of recombinants. The likelihood, L(r) of obtaining the aforenetioned data set for recombination rates was computed using the following relationships, for example using data from BC3F6 population.
Recombinants, likelihood and LOD scores in BC3F6 population
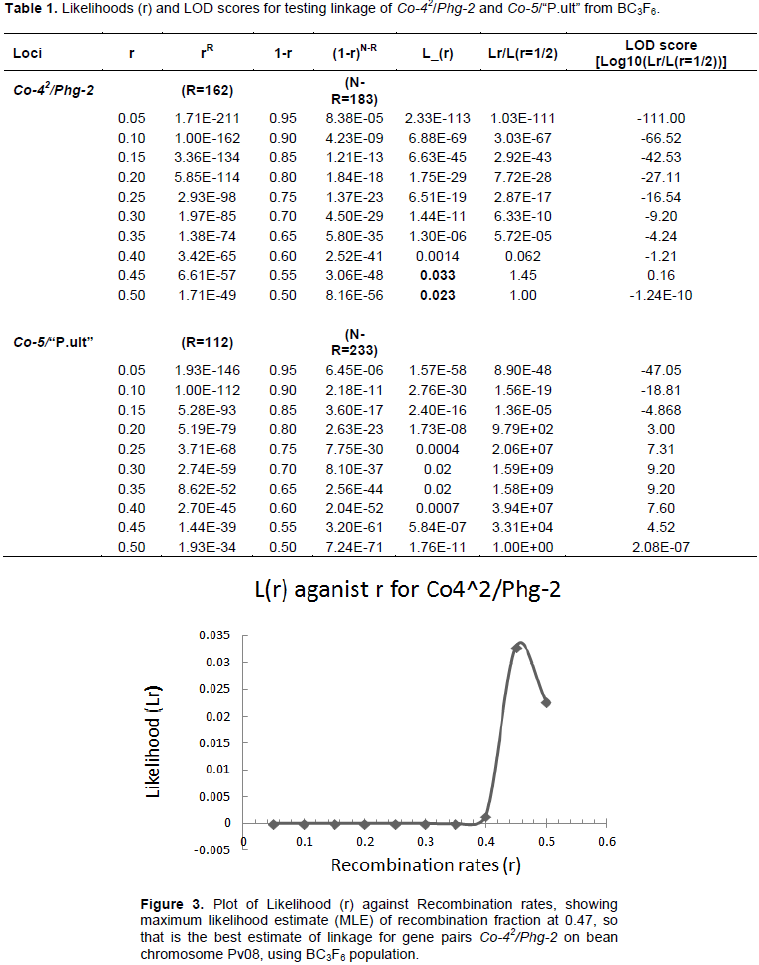
The results of likelihoods (r) and LOD scores for testing linkage among gene pairs, Co-42/Phg-2 and Co-5/“P.ult” from bean populations at BC3F6 generation are shown in Table 1. For gene pairs, Co-42/Phg-2, 162 genotypes were recombinants (having two genes, Co-42/Phg-2) and the rest of the genotypes (n= 183) were non-recombinants (Table 1). Similarly, for gene pairs, Co5/“P.ult”, 112 genotypes were recombinants and 233 non-recombinants.
Graphics of likelihood, recombination rates and LOD score in BC3F6 population
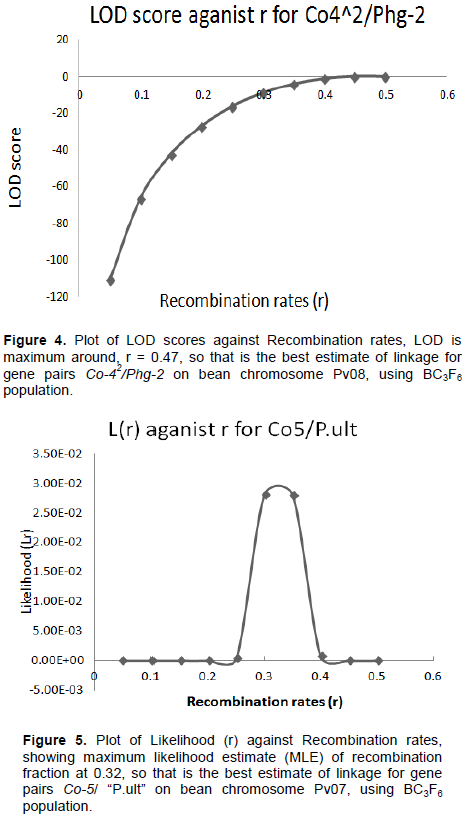
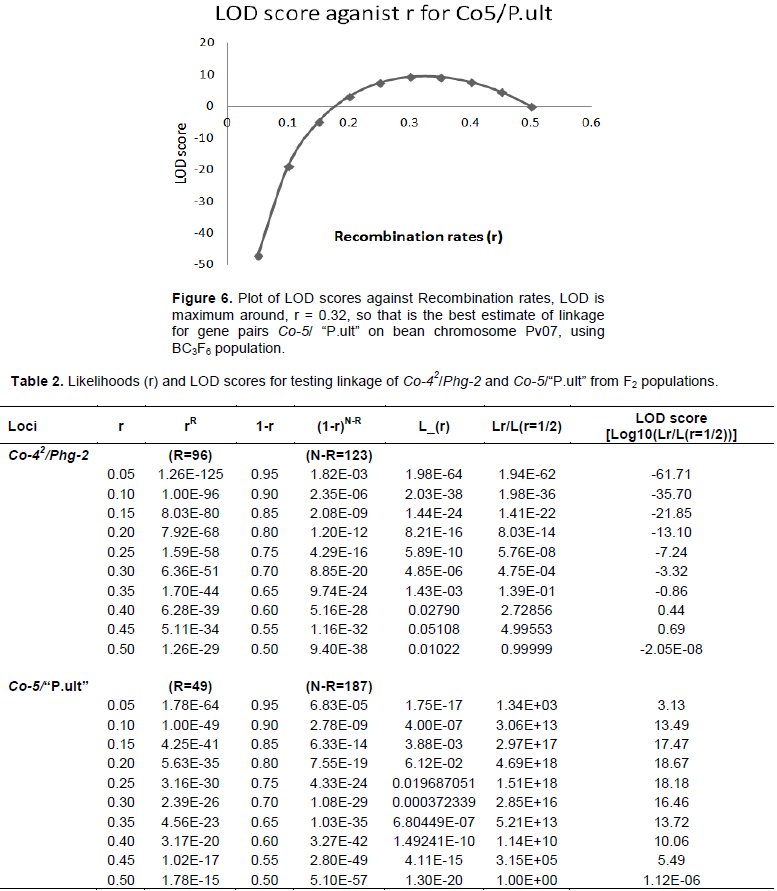
The graphical presentation of likelihood (r) and maximum recombination rates at 0.47 (the maximum likelihood estimate (MLE)) extracted from Table 1 for gene pairs Co-42/Phg-2 are as shown in Figure 3 and 4. Similarly, the graph of the plot between LOD score from Table 1 and recombination rates ranging from 0 to 0.5 had the same pattern (Figure 4), suggesting that the recombination fraction between Co-42/Phg-2 was 0.47 showing weak linkage. However, the graph of the plot of likelihood (r) and recombination rates was maximum at 0.32 for gene pairs Co-5 and “P.ult” (Figure 5). Similarly, the graph of LOD score and recombination rates (Figure 6) had the same pattern, suggesting that the recombination fraction between Co-5 and “P.ult” was 0.32 showing a stronger linkage.
Recombinants, likelihood and LOD scores in F2 populations
The results of likelihoods (r) and LOD scores for testing linkage among gene pairs, Co-42/Phg-2 and Co-5/“P.ult” from bean populations at F2 generation are shown in Table 2. For gene pairs, Co-42/Phg-2, 96 genotypes were recombinants (having two genes, Co-42/Phg-2) and the rest of the genotypes (n= 123) were non-recombinants (Table 2). Similarly, for gene pairs, Co-5/“P.ult”, 49 genotypes were recombinants and 187 non-recombinants.
Graphics of likelihood, recombination rates and LOD score in F2 populations
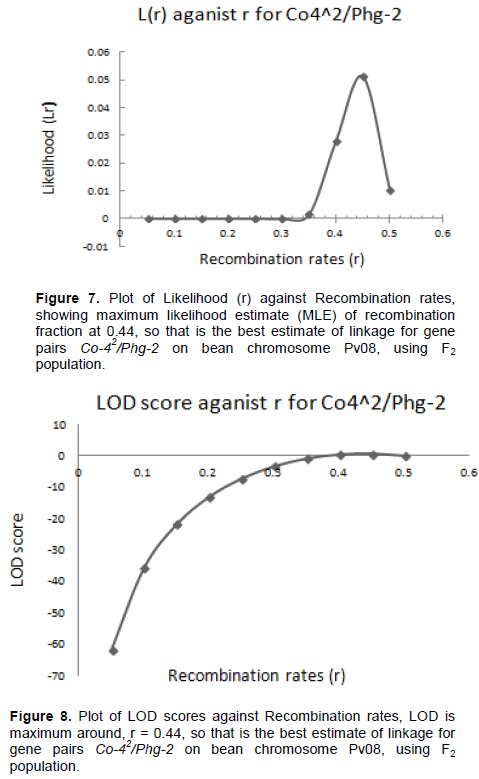
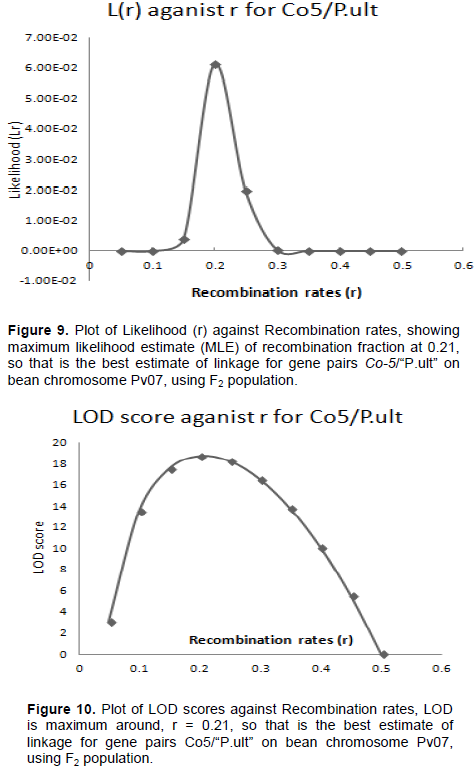
The graphical presentation of likelihood (r) and maximum recombination rates of 0.44 (the maximum likelihood estimate (MLE)) from Table 2, for gene pairs Co-42/Phg-2 is as shown in Figures 7 and 8. Similarly, the graph of the plot between LOD score from Table 2 and recombination rates ranging from 0 to 0.5 had the same pattern (Figure 8), suggesting that the recombination fraction between Co-42/Phg-2 was 0.44, showing weak linkage. However, the graph of the plot of likelihood (r) and recombination rates was maximum at 0.21 for gene pairs Co-5 and “P.ult” (Figure 9). Similarly, the graph of LOD score and recombination rates (Figure 10) had the same pattern, suggesting that the recombination fraction between Co-5 and “P.ult” was 0.21 showing a stronger linkage.
Testing linkage using log-likelihood statistic
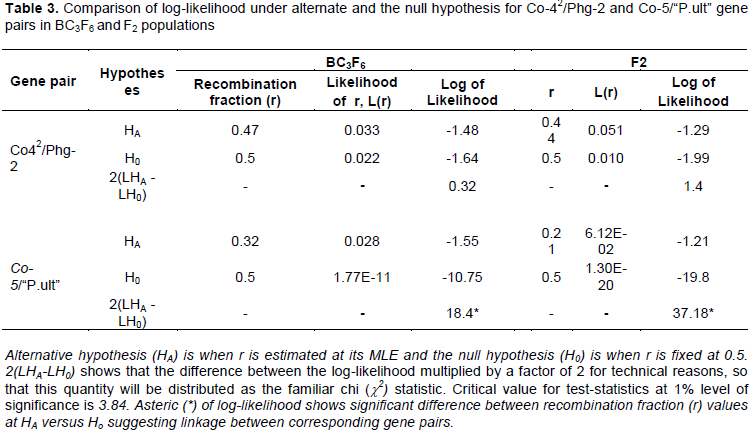
The summary of recombination fraction and likelihood data is shown in Table 3 and was used to test the significance of linkages through comparison of log- likelihood under null and alternate hypotheses (where c2tabulated = 3.84) for a given gene pair in both BC3F6 and F2 populations. For gene pair, Co-42/Phg-2 the computed chi value of 0.32 and 1.4 in BC3F6 and F2 populations, respectively (Table 3) shows no significant difference between the null hypothesis (r = 0.5, no linkage) and the alternative hypothesis (r = 0.47, suggesting linkage). The marker loci for gene pairs Co-42/Phg-2 are thus not linked in BC3F6 and F2 bean populations studied. In contrast, for gene pairs, Co-5/“P.ult”, the computed chi value of 18.4 and 37.18 in BC3F6 and F2 populations, respectively (Table 3) shows significant difference between the null hypothesis and the alternative hypothesis. The marker loci for gene pairs Co-5/“P.ult” are thus linked in BC3F6 and F2 bean populations studied.
The objective of this study was to estimate recombination fractions and genetic linkage between gene pairs, Co-42/Phg-2 on bean chromosome Pv08 and Co-5/“P.ult” on chromosome Pv07. A strong genetic linkage among a pair of molecular markers located less than five centi Morgans (cM) apart on common bean chromosome implies that their two linked genes could be selected with only one marker to reduce genotyping costs.
The results show incomplete genetic linkage between gene pairs, Co-42/Phg-2 and Co-5/“P.ult” on common bean chromosomes Pv08 and Pv07, respectively.The recombination fraction summarized in Table 3 are indicators of the degree of linkage and was higher in BC3F6 than F2 populations for gene pairs, Co-42/Phg-2 (47cM vs 44 cM) and Co-5/“P.ult” (32 cM vs. 21 cM). This difference was attributed to the two generation studied with significant differences in levels of genetic variations.
As reported under population development under the materials and methods, the F2 populations derived their parents from from progenies of the BC3F6 population with single genes targerted. At BC3F6 the bean populations had possibly accumulated more recombinations than in F2s. Secondly, the progeny lines in BC3F6 genotyped were derived from a four way cross comprising four parents used to develop the genetic pyramids (Figure 2) with a high genetic diversity and population structure (Okii et al., 2017).
The hypothesis that physically linked genes for bean diseases, for example anthracnose (Co-42) and angular leaf spot resistance (Phg-2) located on bean chromosome Pv08 co-segregate in bean populations due to genetic linkages was tested in this study. However, the weak genetic linkage between marker pairs studied shows that each of the four genes mentioned earlier have to be tagged with a corresponding linked markers during MAS. The study aimed to suggest strategies for reducing population size during gene pyramiding by finding a single marker locus (position of the chromosome) between genes or markers for simultaneous selection of resistance genes on the same bean chromosome(s), with linkages in coupling (Staub et al., 1996). Theoretical investigations that probe the potential of MAS are, however, of practical importance (Staub et al., 1996).
In other studies on common bean, maximum linkage with no recombinants (0.0 cM) was reported for gene pairs, Co-14 and Phg-1 for anthracnose and angular leaf spot diseases in bean cultivar AND277 (Gonçalves-Vidigal et al., 2011) and suggested overlap or very tight linkage of Co-14 and Phg-1 loci in the bean genome. The large genetic separation of SCAR markers SBB14 for Co-42 and SN02 for Phg-2 corroborates their physical positions in the Andean bean reference cultivar G19833 (Schmutz et al., 2014), with SBB14 situated at 2,758,731 base pairs (Burt et al., 2015) and SN02 at 58,535,517-58,536,216 on Pv08 (http://phaseolusgenes.bioinformatics.ucdavis.edu/).
To define whether two markers are in linkage is to test whether the recombination fraction between these two markers is less than 0.5 (Balding et al., 2007). This hypothesis testing problem can be carried out using the likelihood ratio test Ott et al, 2015; Balding et al., 2007). Similarly, Sun et al. (2012) proposed recombination frequencies of 15 cM as the threshold for strong linkages among loci, while LOD scores above 3 indicate strong genetic linkages (Ott et al., 2015). The threshold genetic distance of 5 cM was recommended as strong indicator of linkage between molecular markers and resistance genes during MAS (Collard and Mackill, 2008).
Therefore, the approaches used in this study contributed to two loci linkage mapping techniques in segregating plant populations through genotyping with markers. However, in situations where computer programs are used to integrate phenotypic and genotypic data sets, estimated LOD scores and likelihood values provide a threshold value for testing genetic linkage (Churchill and Doerge, 1994).
Key statistical methods used in the study are reported by Geffroy et al., (2008) to show possible ways of reducing the number of laboratory samples screened with markers to reduce genotyping costs while still improving the efficiency of MAS for traits influenced by few genes such as diseases in common bean. The results should complement other useful genetic maps developed earlier for improving common bean for combining resistance to several diseases and quantitative trait loci (QTL) of economic importance (Kelly et al., 2003).
This study was based on dominant SCAR markers, which cannot differentiate homozygotes progenies from heterozygotes, we therefore recommend use of co- dominant markers to estimate linkage among gene pairs; Co-42/Phg-2, Co-5/“P.ult” in early generations such as F2s and F3s using a moderate population size (of 50 individuals) proposed by Sun et al., (2012). The following are other recommendations: 1) sequencing SCAR markers which are strongly linked to targeted resistance genes in parental cultivars, then annotate chromosomal regions flanking the markers to find alternative markers and potential candidate genes; 2) Phenotyping the bean populations with pathogens in addition to genotyping and establish the correlations; and 3) Reciprocal crosses can be used to test the effect of maternal effects on linkage estimates among gene pairs or markers.
There was weak linkage among gene pair, Co-42/Phg-2 on bean chromosome eight. The linkage was however relatively stronger among gene pair, Co-5/“P.ult”. There was difference in the value of recombination fraction between the BC3F6 and F2 population. This implies that selection for each of the resistance genes, Co-42, Phg-2, Co-5 and “P.ult” requires to be selected with their own SCAR marker due to lack of strong genetic linkages among these genes during marker assisted gene pyramiding targerting all the four genes in the same background.
This research was funded by African Development Bank (AfDB) - Higher Education, Science and Technology (HEST) project through CIAT, Uganda. The National Agricultural Research Laboratories/NARO, Kawanda and Kirkhouse Trust (UK) made significant support to this work and are acknowledged. The authors appreciate assistance from research assistants at CIAT, Uganda.
The authors have not declared any conflict of interests.
REFERENCES
|
Bailey-Wilson JE, Wilson AF (2011). Linkage analysis in the next-generation sequencing era. Human Heredity 72(4): 228-236.
Crossref
|
|
|
|
Balding DJ, Bishop M, Cannings C (2007). Third Edition. Handbook of Statistical Genetics. John Wiley & Sons, Ltd, West Sussex, England. 1-1390.
Crossref
|
|
|
|
|
Burt AJ, William HM, Perry G, Khanal R, Pauls KP, Kelly JD, Navabi A (2015). Candidate gene identification with SNP marker-based fine mapping of anthracnose resistance gene Co-4 in common bean. PLoS One 10(10):e0139450.
Crossref
|
|
|
|
|
Chilagane LA, Tryphone GM, Protas D, Kweka E, Kusolwa PM, Nchimbi-Msolla M (2013). Incorporation of resistance to angular leaf spot and bean common mosaic necrosis virus diseases into adapted common bean (Phaseolus vulgaris L.) genotype in Tanzania. African Journal of Biotechnology 12(27):4343-4350.
Crossref
|
|
|
|
|
Churchill G, Doerge R (1994). Empirical threshold values for quantitative trait mapping. Genetics 138(3):963-971.
|
|
|
|
|
Coop G, Przeworski M (2007). An evolutionary view of human recombination. Nature Reviews Genetics 8(1):23-34.
Crossref
|
|
|
|
|
Collard BCY, Mackill DJ (2008). Marker-assisted selection: an approach for precision plant breeding in the twenty-first century. Philosophical Transactions of the Royal Society B: Biological Sciences 363(1491):557-572.
Crossref
|
|
|
|
|
Edwards AWF (1972). Likelihood. Cambridge University Press.
|
|
|
|
|
Gao F, Ming C, Hu W, Li H (2016). New software for the fast estimation of population recombination rates (FastEPRR) in the genomic era. Genetics 6(6):1563-1571.
Crossref
|
|
|
|
|
Geffroy V, Sévignac M, Billant P, Dron M, Langin T (2008). Resistance to Colletotrichum lindemuthianum in Phaseolus vulgaris: A case study for mapping two independent genes. Theoretical and Applied Genetics 116(3):407-415.
Crossref
|
|
|
|
|
Gonçalves-Vidigal MC, Cruz AS, Garcia A, Kami J, Vidigal-Filho PS, Sousa LL, McClean P, Gepts P, Pastor-Corrales MA (2011). Linkage mapping of the Phg-1 and Co-14 genes for resistance to angular leaf spot and anthracnose in the common bean cultivar AND 277. Theoretical and Applied Genetics 122(5):893-903.
Crossref
|
|
|
|
|
Kaplan N, Hudson RR (1985). The use of sample genealogies for studying a selectively neutral m-loci model with recombination. Theoretical Population Biology 28(3):382-396.
Crossref
|
|
|
|
|
Kelly JD, Gepts P, Miklas PN, Coyne DP (2003). Tagging and mapping of genes and QTL and molecular-marker assisted selection for traits of economic importance in bean and cowpea. Field Crops Research 82(2-3):135-154.
Crossref
|
|
|
|
|
Mahuku GS (2004). A simple extraction method suitable for PCR-based analysis of plant, fungal, and bacterial DNA. Plant Molecular Biology Reporter 22(1):71-81.
Crossref
|
|
|
|
|
Mahuku G, Navia M, Buruchara R, Matta A, Otsyula R (2007). Development of PCR markers tightly linked to Pyult1, a gene that confers Pythium root rot resistance in the common bean genotype AND 1062. Abstract. Annual Meeting, July 28-August 1. San Diego, California. American Phytopathological Society.
|
|
|
|
|
Mahuku GS, Henriquez MA, Montoya C, Jara C, Teran H, Beebe S (2011). Inheritance and development of molecular markers linked to angular leaf spot resistance genes in the common bean accession G10909. Molecular Breeding 28(1):57-71.
Crossref
|
|
|
|
|
Malav AK, Indu, Chandrawat KS (2016). Gene pyramiding: An overview. International Journal of Current Research in Biosciences and Plant Biology 3(1):22-28.
Crossref
|
|
|
|
|
Miller T, Gepts P, Kimmo S, Arunga E, Chilagane LA, Nchimbi-Msolla S, Namusoke A, Namayanja A, Tedla YR (2018). Alternative markers linked to the Phg-2 angular leaf spot resistance locus in common bean using the Phaseolus genes marker database. African Journal of Biotechnology 17(26):818-828.
Crossref
|
|
|
|
|
Oblessuc PR, Perseguini J, Baroni RM, Chiorato AF, Carbonell SAM, Mondego JMC, Vidal RO, Camargo LEA, Benchimol-Reis LL (2013). Increasing the density of markers around a major QTL controlling resistance to angular leaf spot in common bean. Theoretical and Applied Genetics 126(10):2451-2465.
Crossref
|
|
|
|
|
Okii D, Mukankusi C, Sebuliba S, Tukamuhabwa P, Tusiime G, Talwana H, Odong T, Namayanja A, Paparu P, Nkalubo S, Otim M, Ugen M, Buah S, Gepts P (2017). Genetic variation, heritability estimates and GXE effects on yield traits of Mesoamerican common bean (Phaseolus vulgaris L) germplasm in Uganda. Plant Genetic Resources 16(3):237-248.
Crossref
|
|
|
|
|
Ott J, Wang J, Leal SM (2015). Genetic linkage analysis in the age of whole-genome sequencing. Nature Reviews Genetics 16(5):275-284.
Crossref
|
|
|
|
|
Pathania A, Sharma SK, Sharma PN (2014). Common bean. In: Singh et al. (eds.), Broadening the Genetic Base of Grain Legumes. Springer, India pp. 11-50.
Crossref
|
|
|
|
|
Perseguini JMKC, Oblessuc PR, Rosa JRBF, Gomes KA, Chiorato AF, Carbonell SAM (2016). Genome-wide association studies of anthracnose and angular leaf spot resistance in common bean (Phaseolus vulgaris L.). PLoS One 11(3):e0150506.
Crossref
|
|
|
|
|
Schmutz J, McClean PE, Mamidi S, Wu GA, Cannon SB, Grimwood J (2014). A reference genome for common bean and genome-wide analysis of dual domestications. Nature Genetics 46(7):707-713.
|
|
|
|
|
Schwartz HF, Galvez GE (1980). Eds. Bean Production Problems: Diseases, Insect, Soil and Climatic constraits of phaseolus vulgaris. CIAT, Cali, Colombia.
|
|
|
|
|
Staub EJ, Serquen FC, Gupta M (1996). Genetic markers, map construction, and their application in plant breeding. Horticultural Science 31(5):729-739.
Crossref
|
|
|
|
|
Strachan T, Read AP (2011). Human Molecular Genetics. 4th edition. Garland Science, Taylor and Francis Group, New York.
|
|
|
|
|
Sun Z, Li H, Zhang L (2012). Estimation of recombination frequency in bi-parental genetic populations. Genetics Research 94(3):163-177.
Crossref
|
|
|
|
|
Toomet O, Henningsen A (2009). maxLik: Tools for Maximum Likelihood Estimation. R. package version 0.5. http://CRAN.R-project.org.
|
|
|
|
|
Young RA, Kelly JD (1996). Characterization of the genetic resistance to Colletotrichum lindemuthianum in common bean differential cultivars. Plant Disease 80(6):650-654.
Crossref
|
|