Full Length Research Paper

ABSTRACT
Breeding for resistance to flower bud thrips (Megalurothrips sjostedti) in cowpea has been hindered by the quantitative nature of resistance. To identify simple sequence repeat (SSR) markers associated with resistance to flower bud thrips that could be used for marker-assisted breeding, a F2 population was generated from a cross between genotypes TVU-123 (resistant) and WC36 (susceptible). The population was evaluated for thrips damage scores, thrips counts, and pods number per plant under artificial infestation. Sixty-six microsatellites markers were screened between the two parental lines and seven polymorphic markers were used to genotype 100 F2 plants. Single marker analysis was used to evaluate an association between the markers and traits. Transgressive segregation among the F2 plants for resistance to flower thrips was observed. A significant negative relationship was observed between thrips damage scores and pods number per plant. Markers CP37/38 and CP215/216 were significantly associated with thrips damage scores and thrips counts, respectively. The two markers explained 7 and 11.2% of the total variation in thrips damage scores and thrips counts with positive and negative effects, respectively. Mainly additive gene effects were observed. A more detailed study using more markers on these loci should provide better understanding of this complex trait.
Key words: Cowpea, single marker analysis, polymorphism, simple sequence repeat (SSR) markers.
INTRODUCTION
Cowpea (Vigna unguiculata L. Walp.), is one of the most important vegetable legumes in Africa (Olawale and Bukola, 2016). It is grown principally for its grains, fresh leaves and immature pods which are consumed fresh or
as cooked pods (Dungu et al., 2015). It is an important source of dietary proteins, amino acids, vitamins and minerals for African peoples (Boukar et al., 2016). However, cowpea production is constrained by a complex of insects throughout its life cycle and also during seed storage (Boukar et al., 2016). One of the most devastating of these pests is the cowpea flower bud thrips (Megaluropthrips sjostedti Trybom), which can inflict substantial yield losses, reaching 100% in cases of severe infestation (Sobda et al., 2017). Thrips nymphs and adults damage the plant by feeding on its flowers, resulting in at best, their distortion and discoloration, and at worst, their abortion and consequent yield reduction (Sani and Umar, 2017). The insects are especially difficult to control because of their wide host range and thrips populations build up rapidly and their ability to fly in mass helps them to spread and form colonies in a new population of host plants in a short period (Sani and Umar, 2017). Currently, the most effective control measure available is to apply repeated doses of insecticide, but even this strategy is not fully effective as the ability of some of the insects to escape the spray by sheltering within the flower can drive the rapid development of insecticide resistance (Mohammad et al., 2018).
The majority of resource-poor farmers are in any case unable to afford the purchase of both the necessary chemicals and effective spraying equipment (Mohammad et al., 2018). A more sustainable approach would be to deploy genetic resistance against infestation, which may be feasible, since several cowpea accessions have been shown to suffer only limited damage when infested by thrips. The resistance to flower bud thrips has been reported to be quantitative, thus controlled by several genes (Omo-Ikerodah et al., 2008). Like most economically important traits, resistance to flower thrips in cowpea is controlled by genes located in regions known as quantitative trait loci (QTLs) (Adetumbi et al., 2016). In dealing with quantitative traits, molecular breeding requires the mapping of QTLs associated with the traits under consideration to enable marker-assisted breeding and individual gene cloning (Muhammad et al., 2018). With the help of molecular markers linked to QTL, the heredity of some related complex traits such as thrips resistance could be tracked (Muhammad et al., 2018). The ability of genetic manipulation through QTL analysis is greatly enhanced, thus improving the accuracy and predictability to select genotypes with superior quantitative trait loci (Muhammad et al., 2018). Information generated on QTL associated with resistance to cowpea flower bud thrips would facilitate the development of molecular marker to be used in breeding for thrips resistant cowpea. However, there is limited information on the molecular genetics of thrips resistance.
Few studies reported the detection of QTL for resistance to cowpea thrips, M. sjostedti (Omo-Ikerodah et al., 2008; Sobda et al., 2017) and Frankliniella sp. (Muchero et al., 2010). Muchero et al. (2010) identified three QTL for resistance to foliar thrips (Thrips tabaci and Frankliniella schult Zeiusing) using amplified fragment length polymorphism (AFLP) markers. The QTL were designated Thr-1, Thr-2 and Thr-3, and were identified on linkage groups 5 and 7 on 127 cowpea recombinant inbred population. Huynh et al. (2015) identified one major and one minor QTL conferring aphid resistance on LG7 and LG1, respectively, with both favorable alleles contributed by IT97K-556-6. Omo-Ikerodah et al. (2008) used a cowpea linkage map of AFLP markers to identify QTL for resistance to flower bud thrips (M. sjostedti) using a set of 92 recombinant inbred lines (RILs) derived from a cross between ‘Sanzi’ (resistant) and ‘VITA7’ (susceptible) lines in Nigeria. Five QTL were identified and arranged according to their contributions to resistance of flower bud thrips in descending order as follows: LG3 (E-ACT/M-CAA376), LG2 (E-ACG/M-CTT2), LG6 (E-AAC/M-CTA120), LG7 (EAAC/ M-CAA155) and LG1 (E-AAC/M-CAA255). The QTL were designated FTh1, FTh2, FTh3, FTh4 and FTh5 and the phenotypic variance explained by the QTL were 32.0, 18.4, 12.6, 11.9 and 9.5%, respectively. Sobda et al. (2017) identified three QTL on flower bud thrips using SNP markers on F2 population from Sanzi x VYA. The three QTL for thrips resistance were Fthp28, Fthp87 and Fthp129, detected on chromosomes 2, 4 and 6 and explained 24.5, 12.2 and 6.5% of the total phenotypic variation, respectively. Most of these QTL identified, except for Muchero et al. (2010) and Sobda et al. (2017) were mainly based on dominant markers, AFLP markers. According to Kongjaimun et al. (2012), dominant markers are not suitable for marker-assisted selection and comparative genomics studies. In addition, none of these QTL has been validated for maker-assisted selection. Additional identification of the molecular co-dominant markers associated with resistance genes controlling flower thrips would be extremely beneficial because plant breeders could use such markers during preliminary selection process to track the loci in existing population or to pyramid resistance into new populations. Such information would allow much faster progress in breeding for resistance to flower thrips, mostly with respect to the modern plant breeding methods such as marker-assisted selection (MAS). Therefore, the objective of this study was to identify simple sequence repeat (SSR) markers associated with flower thrips resistance in cowpea, in order to provide the basis for marker-assisted selection.
MATERIALS AND METHODS
Mapping population
The parents used in this study were TVU-123 (resistant parent) (IITA, 1996) and WC36 (susceptible parent) (Agbahoungba et al., 2017). TVU-123 (female parent) and WC36 (male parent) were crossed and F1 seeds were grown in plastic pots to generate 212 F2 seeds.
Testing for resistance to flower bud thrips
The F2 and parents seeds were planted in pots of 21 cm diameter and 25 cm in depth filled with 15 kg sterilized topsoil. Each pot contained a single F2 plant and pots were placed under a cage of 10 m length, 3 m width and 2 m height at Makerere University Agricultural Research Institute of Kabanyolo. Flowers containing flower bud thrips were collected from a susceptible cultivar (WC36) planted in the field and introduced into the screen house 20 days after sowing by dropping 30 flowers in each pot (Omo-Ikerodah et al., 2008; Sobda et al., 2017). Subsequently, flowers loaded with flower bud thrips were introduced into the cage on a daily basis for 15 days until a high population of the insects was achieved. Plants were scored for thrips damage 30 days after planting and at weekly intervals for four weeks. Thrips damage was scored using a 1-9 scale (Jackai and Singh 1988), where 1 = highly resistant and 9 = highly susceptible. The number of nymphs and adults thrips per flower was also recorded 30 days after planting and at weekly intervals for four weeks. The number of pods per plant was recorded once at podding stage.
DNA extraction, purification and quantification
Newly expanded leaves from 2 to 3 weeks old seedlings were collected from 100 F2 progeny and the parents. The 100 plants were representative of the 212 F2 plants as they were selected based on the phenotypic distribution pattern (highly resistant, moderately resistant, susceptible and highly susceptible) of the F2 population to run a cost effective DNA extraction and F2 genotyping. Total genomic DNA was isolated using cetyl trimethyl ammonium bromide (CTAB) extraction method (Lodhi et al., 1994) and purified using the AccuPrep® PCR purification Kit protocol (Cat.No.K-3034, K.3034-1; www.bioneer.com). DNA concentration was determined at 260 nm using a bio-spectrometer (Nanodrop).
Microsatellite analysis
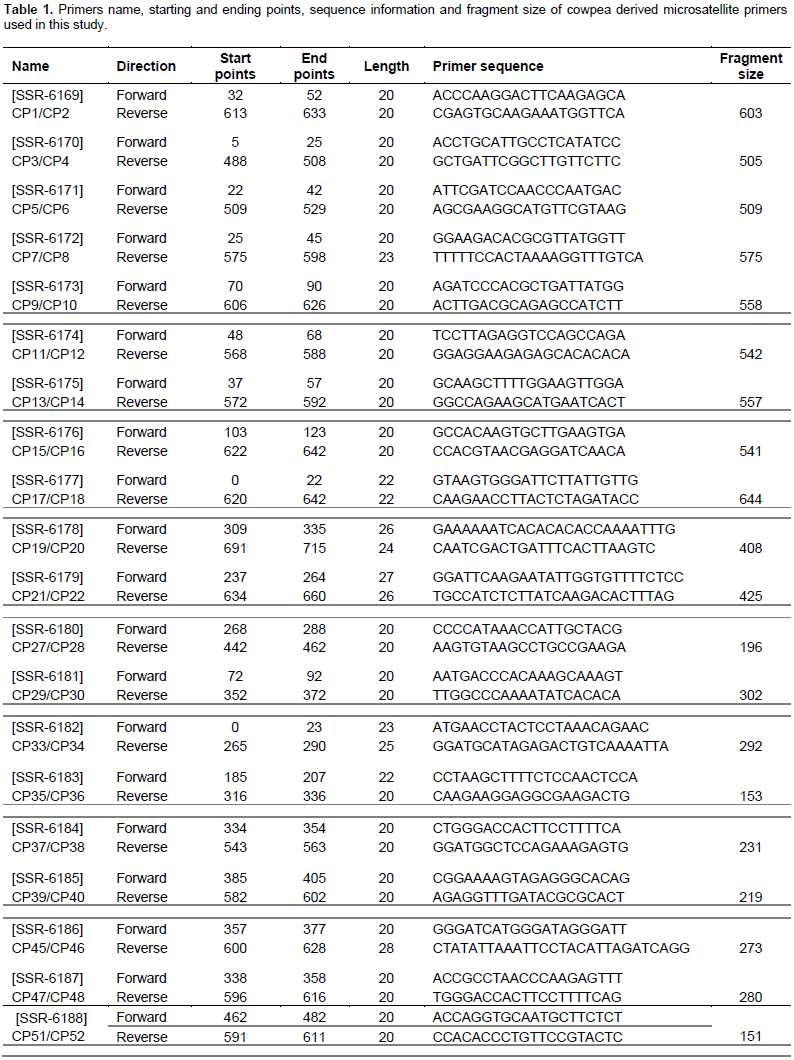
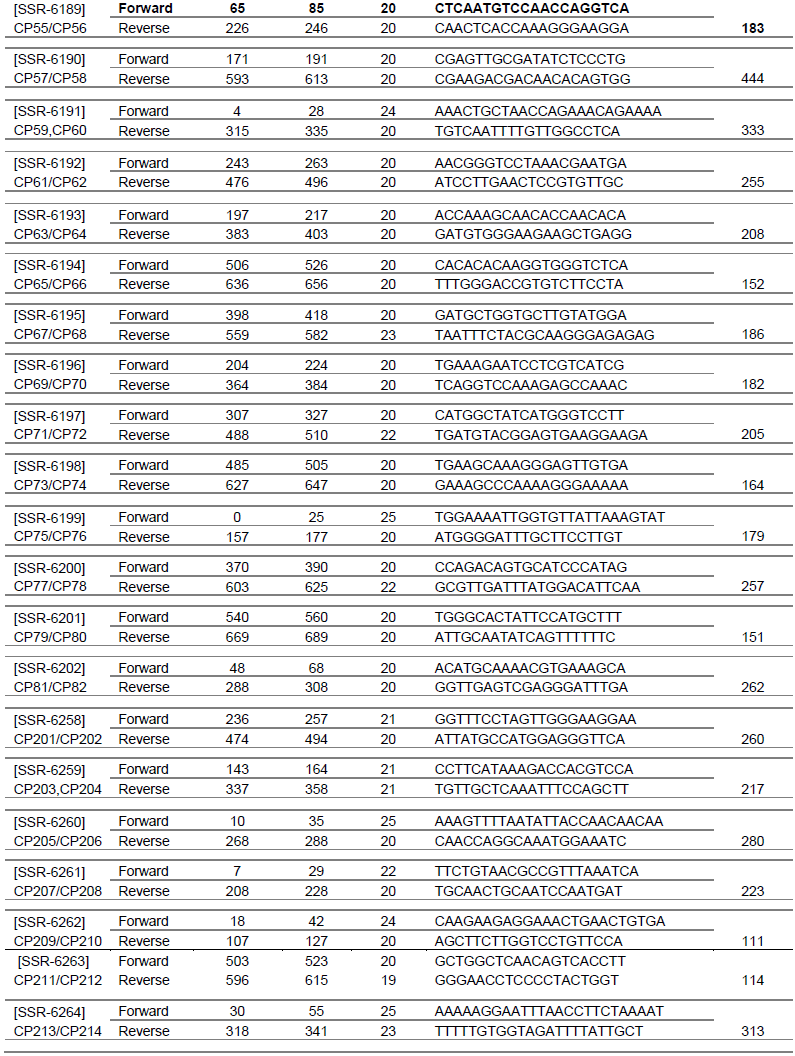
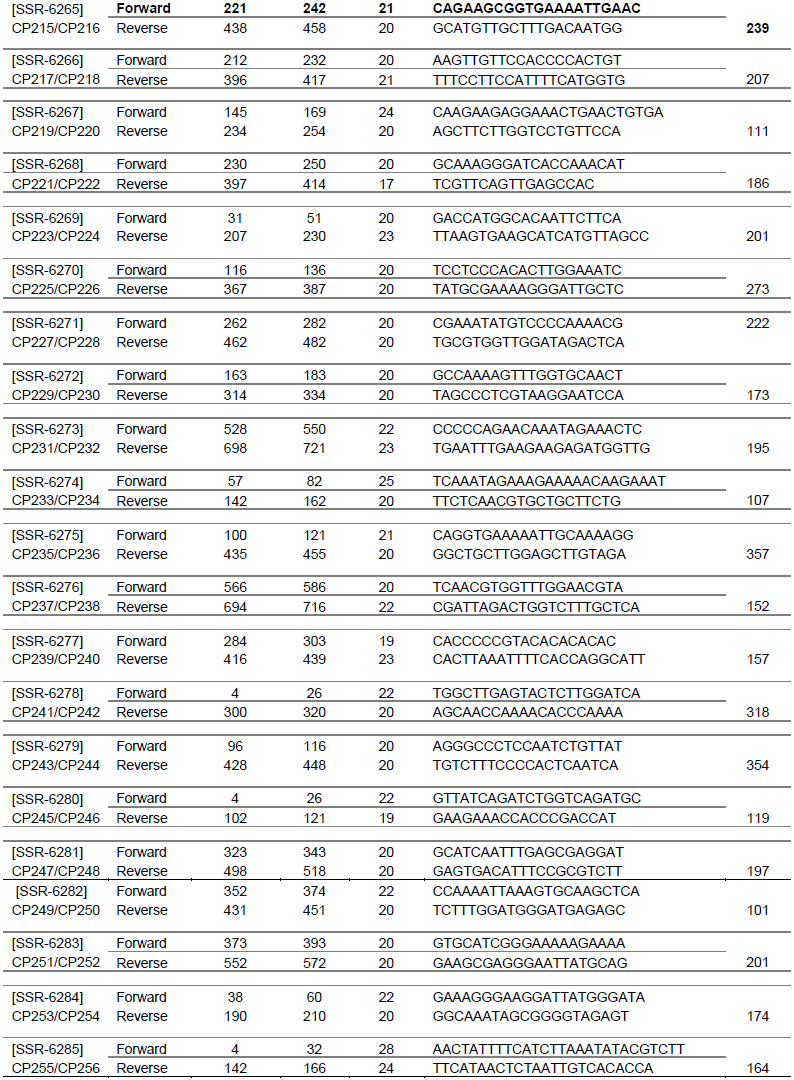
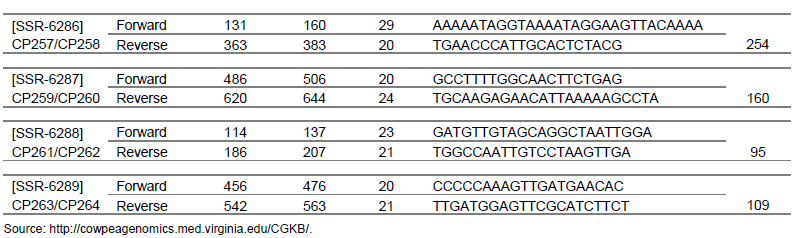
Sixty-six SSR markers were selected from the cowpea SSR database (http://cowpeagenomics.med.virginia.edu/CGKB/). Sequences were synthesized at the Biosciences Laboratory, Bioneer (South Korea). The primers names, sequences, length and the fragment size are presented in Table 1. The SSR markers were randomly selected from the cowpea database since none of these markers has been associated with any insect pest yet.
PCR amplifications were conducted in a 10 µl reaction volume containing 5 μl premix (PCR mater mix containing 100 mM dNTPs, 0.1 taq polymerase), 0.70 μl of primers (0.35 μl of forward primer and 0.35 μl reverse primer) and 1 μl genomic DNA (20 ng), and diluted with 3.3 μl of water (Cat.No.K-3034, K.3034-1; www.bioneer.com). Amplifications were performed in an Eppendorf Mastercycler (Techne TC-512) with an initial denaturation at 95°C for 5 min followed by 35 cycles of denaturation for 30 s, annealing at 55°C for 30 s, extension at 72°C for 30 s and a final extension at 72°C for 10 min. Amplification products were resolved for 2 h at 130 V on 2.5% (w/v) agarose gel in 1 × TAE buffer using a gel electrophoresis apparatus (Model V16.2 Gibco BRL, Gaithersburg, MD, USA). Gels were stained with ethidium bromide and visualized using a UV transilluminator (M-15 UVP Upland, CA 91786 USA) and photo-documented with a digital camera. DNA fragment sizes were determined based on a 100 bp DNA standard ladder (Bioneer C&D Center, South Korea).
SSR markers were initially screened for polymorphism between the parental genotypes TVU-123 and WC36. Markers that showed clear polymorphic bands were selected to analyze the F2 population. Each amplified loci was considered as a unit character and was scored as “0”, “1” and “2” where, “0” corresponded to amplified loci in WC36, “2” in TVU-123 and “1” when the amplified loci of both parents are present.
Statistical analysis
The distribution histograms of the phenotypic data (thrips damage scores and thrips counts) were generated on the whole population generated from the cross, TVU-123 x WC36. The relationship between thrips damage scores and number of pods per plant was established using Genstast software (Payne et al., 2009). Chi-squared (χ2) tests were performed to examine the goodness of-fit between the expected Mendelian ratio for the F2 populations (1:2:1 for the SSR markers based on 100 plants). Single-marker analysis (single-point analyses) was employed to determine markers associated with the phenotypic data using GenStat 12 version software (Payne et al., 2009). Chi-square independence test was used on the thrips damage score because the scores collected were grouped into resistant and susceptible classes. Analysis of variance (ANOVA) was performed on the markers scores for the thrips counts. The ANOVA assumptions have been verified before analyzing the data. Linear regression was also performed to estimate the phenotypic variation arising from the QTL linked to the marker. All phenotype analyses were however performed on untransformed data. Normalizing data through transformation may misrepresent differences among individuals by pulling skewed tails towards the center of the distribution (Omo-Ikerodah et al., 2008).
Recombination frequency between two marker loci ( ) and the estimation of maximum likelihood (LOD) of the recombination frequency was computed using the procedure described by Xu (2013):
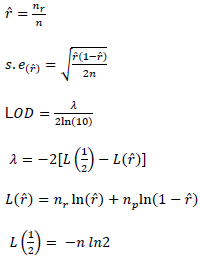
Where, ![]() is the estimate of the recombination frequency between two loci,
is the estimate of the recombination frequency between two loci,  is the number of recombinants,
  is the number of parental gametes and n is the total number of individuals.
In linkage analysis, a LOD score of 3 or larger is generally taken as evidence of linkage, whereas a LOD score smaller than 3 is not considered as a proof of linkage (Xu, 2013).
RESULTS
Distribution of thrips damage scores, thrips counts and pods numbers for the F2 population
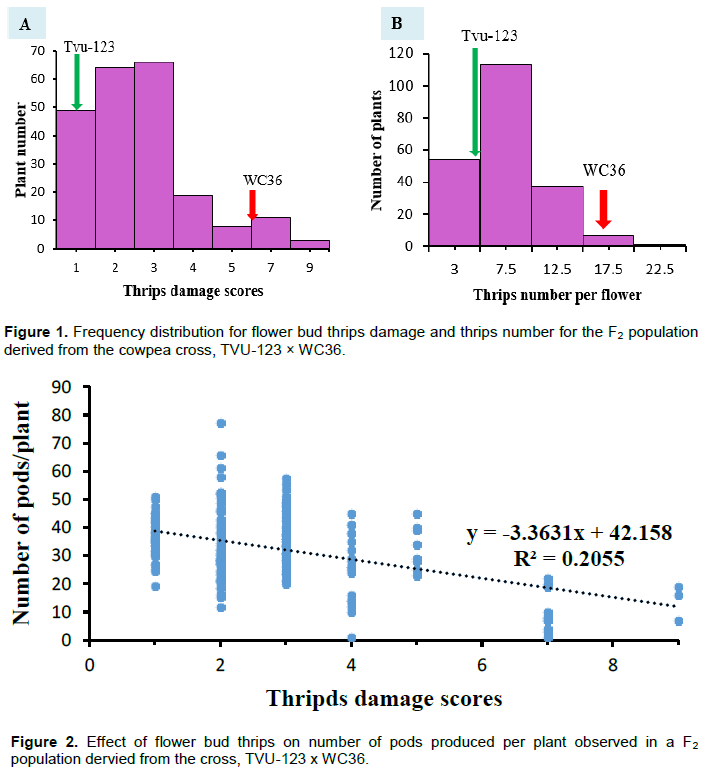
The F2 population displayed a continuous distribution for flower thrips damage scores and thrips counts (Figure 1A and B). The distributions of the thrips damage scores and thrips counts in flower for the 212 F2 plants were significantly different from normal (W statistic = 0.81 and 0.95, P<0.001, respectively). Damage scores and thrips counts for the population tended to be skewed towards the resistant category.
The regression of the flower thrips damage scores and the number of pods produced per plant showed relatively negative relationship, R2 = 0.21 (P<0.001) with plants having higher damage scores producing fewer pods (Figure 2).
SSR markers screening and segregation distortion
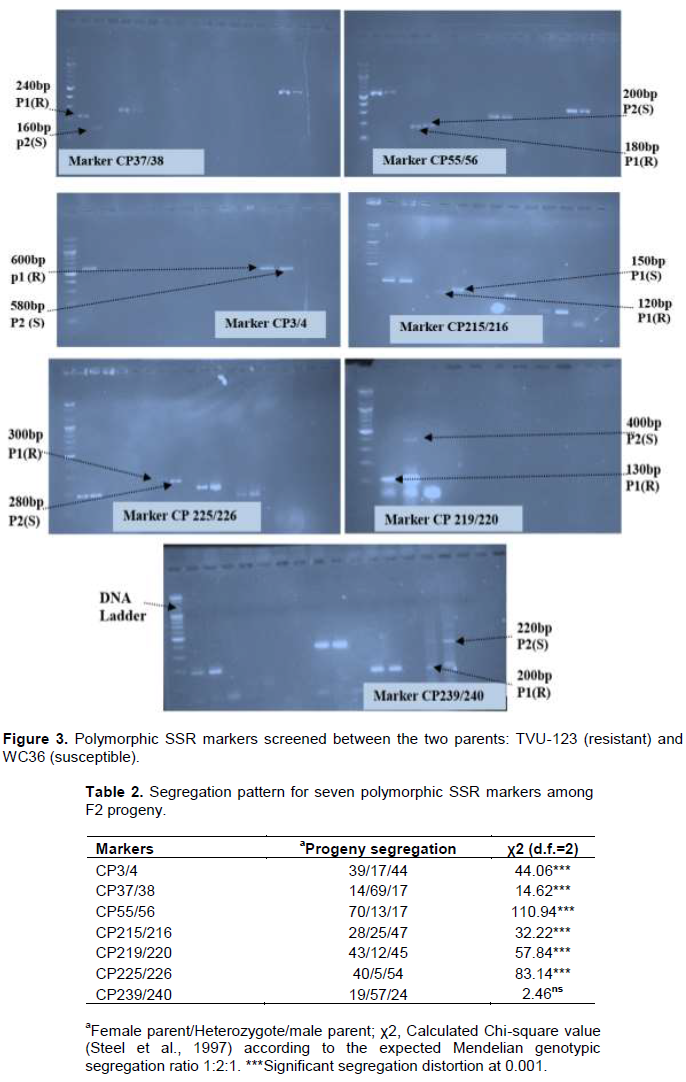
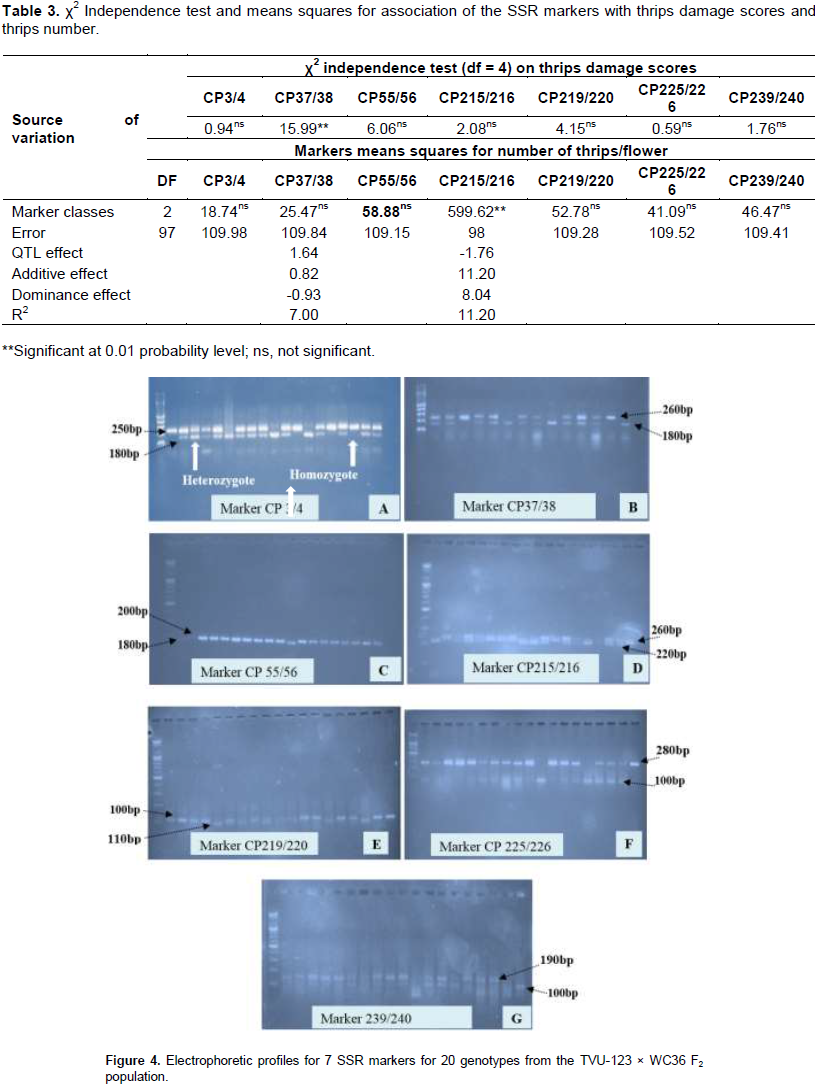
Seven SSR markers: CP3/4, CP37/38, CP55/56, CP215/216, CP219/220, CP225/226 and CP239/240, were polymorphic between the two parents (Figure 3). The distribution of different genotypes among the F2 populations showed that except for the SSR marker CP37/38 that showed an excess of the heterozygote genotypes, the other markers showed an excess of the homozygote genotypes for flower thrips resistance alleles among the F2 population (Table 2). The Chi-square analysis showed significant segregation distortion (Table 3) for the SSR markers, except maker CP239/240 that conformed to the 1:2:1 segregation ratio. The electrophoretic profiles for the population are presented in Figure 4.
Marker association analysis with thrips damage score and thrips counts
Maker-traits association data are presented in Table 3. SSR marker CP 37/38 was significantly (χ2 =11.40, P<0.01) associated with thrips damage scores while the results of the analysis of variance on thrips counts showed that the marker, CP215/216 was significantly (P<0.01) associated. The recombination frequency between two marker loci was 0.34 ± 0.033 with a LOD score of 4.07.
DISCUSSION
Host plant resistance is one of the most important strategies for crop improvement (Omo-Ikerodah et al., 2008). Insect resistance genes have been introduced into several crop varieties and its importance is increasing as insecticides lose efficacy due to pest adaptation or are removed from use to protect the environment and human health (Omo-Ikerodah et al., 2008). In many cases, multiple genes are required for sustained resistance to counter pest adaptation. Thus, maintaining agricultural productivity to meet world food needs depends on access of agricultural scientists, to many sources of host plant resistance genes. Only low levels of resistance to flower bud thrips exist in different cowpea lines and there is need to bring these genes together in a line with good agronomic performance. In this study, the continuous and skewed distribution towards the resistant parent for flower thrips damage scores and thrips counts indicated that resistance of cowpea to flower bud thrips was polygenic and suggested dominance over susceptible parent. Omo-Ikerodah et al. (2008) reported that more than two genes probably control the resistance to flower bud thrips. Similar segregating pattern was reported by Sobda et al. (2017) for the F2 population developed from the genotypes Sanzi and VYA evaluated in Cameroon. In this study, lower damage ratings than the resistant parent was observed for approximately 49 plants from the population suggesting transgressive segregation for resistance. Similar results were reported by Omo-Ikerodah et al. (2008) on Sanzi and VITA 7 in Nigeria. Transgressive segregation for resistance to flower thrips has important breeding implications because it is possible to obtain plants with resistance levels higher than those of the parental lines (Omo-Ikerodah et al., 2008; Muchero et al., 2009a). The level of polymorphism between the two parents as revealed by the cowpea derived microsatellite primers used in this study was low as only 7 of 66 primers showed polymorphic bands (10.61%). Twelve percent polymorphism for SSR primers was reported in cowpea by Diouf and Hilu (2005). Low (4%) level of microsatellite polymorphism in cowpea has been reported in earlier findings (Li et al., 2001; Diouf and Hilu, 2005; Omo-Ikerodah et al., 2008; Uma et al., 2009). The low level of microsatellite polymorphism was attributed to relatively low genetic diversity of cowpea as compared to other crops.
Markers showed significant segregation distortion for the F2 population. Segregation distortion is common phenomenon observed in wide intraspecific crosses of many plants (Song et al., 2006; Kongjaimum et al., 2012). In Vigna species, distorted segregation of markers has been reported in genetic maps of cowpea (Xu et al., 2010, 2011).
In this study, the markers CP 37/38 and CP215/216 were identified to be significantly associated with thrips damage score and thrips counts, respectively. These markers explained 7 and 11.2% of the total phenotypic variance in thrips damage scores and thrips counts, respectively, indicating that the markers identified are still far from the genes controlling the resistance to flower thrips. The markers effects observed were low as compared to 77.5 and 43.2% observed by Omo-Ikerodah et al. (2008) and Sobda et al. (2017) in Nigeria and Cameroon, respectively, indicating that the resistance of cowpea to flower thrips is controlled by several genes and the identified markers, were not able to cover most of these genes. Molecular markers with positive as well as negative effects were detected in this study. The positive effects suggested resistance-enhancing QTL originating from the resistance parent TVU-123 and indicated that the alleles at these loci contributed to increase in the resistance genes. The negative effects suggested resistance-reducing QTL originating from the susceptible parent WC36. Allele at this QTL contributed to increase in the susceptibility, suggesting selection against QTL when breeding cowpea for resistance to flower bud thrips. Similar QTLs with effects contrary to the overall effect of the parents have been reported by Omo-Ikerodah et al. (2008), Sobda et al. (2017) on flower thrips and Muchero et al. (2010) on foliar thrips in cowpea. The QTLs detected in this study have mainly additive gene effects. They can therefore, be used for breeding purposes (Acquaah, 2012).
The recombination frequency estimated indicated that the two markers loci are linked (Collard et al., 2005). Close association of these markers with the phenotypic data could facilitate the introgression of this QTL block as a single unit by targeting low recombination rates in breeding progenies (Muchero et al., 2010). This provides opportunity for development of molecular markers for use in marker-assisted selection for resistance against flower thrips. The SSR markers, CP 37/38 and CP215/216 that co-located with thrips damage scores and thrips counts in flower, respectively, are potential candidates for use in developing molecular markers.
CONCLUSION
The SSR marker, CP37/38, was associated with thrips damage while CP215/216 was associated with thrips counts in flower. The two markers explained 7 and 11.2% of the total variation observed in thrips damage and counts, respectively. The QTLs detected in this study have mainly additive gene effects with positive effect for CP37/38 marker and negative effects for CP215/216 marker. Further research focusing on possible QTL with more SSR markers using recombinant inbreed lines and more integrative approaches to establish position and order of putative QTLs should provide better understanding of this complex trait.
CONFLICT OF INTERESTS
The authors have not declared any conflict of interests.
REFERENCES
|
Acquaah G (2012). Principles of Plant Genetics and Breeding, Second Edition. John Wiley & Sons, Ltd. Published 2012 by John Wiley & Sons, Ltd., P 740. |
|
|
Adetumbi JA, Akinyosoye ST, Olowolafe MO, Oloyede-Kamiyo QO, Agbeleye OA (2016). Genetic linkage map of cowpea (Vigna unguiculata (L.) Walp) using SNP markers. African Journal of Biotechnology 15(20):830-834. |
|
|
Agbahoungba S, Karungi J, Odong TL, Badji A, Sadik K, Rubaihayo PR (2017). Stability and extent of resistance of cowpea lines to Megalurothrips sjostedti Trybom (Thysanoptera: Thripidae) in Uganda. African Crop Science Journal 25(1):1-24. |
|
|
Boukar O, Fatokun CA, LamHuynh B, Roberts PA, Close TJ (2016). Genomic tools in cowpea breeding programs: Status and perspectives. Frontiers in plant science 7:757. |
|
|
Collard BCY, Jahufer MZZ, Brouwer JB, Pang ECK (2005). An introduction to markers, quantitative trait loci (QTL) mapping and marker-assisted selection for crop improvement: The basic concepts. Euphytica 142:169-196. |
|
|
Diouf D, Hilu WK (2005). Microsatellites and RAPD markers to study genetic relationships among cowpea breeding lines and local varieties in Senegal. Genetic Resources and Crop Evolution 52:1057-1067. |
|
|
Dungu SP, Ekere W, Bisikwa J, Kawooya R, Kalule O, Biruma M (2015). Marketing and Market Integration of Cowpea in Uganda. Journal of Development and Agricultural Economics 7:1-11. |
|
|
Huynh BL, Ehlers JD, Ndeye NN, Wanamaker S, Lucas, MR, Close TJ, et al. (2015). Genetic mapping and legume synteny of aphid resistance in African cowpea (Vigna unguiculata L. Walp.) grown in California. Molecular breeding 35:36. |
|
|
International Institute of Tropical Agriculture (IITA) (1996). Research highlights. International Institute of Tropical Agriculture, Ibadan. 5(3):23-24. View. |
|
|
Jackai LEN, Singh SR (1988). Screening techniques for host plant resistance to insect pests of cowpea. Tropical Grain Legume Bulletin 35:2-18. |
|
|
Kongjaimum A, Kaga A, Tomooka N, Somta P, Shimizu T, Shu Y, Isemura T, Vaughan DA, Srinives P (2012). An SSR-based map of yardlong bean (Vigna unguiculata (L.) Walp. subsp. Unguiculata sesquipedalis Group) and QTL analysis of pod length. Genome 55:81-92. |
|
|
Li CD, Fatokun CA, Ubi B, Singh BB, Scoles GJ (2001). Determining genetic similarities and relationships among cowpea breeding lines and cultivars by microsatellites markers. Crop Science 41:189-197. |
|
|
Lodhi MA, Ye GN, Weeden NF, Reisch BI (1994). A simple and efficient method for DNA extraction from grapevine cultivars and Vitis species. Plant Molecular Biology Reporter 12(1):6-13. |
|
|
Mohammad SS, Gholamhossein A, Christos AD, Rohollah R (2018). Farmers' Criteria for Pesticide Selection and Use in the Pest Control Process. Agriculture 8(24):2-16. |
|
|
Muchero W, Diop NN, Bhat PR, Fenton RD, Wanamaker S, Pottorff M, Hearne S, Cisse N, Fatokun C, Ehlers JD, Roberts PA, Close TJ (2009a). A consensus genetic map of cowpea [Vigna unguiculata (L) Walp.] and synteny based on EST-derived SNPs. Proceedings of the national academy of sciences 106 (43):18159-18164. |
|
|
Muchero W, Wellington Jeffrey, Ehlers D, Roberts PA (2010). QTL analysis for resistance to foliar damage caused by Thrips tabaci and Frankliniella schultzei (Thysanoptera: Thripidae) feeding in cowpea [Vigna unguiculata (L.) Walp]. Molecular breeding 25:47-56. |
|
|
Muhammad AN, Muhammad AN, Muhammad Q, Yıldız D, Gonul C, Mehtap Y, RüÅŸtü H, Fiaz A, Ahmad A, Nitin L, Hakan Ö, Gyuhwa C, Faheem SB (2018). DNA molecular markers in plant breeding: current status and recent advancements in genomic selection and genome editing. Biotechnology and Biotechnological Equipment 32 (2):261-285. |
|
|
Olawale MA, Bukola OM (2016). Phenotypic analysis of seed yield and yield components in cowpea (Vigna unguiculata L., Walp). Plant Breeding and Biotechnology 4:252-261. |
|
|
Omo-Ikerodah EE, Fawole I, Fatokun C (2008). Genetic mapping of quantitative trait loci (QTLs) with effects on resistance to flower bud thrips (Megalurothrips sjostedti) in recombinant inbred lines of cowpea [Vigna unguiculata (L.)Walp.]. African Journal of Biotechnology 7:263-270. |
|
|
Payne RW (2009). The Guide to Genstat: Release 12, Part 2, Statistics. Lawes Agricultural Trust, Rothamsted, Experimental Station, Harpenden, Herts, UK. |
|
|
Sani I, Umar KM (2016). Biology and Management of Legume Flower Thrips (Megalurothrips sjostedti) (Thysanoptera: Thripidae), a major insect pest of cowpea: A Review. Annals of Experimental Biology 5 (1):14-17. |
|
|
Sobda G, Boukar O, Tongoona PB, Ayertey J, Offei KS (2017). Quantitative trait loci (QTL) for cowpea resistance to flower bud thrips (Megalurothrips sjostedti Trybom). International Journal of Plant Breeding and Genetics 4(6):292-299. |
|
|
Song XL, Sun XZ, Zhang TZ (2006). Segregation distortion and its effect on genetic mapping in plants. Chinese Journal of Agricultural Biotechnology 3(3):163-169. |
|
|
Steel RGD, Torrie JH, Dickey DA (1997). Principles and Procedures of Statistics: A Biometrical Approach. 3rd Ed. New York, NY, USA. McGraw-Hill. |
|
|
Uma MS, Hittalmani S, Keshavamurthy BC, Viswanatha KP (2009). Microsatellite DNA marker aided diversity analysis in cowpea [Vigna unguiculata (L.) Walp.]. Indian Journal of Genetics and Plant Breeding 69:35-43. |
|
|
Xu P, Wu X, Wang B, Liu Y, Ehlers JD, Close TJ, Roberts PA, Diop NN, Qin D, Hu T, Lu Z, Li G (2011). A SNP and SSR based genetic map of asparagus bean (Vigna. Unguiculata ssp. Sesquipedalis) and comparison with the broader species. PloS ONE 6 (1):el5952. |
|
|
Xu P, Wu X, Wang B, Liu Y, Qin D, Ehlers JD, Close TJ, Hu T, Lu Z, Li G (2010). Development and polymorphism of Vigna unguiculata ssp. Unguculata microsatellite markers used for polygenetic analysis in asparagus bean (Vigna unguiculata ssp. Sesquipedalis (L.) Verdc). Molecular breeding 25(4):675-684. |
|
|
Xu S (2013). Principles of Statistical Genomics. Chapter 2: Recombination Fraction. Spring. Sci. Busin. Med. LLC 2013. |
|
Copyright © 2024 Author(s) retain the copyright of this article.
This article is published under the terms of the Creative Commons Attribution License 4.0


