ABSTRACT
Wheat is the most important cereal crop in Ethiopia ranking third in terms of area after teff and maize and second in terms of production after maize. Six local wheat varieties cultivated in South Gondar, one of the 11 zones found in Amhara region, were collected from the local farmers to study their variability, heritability and trait associations using 12 agro-morphological traits. The studied genotypes were grown in main rain season of 2014/2015 at Farta district in a complete randomized block design with three replications. Analysis of variance (ANOVA) revealed the presence of highly significant difference that revealed the presence of high genetic variability of wheat in the study area. The highest yield was recorded from the local variety Ferno with 1957 kg/ha followed by Chekole (1588.33 kg) and Canada Sendie (1580.7 kg). Higher value of genotypic coefficient of variation (GCV) and phenotypic coefficient of variation (PCV) were recorded in most of the studied traits indicating the selection may be effective from these traits and phenotypic expression would be good indication of the genotypic potential. Broad sense heritability estimates were very high for most traits signifying the possibility of success in the selection. Correlation study revealed that the number of tillers per plant, number of seeds per plant and harvest index had positive and highly significant correlation with grain yield. The present investigation confirms the presence of high genetic variability in the study area which deserves conservation and formulation of breeding strategy for improving the productivity of wheat in the country.
Key words: Local wheat varieties, agro-morphological traits, genetic variability, correlation.
Wheat is one of the most important cereals world-wide and it is grown in many areas (Briggle and Curtis, 1987). It has been described as the ‘King of Cereals’ because of the acreage it occupies, high productivity and the prominent position it holds in the international food grain trade (Food and Agriculture Organization [FAO], 2004). During the past four decades, wheat has made a significant contribution to the increase in global food production. This is due to the use of higher-yielding, water and fertilizer responsive, and disease resistant cultivars, combined with strengthened input delivery systems, tailored management practices and improved marketing (Ortiz et al., 2008; Dixon et al., 2006).
Wheat is the most important small cereal crops in Ethiopia (Central Statistical Agency [CSA], 2007). Both durum (Triticum turgidum L. var durum) and bread wheat (Triticum aestivum L.) species are widely cultivated in the country, although other species are cultivated to a lesser extent (Amsal, 2001). Wheat is a temperate crop, even currently, it is also becoming the most important cereals grown on a large scale in the tropical and subtropical regions of the world (Onwueme and Sinha, 1999). This makes it the most suitable and commonly cultivated crop in South Gondar highland areas. According to South Gondar Agriculture and Rural Development Office, wheat has been the leading cultivated crop in the zone for longer years.
Variability is the occurrence of differences among individuals due to differences in their genetic composition and/or the environment in which they are raised (Allard, 1960; Falconer and Mackay, 1996). If the character expression of two individuals could be measured in an environment identical for both, differences in expression would result from genetic control and hence such variation is called genetic variation (Falconer and Mackay, 1996). Information on the nature and magnitude of genetic variability present in a crop species is important for developing effective crop improvement program. Heritability in broad sense refers to the portion of phenotypically expressed variation, within a given envi-ronment and it measures the degree to which a trait can be modified by selection (Christiansen and Lewis, 1982).
Grain yield is the most complex trait, because it is influenced by all factors (known and unknown) that determine productivity (Araus et al., 2001). Consequently, the inheritance and interrelationships of grain yield and of characters influencing grain yield are highly important. It is, therefore, imperative to estimate the magnitudes of correlations between grain yield and its components.
Despite the fact that extensive wheat research practices have been conducted in different parts of the country, further cooperative investigations from different institutions is still needed to exploit the existing genetic resource which enables the nation to meet the goal of self sufficiency. Therefore, this research work was aimed at collecting the existing local wheat varieties from local farmers in South Gondar zone and investigating their extent of variability, heritability and correlations using some agro-morphological traits.
Description of the study area
All the studied genotypes were collected from local farmers living in different districts of South Gondar zone. The experiment was conducted at Farta district which is found in South Gondar zone, Amhara Regional State, Ethiopia. The study area is located at 660 km Northwest of Addis Ababa, capital city of Ethiopia and lies between the coordinates of 11°32’ to 12°03’ N latitude and 37°31’ to 38°43’ E longitude with an estimated area of 1118 km2. The entire area of the study district has a topography characterized by extremely high relief in the upper watershed of Blue Nile River system. The altitude of the study area varies between 1920 and 4235 m above mean sea level with topography of gentle to undulating. The average annual minimum, maximum and mean temperatures are 9.7, 22, and 15.5°C, respectively. The rainfall pattern is uni-modal, stretching from May to September. The annual rainfall ranges between 1097 and 1954 mm with a long term average of 1448 mm (Debretabor University, 2013 Survey Result).
Experimental and design
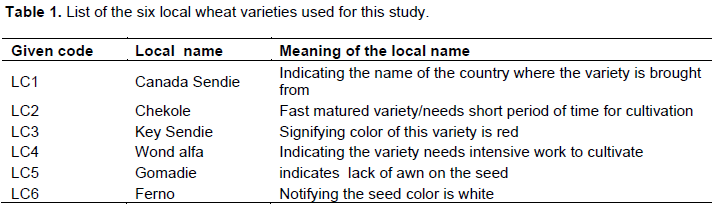
The trial was established on May 20, 2014 at Farta district on farmer’s field. Six local wheat varieties which were commonly cultivated in different districts of South Gondar zone were collected from the field and used for this study (Table 1). These local genotypes were certified and released varieties from research centers, but cultivated for more than 10 years in the study area. The experiment was conducted in randomized complete block design with three replications. The total plot size was 2 × 3 m consisting of 10 rows per plot and net plot size of 2 × 2.8 m with six harvestable rows. Distance of 20 and 10 cm were used for between rows and plants, respectively. The seed rate was 150 kg/ha and sowed by hand drilling at 20 cm row spacing and fertilizer rates (diammonium phosphate [DAP] and urea) were applied as recommended. All other pre and post-stand establishment management practices were done by following the recommended wheat husbandry practices.
Data collection
Data was collected on phenological and yield components based on 12 agro-morphological characters, namely, days from plant emergence to heading, days from sowing to physiological maturity, grain filling period, plant height (cm), number of fertile tillers per plant, number of spikes per m2, spike length (cm), number of grains per spike, number of spikelets per spike, biomass yield per plot (g), grain yield per plot (g) and harvest index per plot (%).
Plant height, number of fertile tillers, spikelets per spike, number of grains per spike and spike length were determined on the basis of 10 randomly chosen plants per plot (Geleta and Grausgruber, 2013). Days to heading was counted from the date of sowing till 75% of the heads emerged while days to maturity was recorded from the date of sowing till 75% of the plant will get matured. A plant is physiologically matured when 75% of the glumes of the primary spike turned yellow. Biomass and grain yield was recorded on a per plot basis, and harvest index was determined from the ratio of grain yield to biomass. Biomass and grain yield per plot recorded was converted into kg/ha.
Statistical analysis
Mean data collected from the field was subjected to analysis of variance using appropriate procedures of the statistical analysis system (SAS) software version 9.2 (SAS Institute Inc., 2008). The treatment effects were compared using least significant difference (LSD) test at 5 and 1% probability level. Descriptive statistics was used to observe the existing variability among the studied genotypes for each agro-morphological trait. Pearson’s correlation coefficient was used to see the association between traits.
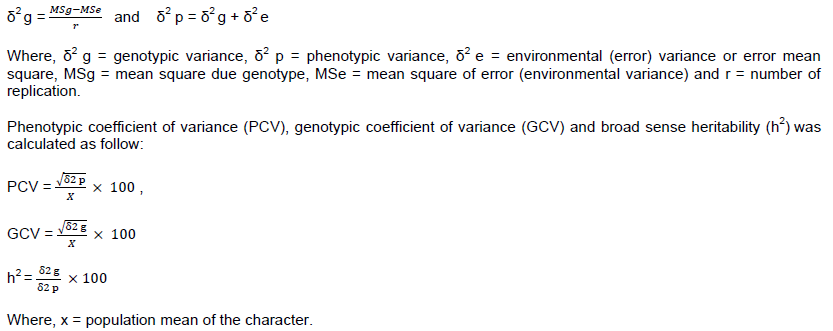
The variability present in the genotypes was estimated by phenotypic and genotypic variances and coefficient of variations using the procedure suggested by Burton and De Vane (1953).
Analysis of variance
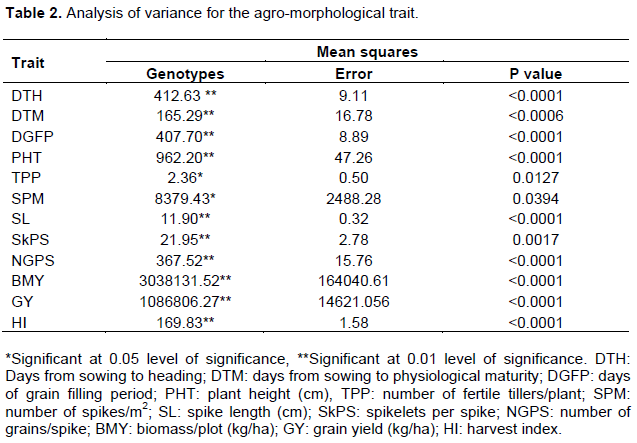
Mean square of genotypes for all the studied characters, except number of fertile tillers per plant, have highly significant (P < 0.0001) differences among the studied local wheat varieties (Table 2) indicating the existence of sufficient genetic variability within different genotypes to be exploited in the breeding programs that was also reflected in the broad ranges observed for each traits.
Mean performance of genotypes
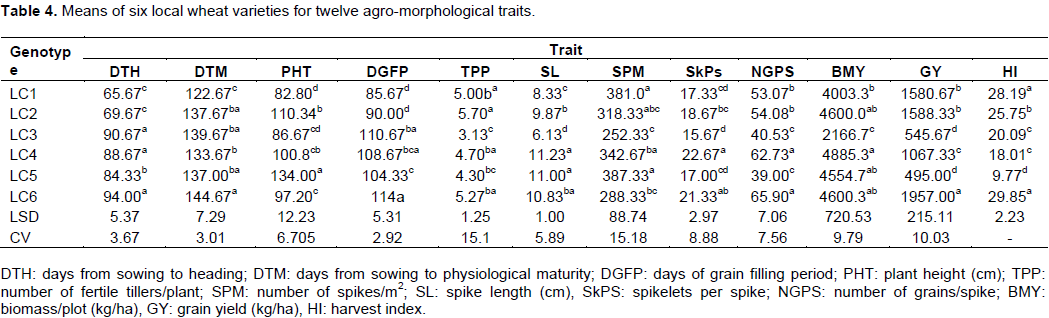
The shortest time for heading was recorded for Canada Sendie variety (65.67 days) and got matured earlier than other studied varieties (122.67 days), while Ferno took the longest time for heading (94 days) and matured after 144 days (Table 4). The highest number of fertile tillers per plant was recorded from Chekole variety (5.70), while Key Sendie had the least number (3.13). The highest yield was recorded by Ferno variety (1957kg/ha) followed by Chekole (1588.33 kg) and Canada Sendie (1580.7 kg) while the lowest yield was found in Gomadie variety (495 kg).
Phenotypic and genotypic variations
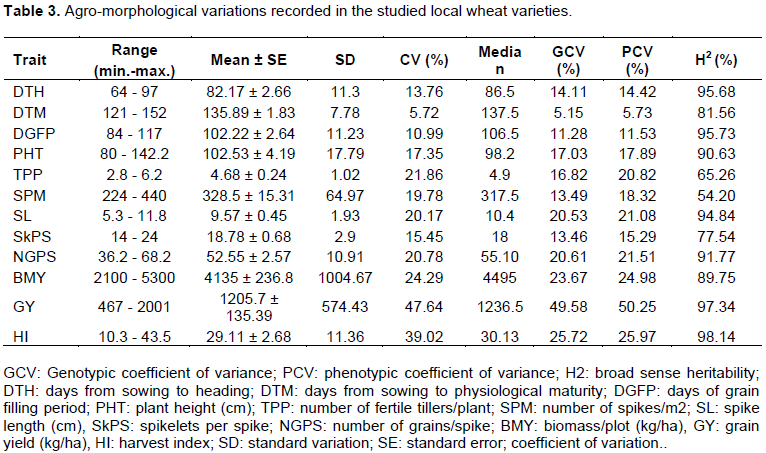
The amount of genotypic and phenotypic variability that exists in a species is of utmost importance in breeding better varieties and in initiating a breeding program. Genotypic and phenotypic coefficients of variation are used to measure the variability that exists in a given population (Burton and Devane, 1988). In general, PCV values were greater than GCV values, although the differences were small. This indicated that the environmental effect was small for the expression of most characters. The GCV ranged from 5.15 for days taken for maturity to 49.58 for grain yield, while PCV ranged from 5.73 for days taken for maturity to 50.25 for grain yield (Table 3). Deshmukh et al. (1986) classified PCV and GCV values as high (>20%), medium (10 to 20%) and low (<10%). Accordingly, high PCV and GCV were observed in traits spike length, numbers of grains per spike, grain yield and harvest index, while others scored medium PCV and GCV except days taken for maturity which scored low. The high PCV and GCV indicated that selection may be effective based on these traits and their phenotypic expression would be good indication of the genotypic potential (Singh et al., 1994), while low PCV and GCV implies less scope of selection as they are under the influence of environment.


Heritability
Generally, heritability indicates the effectiveness with which selection of genotypes can be based on phenotypic performance. In this study, the heritability estimate ranged from 54.20% for number of spikes/m2 to 89.08% for harvest index (Table 3). The heritability was larger for most of the traits due to smaller phenotypic variances. According to Pramoda and Gangaprasad (2007), heritability estimates can be low (<40%), medium (40 to 59%), moderately high (60 to 79%), and very high (>79%). Accordingly, heritability estimates were very high for nine traits from the total of 12 studied traits (Table 3) indicating the possibility of success in selection, because there would be a close correspondence between genotype and phenotype due to a relatively smaller contribution of environment to phenotype.
Correlation of grain yield and yield related traits
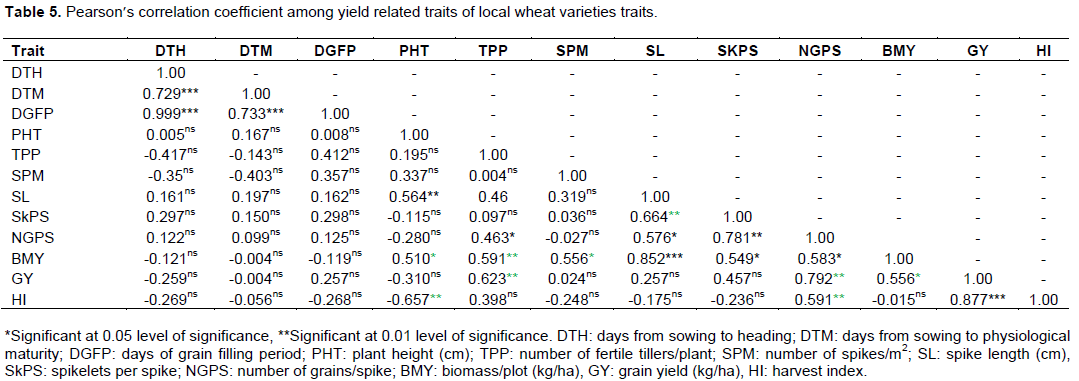
The various characteristics of crop plants are generally interrelated or correlated. Such correlations can either be negative or positive. In plant genetics and breeding studies, correlated characters are of prime importance, because of genetic causes of correlations through pleiotropic action or developmental interactions of genes and changes brought about by a natural or artificial selection (Falconer and Mackay, 1996; Sharma, 1998). Number of grains per spike, number of tillers per plant and harvest index was found to have highly significant positive correlation with grain yield, while it had significant and positive correlation with spikelets per spike and biomass (Table 5).
Six locally cultivated wheat varieties were evaluated for variability, heritability and association of characters using 12 phonological and yield related traits. Highly significant variation was recorded in all traits except for tillers per plant and numbers of spikelets/m2 that could indicate the presence of high wheat genetic variability in the study area. This finding agreed with Dawit et al. (2012) which indicated the presence of high genetic diversity of durum wheat genotypes inEthiopia. Geleta et al. (2013) concluded that the presence of considerable genetic variation for quantitative morphological and quality traits from different wheat accessions was taken from Ethiopia. This investigation showed that PCV was slightly higher than GCV in all the tested traits that indicates the presence of small environmental influence. Awale et al. (2013) explained the presence of slightly higher PCV value than GCV on some bread wheat genotypes grown in Eastern Ethiopia. Asaye et al. (2013) got the same result after being tested on wheat genotypes from East Gojjam zone. Higher broad sense heritability was recorded in most of the tested traits which is because of smaller phenotypic variance and this is in line with the studies of Khan et al. (2010), Salem et al. (2008) and Awale et al. (2013). Grain yield had a positive and highly significant correlation with number of grains per spike, number of tillers per plant and harvest index that indicates these traits must be considered during selection. Nawaz et al. (2013) also got similar correlation result in some wheat varieties from Pakistan. This study shows that better yield was recorded from local variety Ferno followed by Chekole and Canada Sendie which indicates these varieties should be considered for future wheat yield improvement programs.
The authors have not declared any conflict of interests.
REFERENCES
|
Allard RW (1960). Principles of Plant Breeding. John Wiley and Sons. Inc. New York. P 254.
|
|
|
|
Amsal T (2001). Studies on Genotypic Variability and Inheritance of Water logging tolerance in Wheat. Ph.D. Dissertation. University of the Free State, Bloemfontein, South Africa. P 123.
|
|
|
|
|
Araus JL, Casadesus J, Bort J (2001). Recent tools for the screening of physiological traits determining yield. In Reynolds, M.P., J.I. Ortiz-Monasterio and McNab (ed.) Application of Physiology in Wheat Breeding. Mexico, D.F.:CIMMYT. P 221.
|
|
|
|
|
Asaye D, Tadesse D, Getachew A (2013). Genetic variation of bread wheat (Triticum aestivum L.) genotypes based on number of phonological and morphological traits at Marwold Kebele, Womberma Woreda, West Gojam. Wud. J. Agric. 2:160-166.
|
|
|
|
|
Awale D, Takele D, Sharif M (2013). Genetic variability and traits association in bread whea(Triticum aestivum L.) genotypes. Int. J. Agric. Res. 1:19-29.
|
|
|
|
|
Briggle LW, Curtis BC (1987). Wheat worldwide. In: Wheat and wheat improvement, Heyene EG(ed), ASA, CSSA, SSSA, Madison, Wisconsin, USA, pp. 1-32.
|
|
|
|
|
Burton GW, De Vane EH (1988). Estimation of heritability in Tall Festuca (Festuca arundinacea) from replicated clonal material. Aron. J. 45:478-481.
Crossref
|
|
|
|
|
Central Statistical Authority (CSA), 2007. Report on Area and Production of Crops. Statistical Bulletin No 446. Addis Ababa, Ethiopia.
|
|
|
|
|
Christiansen MN, Lewis CF (1982). Breeding Plants for Less Favorable Environments. A Wiley-Interscience Publication, John Wiley and Sons. New York.
|
|
|
|
|
Dawit T, Dessalegn T, Yigzaw D, Getnet S (2012). Analysis of genetic diversity in some durum wheat (Triticum durum Desf) genotypes grown in Ethiopia. Afri. J. Biot., 11:9606-9611.
|
|
|
|
|
Deshmukh SNN, Basu MS, Reddy PS (1986). Genetic variability, character association and path coefficient analysis of quantitative traits in Viginia bunch varieties of groundnut. Indian J. Agric. Sci. 56:516-521.
|
|
|
|
|
Dixon J, Nally L, Aquino P, Kosina P, La Rovere R, Hellin J, (2006). Adoption and economic impact of improved wheat varieties in developing countries. J. Agric. Sci., 144:489-502.
Crossref
|
|
|
|
|
Falconer DS, Trudy FC (1996). Introduction to Quantitative Genetics. 4th ed. Longman Group Limited, Malaysia.
|
|
|
|
|
Falconer DS, Mackay TFC (1996). Introduction to Quantitative Genetics 4th ed. Longman Group Limited Malaysia.
|
|
|
|
|
Food and Agriculture Organization (FAO) (2005). Crop Production Statistics. Food and Agricultural Organization of the United Nations. Published on line at: http://faostat.fao.org.
|
|
|
|
|
Geleta N, Grausgruber H (2013). Morphological and quality traits variation in tetraploid (triticum turgidum l.) and hexaploid (Triticum aestivum L.) wheat accessions from Ethiopia. J. Agric. Sci. 3:229-236.
|
|
|
|
|
Khan AA, Iqbal A, Awan FS, Khan IA (2010). Genetic diversity in wheat germplasm collections from Balochistan province of Pakistan. Pak. J. Bot. 42(1):89-96.
|
|
|
|
|
Nawaza R, Inamullah H, Ahmad S, Sajjadiqbal M (2013). Agromorphological studies of local wheat varieties for variability and their association with yield related traits. Pak. J. Bot. 45:1701-1706.
|
|
|
|
|
Geleta N, Grausgruber H (2013). Morphological and quality traits variation in tetraploid (triticum turgidum l.) and hexaploid (triticum aestivum L.) wheat accessions from Ethiopia. Agri. Sc. R. J. 3(8):229-236.
|
|
|
|
|
Onwueme IC, Sinha TD (1999). Field crops production in tropical Africa. CTA Publications, Wageningen, pp. 250-266.
|
|
|
|
|
Ortiz R, Braun HJ, Crossa J, Crouch JH, Davenport G, Dixon J, Dreisigacker S, Duveiller E, He Z, Huerta J, Joshi AK, Kishii M, Kosina P, Manes Y, Mezzalama M, Morgounov A, Murakami J, Nicol J, Ferrara GO, Ortiz-Monasterio JI, Payne TS, Pe-a RJ, Reynolds MP, Sayre KD, Sharma RC, Singh RP, Wang J, Warburton M, Wu H, Iwanaga HM (2008). Wheat genetic resources enhancement by the International Maize and Wheat Improvement Center (CIMMYT). Gen. Res. Crop. Evol. 55:1095-1140.
Crossref
|
|
|
|
|
Pramoda HP, Gangaprasad S (2007). Biometrical basis of handling segregation population for improving productivity in onion (Allium cepa L.). J. Asian Hort., 3 (4):278-280.
|
|
|
|
|
Salem KF, El-Zanaty AM, Esmail RM (2008). Assessing Wheat (Triticum aestivum L.) Genetic Diversity Using Morphological Characters and Microsatallite Markers. World J. Agri. Sci. 4:538-544.
|
|
|
|
|
SAS (2008). Statistical Analysis System. Version 9.2, SAS Institute Inc., Cary, NC.USA.
|
|
|
|
|
Sharma JR (1998). Statistical and biometrical techniques in plant breeding. New Age International (P) limited, publishers. New Delhi. 432p.
|
|
|
|
|
Singh GP, Maurya KR, Prasad B, Singh AK (1994). Genetic variability in Capsicum annuum L. Jappl. Biol. 4:19-22.
|
|