ABSTRACT
This experiment was conducted to evaluate 36 common bean genotypes including seven released varieties to generate information on the extent of genetic variability, heritability and expected genetic advance of yield and yield related traits. The field experiment was conducted in 2015 at two locations (Abaya and Yabello) and genotypes were planted in triple lattice design. Data were collected on yield and important agronomic traits. The estimated genotypic (GCV) and phenotypic (PCV) coefficient of variations ranged from 4.82 to 9.85% and 7.03 to 12.93%, respectively for combined analyses. The PCV values were relatively greater than GCV in magnitude for all traits, of which the magnitude of the differences were large for grain yield, seeds number per plant and number of primary branches, but was relatively low for plant height and number of seeds per pod. Broad sense heritability ranged from 18.29 to 58.6%, and genetic advance as percentage of mean ranged from 4.25 to 14.42%. Only plant height and seed number per pod had moderate heritability coupled with relatively high genetic advance values.
Key words: Genotypic coefficient of variation, phenotypic coefficient of variation, broad sense heritability, genetic advance as percentage of mean.
Common bean (Phaseolus vulgaris L.), also called field bean, dry bean, french bean, kidney bean etc. is one of the most important legume crops in the world (Karasu and Oz, 2010). Common bean is a diploid (2n = 2x = 22) and predominantly self-crossing species although 3% or more out crossing rate has also been observed (Ibarra-Perez et al., 1997). It is the world’s second most important pulse after soybean (Parades et al., 2009) and is regarded as “Grain of hope” as it is an important component of subsistence agriculture and feeds about 300 million people in tropics and 100 million people in Africa alone (Sofi et al., 2011). Common bean is among the major pulses grown in the lowland to mid-altitude sub-humid agro-ecologies of Ethiopia (Teshale et al., 2006). It is a crop of rich protein and minerals such as iron and zinc in the diet, and has short maturity period of about three months, thus it is available for family consumption during the period when other crops are immature (Teshale et al., 2006).
Variability is the occurrence of differences among individuals due to differences in their genetic composition and/or the environment in which they are raised (Allard, 1960; Falconer and Mackay, 1996). For effective selection, information on nature and magnitude of variation in populations are necessary (Yagdi, 2009). The choice of promising genotypes from diverse genetic base, and their subsequent utilization for hybridization is one of the strategies for improving the productivity of common beans (Mulugeta et al., 2013). Genetic variability studies have been conducted in Ethiopia by considerable number of researchers on common bean (Daniel et al., 2015; Alamayehu, 2010; Barecha, 2015; Kassaye, 2006; Boru, 2014). Most of the studies on common bean variability were conducted in other parts of the country not in Borena zone (southern Ethiopia) where moisture stress is a major crop production problem and the agriculture production is dominated by pastoralist and agro-pastoralist. Common bean is a major pulse crop grown by Agro pastoralist and Farmers of the study area. Moreover, information is lacking on the potential of common bean genotypes in southern Ethiopia in general and Abaya, and Yabello district of Borana zone in particular. Hence the present study was undertaken to estimate the extent of genetic variability, heritability and genetic advance in common bean genotypes for yield and yield related traits.
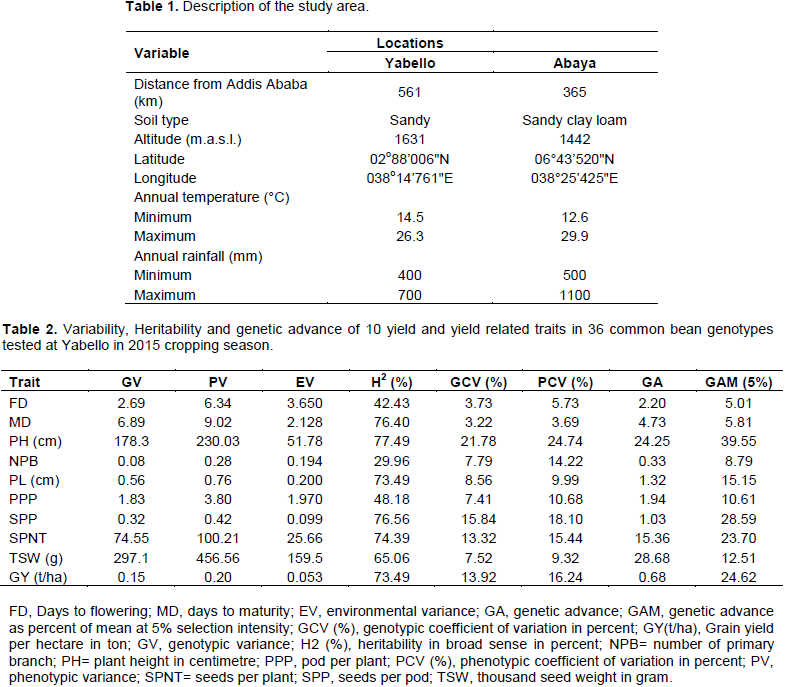
The experiment was conducted at Yabello and Abaya during 2015 cropping season. The experimental areas are located in the Southern part of the Ethiopia in the Oromia Regional State. The detail description of the study areas are listed in the Table 1.
Experimental materials
For this study, 36 common bean genotypes were obtained from Melkasa Agriculture Research Centre (MARC) and evaluated for genetic variability, heritability and genetic advance for yield and yield related traits. Among the tested genotypes, seven are varieties released in the different years and for different areas. Description of the new common bean entries and released varieties are presented in Appendix Tables 1 and 2.

Experimental design and managements
The experiment was laid out in 6 × 6 triple lattice design. Each entry was planted in a plot having 6 rows of 4 m length. Four rows were harvested and two border rows were left to exclude border effect. The row and plant spacing was kept at 40 and 10 cm, respectively. Individual plot size was 2.4 m × 4 m = 9.6 m2 and 1 and 1.5 m between replication and sub block, respectively. Fertilizer was applied as nationally recommended for the crop at the rates of 46 kg P2O5 and 18 kg N /ha (100 kg/ha DAP) at the time of planting. All other agronomic managements were applied uniformly in all experimental plots as per national recommendation for the crop.
Data collection
The following data were collected during the experiment time both from the whole plot, net plot and sampled plants by random selection method from the middle of four rows of each plot.
Data recorded on plant basis
Plant height at harvest (cm)
Height of five randomly taken plants during harvest period from each experimental plot was measured in centimetre from the ground level to top of the plants and the average height was recorded.
Number of primary branches
Number of productive branches extending from the main stem was recorded from five randomly selected plants and average branch number was taken.
Pod length (cm)
The length of five randomly selected pods from each of the five randomly selected plants was measured at harvesting and the average was used.
Number of pods per plant
This was recorded as average total number of pods of five randomly selected plants from each experimental plot at harvest.
Number of seeds per pod
This was recorded as average total number of seeds of five randomly selected plants from each experimental plot divided by total number of pod of the same plants at harvest.
Seeds per plant
Average number of seeds counted from five randomly selected plants.
Data collection on plot basis
Days to flowering
This was recorded as numbers of days from the date of emergence to the date on which about 50% of the plants in each plot produce flowers.
Days to maturity
This is the number of days from planting to the date when 90% of the morphological observation of the plant turned to yellow straw colour.
Stand count at harvest
This was recorded by counting the total number of plants from the four middle rows of each plot at harvest.
Grain yield (g/plot)
Grain yield in grams obtained from the central four harvestable rows of each plot was harvested, threshed and weighted using sensitive balance and then adjusted to 10% moisture content.
Grain yield (ton/ha)
Grain yield obtained from each plot was used to estimate grain yield (tons) per hectare.
Thousand seed weight (g)
The weight in grams of 1000 seed was randomly taken from each experimental plot using sensitive balance and adjusted to 10% moisture content.
Data analysis
Analysis of variance
Analysis of variance (ANOVA) was computed for grain yield and other traits as per the methods described by Gomez and Gomez (1984) using SAS computer software (Version 9) for triple lattice design. Comparison of treatment means was made using Duncan Multiple Range test (DMRT) at 5% level of significance test. Location wise analyses were performed and error variances were subjected to F-test for homogeneity test of variances. Variables with homogeneous error variances were directly used for combined analyses, while those with heterogeneous error variances were analysed in individual locations. The combined analysis was based on mixed model (fixed genotype and random environment).
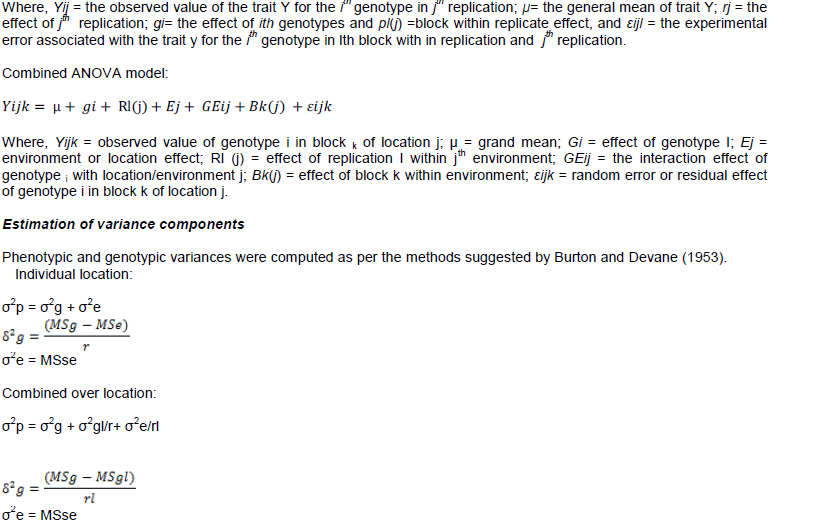
Individual locations ANOVA were computed using the following mathematical model:
Where, MSg and MSe = mean squares for genotypes and error respectively. σ2g = genotypic variances; σ2e = environmental (error) variance; σ2P = phenotypic variance; σ2gl =variance due to genotype by environment interaction; r = number of replications. The genotypic and phenotypic coefficients of variation were computed according to the formulae of Singh and Chaundary (1979):
Genotypic coefficient of variation (GCV) = (σg/grand mean) × 100
Phenotypic coefficient of variation (PCV) = (σph/grand mean) × 100
Where, σg and σph are genotypic and phenotypic standard deviations, respectively.
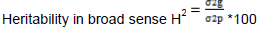
Estimate of heritability in broad sense
Broad sense heritability values were estimated based on the formula suggested by Falconer and Mackay (1996) as follows:
σ2g =genotypic variances; σ2p = phenotypic variances.
Estimation of expected genetic advance
The genetic advance for selection intensity (k) at 5% was estimated by the following formula (Johnson et al., 1955; Allard, 1960):
EGA = k * σph * H2
Where, EGA represents the expected genetic advance under selection; σph is the phenotypic standard deviation; H2 is heritability in broad sense and k is selection differential (k = 2.06 at 5% selection intensity).
The genetic advance as percent of population mean was estimated following the procedure of Johnson et al. (1955).
Genetic advance as percent of population mean (GAM) = (EGA/grand mean) * 100
Variance component, heritability and genetic advance
Phenotypic and genotypic variations
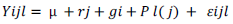
Estimated phenotypic and genotypic variances: Phenotypic coefficient of variation (PCV) and genotypic coefficient of variation (GCV) of the 10 studied traits are presented in Tables 3 and 4. Genotypic coefficient of variation (GCV) ranged from 3.22 (days to maturity) to 21.78% (plant height) at Yabello (Table 2) and 3.34 (days to maturity) to 16.27% (grain yield /ha) at Abaya (Table 3). The phenotypic coefficient of variation (PCV) ranged from 3.69 (days to maturity) to 18.10% (seed number per pod) at Yabello and 4.7 (days to maturity) to 20.01 (grain yield /ha) at Abaya (Table 3). On the basis of combined analysis over locations, the genotypic coefficient of variation (GCV) ranged from 4.6 (thousand seed weight) to 9.86% (seeds per pod), while phenotypic coefficient of variation (PCV) ranged from 6.91 (number pods per plant) to 12.93% (seeds per pod) (Table 4). In all variances analyses, phenotypic coefficient of variation was higher than genotypic coefficient of variation. However, relatively the larger magnitude of difference between the two was observed in grain yield ha-1, seeds per plant and thousand seed weight. This indicates the higher influence of environmental factors than genetic factors in the expression of these traits. In these traits, selection based on the phenotype performance may not be appropriate. Nechifor et al. (2011) and Amir et al. (2015) suggested that larger difference between GCV and PCV is due to larger influence of environment on that trait. In common bean, a wide range of GCV and PCV values were reported (Nechifor et al., 2011; Alemayehu, 2010; Amir et al., 2015; Ahmed and Kamaluddin, 2013). According to Deshmukh et al. (1986), and Sivasubramanian and Madhavamenon (1973) genotypic and phenotypic coefficient of variations can be categorized as low (<10%), medium (10-20%) and high (>20%). In this study, both GCV and PCV were low for days to flowering, days to maturity and pod length (Tables 2 and 3), number of primary branches, number pods per plant, and thousand seed weight. Moderate PCV and low GCV was observed for seed per pod, plant height, and yield ha-1 (Table 4). The relative difference between GCV and PCV was small in plant height, number of seed per pods and pod number per plant. This suggested that the chance of improving these traits through selection is high. Ahmed and Kamaluddin (2013), Roy et al. (2006), Raffi and Nath (2004), and Nechifor et al. (2011) also reported similar results in common bean.
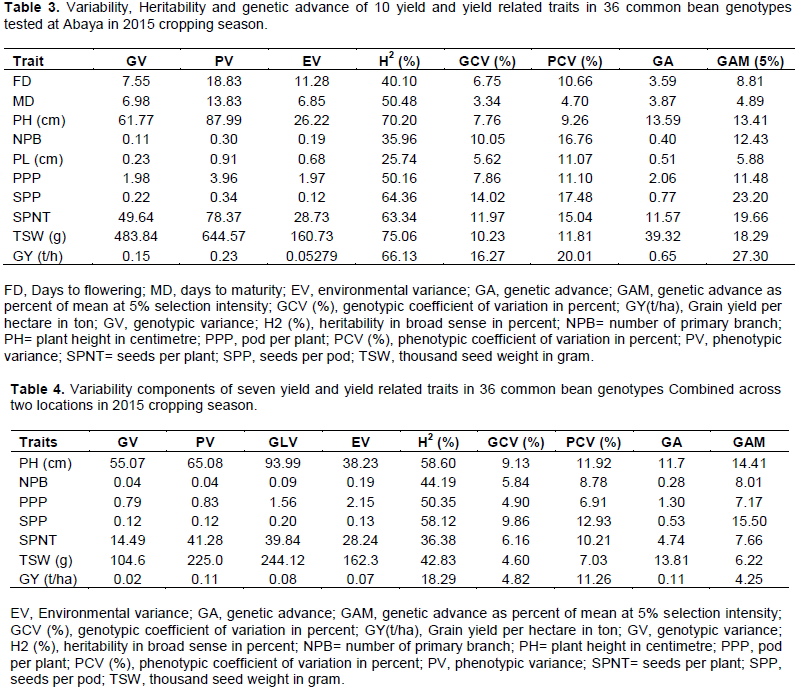
The variance components for grain yield showed variation for locations and combined analyses. Moderate GCV (16.27%) and high PCV (20.01%) at Abaya (Table 3) were as medium GCV (13.92%) and PCV (16.24%) was observed at Yabello (Table 2). Very low GCV (4.82%) and moderate PCV (11.26%) values were observed for this trait in combined combined analysis of variance across location (Table 4). The relative difference between genotypic coefficient of variation (GCV) and phenotypic coefficient of variation (PCV) was large for grain yield/ha (57.24%). This is the indications of the greater influence of environmental factors on these traits. In agreement with this finding, Nechifor et al. (2011) reported the presence of relatively large difference between GCV and PCV for grain yield in common bean which attributed to environmental factors.
Heritability and genetic advance
Estimated heritability in broad sense ranged from 29.96% for number of primary branches to 77.49% for plant height at Yabello; and from 25.74% for pod length to 75.06% for thousand seed weight at Abaya. The calculated genetic advance as percent of mean at 5% selection intensity ranged from 5.01% for flowering date to 39.55% for plant height at Yabello (Table 2) and 4.89% for days to maturity to 27.30% for grain yield at Abaya (Table 3).
On the basis of combined analysis over the two locations, the estimated heritability values ranged from 18.29% for grain yield ha-1 to 58.6% for plant height. The calculated genetic advance as percentage of mean ranged from 4.25% for grain ha-1 to 15.51% for seeds number per pod. As demonstrated by Robinson et al. (1949), heritability can be categorized as low (0-30%), moderate (30-60%) and high (60% and above). Johnson et al. (1955) suggested genetic advance as percent of mean can be categorized as low (0-10%), moderate (10-20%) and high (20% and above). In the present study, moderate heritability coupled with moderate genetic advance as percent of mean was observed for plant height and number of seeds per pod suggesting that selection based on the phenotype performance of genotypes for these traits might improve the performance of the progenies. In agreement the result of this study, Nechifor et al. (2011) and Alemayehu (2010) reported moderate estimates of heritability and genetic advance for seeds number per pod in common bean. On the other hand, both values of heritability and genetic advance were low for grain yield/ha. This suggested the low heritability of trait is due to the influence of environment that limits the scope of improvement by selection. Dursun (2007) also reported low broad-sense heritability values for grain yield.
The estimated genetic (GCV) and phenotypic (PCV) values were low to medium for most of the traits. The PCV values were relatively greater than GCV in magnitude for all characters under study. However, the difference between genotypic coefficient of variation and phenotypic coefficient of variation was relatively large in magnitude for grain yield, seed number per plant and number of primary branches indicating the higher influence of environmental factors than genetic factors in the expression of these traits. The difference between phenotypic coefficient of variation and genotypic coefficient of variation was low for plant height and seed per pod indicating that the observed variations for these traits were mostly due to genetic factors but environment also played a role in the expression of these traits. Broad sense heritability ranged from 18.29% in grain yield to 58.6% in plant height. The genetic advance as percentage of means in combined analysis ranged from 4.25% for grain yield to 15.42% for seeds number per pod. Moderate values of heritability coupled with relatively high genetic advance as percentage of means was observed for plant height and seed number per pod. Therefore, selection based on the phenotypic performance of genotypes could increase the mean performance of the selected progenies.
The authors have not declared any conflict of interests.
REFERENCES
|
Ahmed Sh, Kamaluddin (2013). Correlation and path analysis for agro-morphological traits in rajmash beans under Baramulla- Kashmir region. Afr. J. Agric. Res. 8(18):2027-2032
Crossref
|
|
|
|
Alemayehu B (2010). Genetic variation for grain yield and water absorption in common bean (Phaseolus vulgaris L.). Afr. J. Food Sci. Technol. 1(6):128-131.
|
|
|
|
|
Allard RW (1960). Sequential path analysis of grain yield and its components in maize. Plant Breed. 115:343-346.
|
|
|
|
|
Amir BW, Mohd AB, Saba M (2015). Morphological Characterization as Indices for Yield and Yield Components allection in Common bean (Phaseolus Vulgaris L.) in J and K. J. Glob. Biosci. 4(9):3391-3394
|
|
|
|
|
Barecha G (2015). Genetic variability and path coefficient analysis for yield and yield related traits in common bean (Phaseolus vulgaris L.) accessions at Haramaya University, MSc Thesis. Haramaya University, Haramaya, Ethiopia.
|
|
|
|
|
Boru G (2014). Genetic Variation and Characters Association Study for Drought tolerance in large white seed common bean (Phaseolus vulgaris L.) genotypes at melkassa, Rift valley, Ethiopia. MSc Thesis. Jimma University, Jimma, Ethiopia
|
|
|
|
|
Burton GW, Devane EH (1953). Estimating heritability in tall Fescue (Festuca arundinacea) from replicated clonal materials. Agron. J. 45:487-488.
Crossref
|
|
|
|
|
Daniel A, Firew M, Asrat A, Stephen E B, Matthew W B (2015). Trait associations in common bean genotypes grown under drought stress and field infestation by BSM bean fly. Crop J. 3(4):305-316.
Crossref
|
|
|
|
|
Dursun A (2007). Variability, heritability and correlation studies in bean (Phaseolus vulgaris L.) genotypes. World J. Agric. Sci. 5:12-16.
|
|
|
|
|
Falconer DS, Mackay TFC (1996). Introduction to Quantitative Genetics, 4th edn. New York: Longman Scientific and Technical.
|
|
|
|
|
Gomez KA, Gomez AA (1984). Statistical Procedures for Agricultural Research. 2nd edition. John Willey & Sons Ltd., New York, USA. 680p.
|
|
|
|
|
Ibarra-Perez F, Ehdaie B, Waines G (1997). Estimation of out crossing rate in common bean. Crop Sci. 37:60-65.
Crossref
|
|
|
|
|
Johnson HW, Robinson HF, Comstock RE (1955). Estimation of genetic and environmental variability in soybeans. Agron. J. 47:314-318.
Crossref
|
|
|
|
|
Karasu A, Oz M (2010). A study on coefficient analysis and association between agronomical characters in dry bean (Phaseolus vulgaris L.). Bulg. J. Agric. Sci. 16(2):203-211.
|
|
|
|
|
Kassaye N (2006). Studies on genetic divergence in common bean (Phaseolus vulgaris L.), Introductions of Ethiopia. Msc.thesis submitted to the school of graduate studies of addis ababa university in partial fulfillment of the requirements for the degree of master of science in applied genetics (biology). Addis Ababa University. Pp. 1-109
|
|
|
|
|
Mulugeta A, Hussein M, Habtamu Z (2013). Inheritance of Primary Yield Component Traits of Common Beans (Phaseolus vulgaris L.): Number of Seeds per Pod and 1000 Seeds Weight in an 8X8 Diallel Cross Population. Int. J. Biol. Food Vet. Agric. Eng. 7(1):1-5.
|
|
|
|
|
Nechifor B, Filimon R, Szilagyi L (2011). Geneticvariability,heritability and expected genetic advance as indices for yield and yield components selection in common bean (phaseolus vulgaris L.). Scientific Papers, UASVM Bucharest, Series A, Vol. LIV, ISSN 1222-5339. P.332.
|
|
|
|
|
Parades MC, Becerra V, Tay JU (2009). Inorganic nutritional composition of common bean (Phaseolus vulgaris L.) genotypes race Chile. Chil. J. Agric. Res. 69:486-491
Crossref
|
|
|
|
|
Raffi SA, Nath UK (2004). Variability, heritability, genetic advance and relationships of yield and yield contributing characters in dry bean(Phaseolus vulgaris L.). J. Biol. Sci. 4(2):157-159.
Crossref
|
|
|
|
|
Robinson HF, Comstock RE, Harroy VH (1949). Estimate of heritability and degree of dominance in corn. Agron. J. 41:353-359.
Crossref
|
|
|
|
|
Roy SK Abdulkarim Md, Isham AKM, Bari NMd, Main KMA, Tetsushi H(2006). Relationship between Yield and Its component characters of Bush Bean (P. vulgaris L.). South Pac. Stud. 27(1):13-23.
|
|
|
|
|
Singh RK, Chaundhary BD (1979). Biometrical methods in quantitative genetic analysis, Kalyani Publication, New Delhi, India. 318p.
|
|
|
|
|
Sivasubramanian S, Madhavamenon P (1973). Combining ability in rice. Madras Agric. J. 60:419-421.
|
|
|
|
|
Sofi PA, Zargar MY, Debouck D, Graner A (2011). Evaluation of common bean (Phaseolus vulgaris L) germplasm under temperate conditions of Kashmir Valley. J. Phytol. 3(8):47-52.
|
|
|
|
|
Teshale A, Habtu A, Kimani P (2006). Development of Improved Haricot Bean Germplasm for the Mid- and Low- Altitude Sub-Humid Agro- Ecologies of Ethiopia. In. Kemal A; Gemechu K; Seid Ahmed; R. Malhotra; S. Beniwal; K. Makkouk, and M.H. Halila (Eds.). Food and Forage Legumes of Ethiopia: Progress and Prospects. Proceedings of the Workshop on Food and Forage Legumes, 22–26 September 2003. Addis Ababa, Ethiopia. pp. 87-94.
|
|
|
|
|
Yagdi K (2009). Path coefficient analysis of some yield components in durum wheat (Triticum durum Desf). Pak. J. Bot. 41(2):745-751.
|
|