ABSTRACT
The aim of the present study was to determine the level of selected heavy metals in green and black tea varieties consumed in Iran. Samples were prepared with the acid digestion method and measured by polarography. The mean concentration of Zn, Cd, Pb and Cu was 0.505±1.632, 0.417±0.268, 0.325±0.249 and 4.151±3.739 mg/100 g for black tea, and 2.442±4.003, 0.284±0.198, 0.395±0.279 and 5.723±4.286 mg/100 g for green tea, respectively. Results showed no statistically significant difference among the samples with various flavors. Green tea samples were accompanied with high concentration of Zn, Pb and Cu and lower concentration of Cd in comparison with black tea samples. The mean concentration of Cu and Cd had no significant difference in the level of the reference article. Although the level of heavy metals in samples varied from non-detectable doses to extremely high concentration, the mean concentration of each element was in an acceptable range.
Key words: Cadmium, Camellia sinensis, copper, lead, zinc.
Known to be one of the most popular and globally consumed beverages, tea is produced from the leaves of a shrub called Camellia sinensis (Chen and Lin, 2015). Some specific characteristics such as pleasant flavor, cool effect on the mind, and refreshing mood, affordable price and being easy to brew, have made tea to be a first choice beverage in the daily diet in many parts of the world (Chen and Lin, 2015). Iranian people show huge interest in drinking tea. With an old history of presence in social and private life, tea has been a fixed part of the daily diet for majority of the people. With an extensive area appropriated for tea cultivation in the northern provinces together with the same imported volume, a large retail market of tea exists in Iran (Ghoochani et al., 2015; Rezaee et al., 2014; Salahinejad and Aflaki, 2010). Today, with the improvement of processing and producing techniques, an extensive spectrum of choices with various smells and tastes, is prepared for consumers. There are various types of tea (green, black, red, white, etc) obtained from C. sinensis plant species and are especially produced from the leaves, since the leaves undergo fermentation procedures and excess oxidation to make the ordinary black tea (Chen and Lin, 2015).
In the last decades, an increasing number of studies were done on different properties of tea and the impact on human health. It has been well known that by having unique bioelements and organic ingredients like flavonoids and catechins, which express antioxidant and anticarcinogenic roles, regular drinking of tea would have beneficial effects on human health. There have been documented events on a possible role of tea in preventing cardiovascular diseases, neurologic diseases, metabolic diseases, and inhibiting lung, gastrointestinal tract, breast and prostate cancers (Chen and Lin, 2015).
Zinc deficiency through growth periods causes growth failure. Epidermal, gastrointestinal, central nervous, immune, skeletal and reproductive systems are the organs most affected clinically by zinc
insufficiency. Clinical diagnosis of marginal Zn deficiency in humans remains
controversial. So far, blood plasma
/serum zinc concentration, dietary intake and stunting prevalence are the best-known indicators of zinc deficiency (Roohani et al., 2013). Copper (Cu), a redox active metal, is a crucial nutrient for all species studied till now. During the last decade, there was an increasing interest in the concept that marginal deficits of this element can contribute to the development and progression of a number of disease states including cardiovascular disease and diabetes. Deficiency of this nutrient during pregnancy can result in gross structural deformities in the embryo, and perpetual neurological and immunological malformations in the children. Excessive amounts of Cu in the body can also be harmful. Acute Cu toxicity can result in a number of diseases, and in severe cases, death (Uriu-Adams and Keen, 2005).
Due to the growing tendency of industrialization and use of chemical agents (Roohani et al., 2013; Seenivasan et al., 2016; Brzezicha-Cirocka et al., 2016), heavy metals contamination has become a concern in food and beverage business. Recent studies in Iran have reported a probable risk of exposure to heavy metals, to consumers (Ghoochani et al., 2015; Rezaee et al., 2014; Falahi and Hedaiati, 2013). The aim of this study was to determine heavy metals and trace elements level in green and black tea consumed in Iran.
Polarography
Acetic acid glacial, copper (II) nitrate, lead (ii) nitrate, zinc (II) nitrate and cadmium (II) nitrate, sodium acetate and tartaric acid were bought from Merck (Germany), and nitric acid (65%) was obtained from Applichem (Germany).
Preparation of standard solutions
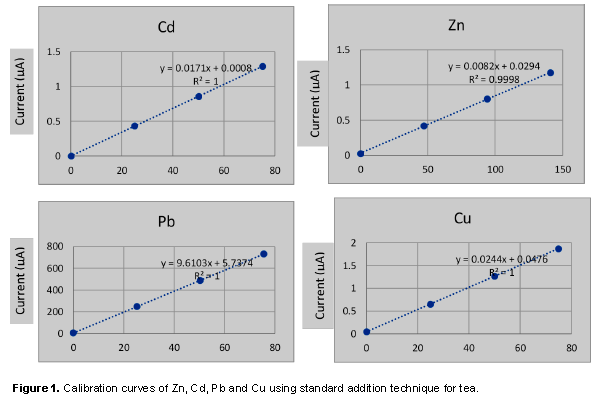
For preparation of standard solution, 17 g of sodium acetate trihydrate was liquefied in 30 mL of distilled water, and 0.75 g of tartaric acid was added to produce sodium acetate buffer. To produce a limpid and monotonous solution via ultrasound waves, a sonicator device was utilized. Glacial acetic acid for setting the pH of the solution in the range of 4.6 to 4.8 was utilized and then distilled water was added to increase the volume up to 100 ml. Next, 0.080 g lead (ii) nitrate, 0.191 g copper (ii) nitrate, 0.137 g cadmium (ii) nitrate and 0.214 g zinc (ii) nitrate, respectively, were dissolved in 100 mL double distilled deionized water to prepare the standard solutions of Pb, Cu, Cd and Zn. The calibration curves of the Zn, Cd, Pb and Cu by the standard addition technique are available in Figure 1.
Sampling and preparation
This study was conducted to obtain comprehensive information on heavy metals and trace elements level in most current green and black varieties of tea in the retail markets of Iran.
The level of four heavy metals and trace elements including Cd, Pb, Zn and Cu was monitored in 25 different commercial kinds of green and black tea. Samples were purchased from the local markets in Tehran, Iran. They covered almost all types of green and black tea found in the retail market. The collected tea brands included Golestan, Mahmud, Ahmad, Dr Bin, Lipton, Golkuh, Miaad, Doghazal, Mehregiah, Zarnush, Twinings, Shahrzad, Shahsevand, Dr. Soleymani, Fumanat, Dineh, Mohsen, Mardin, Bamdad, Gozal, Tashrifat and Newsha.
The collected green and black tea brands were in 7 different flavors, including Ordinary (non-flavored), lemon, mint, cinnamon, jasmin, honey and Tab (tablet). Tea flavor, commercial brands and types (green or black) were considered as variables to study their influence on heavy metals and trace elements concentration.
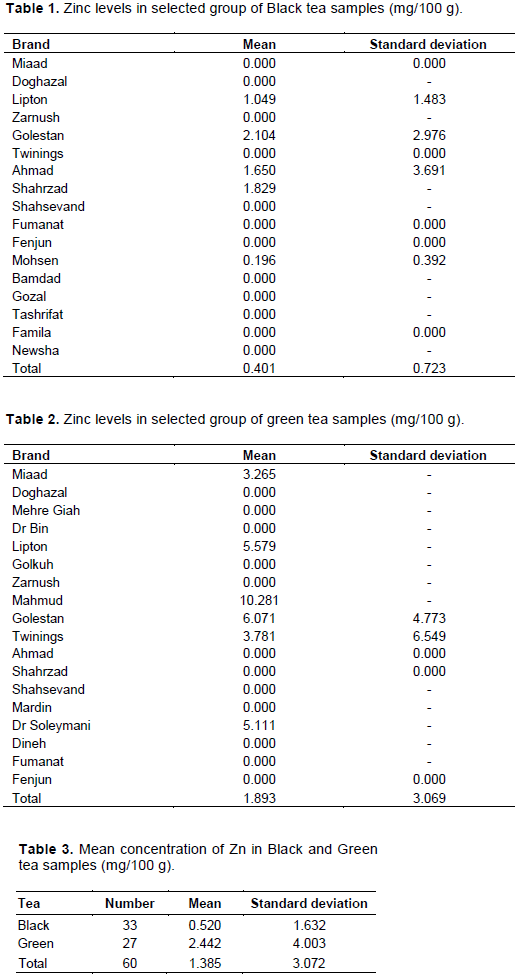
To measure heavy metals and trace elements concentration, a group of 60 samples consisting of 33 black and 27 green tea species with different flavors was set to be surveyed for each element. The sample group was the same for each element. The total number of samples was 180 (n=180). For each sample, about 1 g of commercial tea was accurately weighed into a glass beaker. All glassware were cleaned by soaking in dilute sulfuric acid and rinsed with distilled Milli-Q water. Each tea sample of 1 g was put into a clean 100 ml beaker. 20 ml of concentrated nitric acid was added, the beaker was covered with a watch glass and material was boiled gently on a hot heater equipped with a tunable thermostat until digestion was complete. The complete digestion took about 1 h. A 2.0 ml portion of 70% perchloric acid was then added and gentle heating was performed for 1 h. Small fractions of double purified water were added to prevent dryness caused by evaporation. After cooling down gently to room temperature, the mixture was filtered and transferred to a 100 ml volumetric flask that was rinsed with distilled and deionized water. The concentration of heavy metals was then measured with a polarography machine.
Measurement
Voltammetry comprises a group of electroanalytical methods widely employed in analytical chemistry and other industrial processes. In voltammetry, the information on the analyte was obtained from the measurement of current as a function of applied potential, under the conditions of complete concentration polarization.
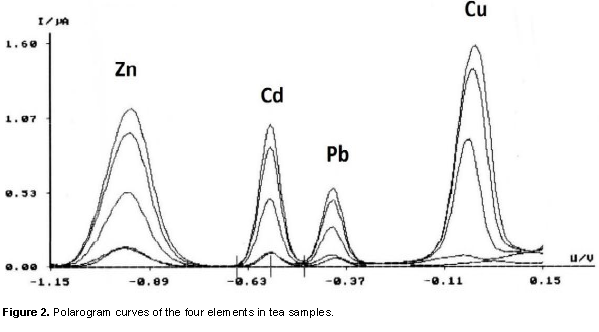
In this study, the polarograph cell was filled with 10 mL of sodium acetate buffer and the solution was stirred at 2000 rpm for 1 min. The polarograph was measured by drawing a baseline utilizing a Hanging Drop Mercury Electrode (HDME). The polarograph was conducted with the initial electrolysis of 800 mV potential applied for 90 s. The stirring was stopped for 10 s through the resting step so that the solution can be ready for measurements. After the polarograph baseline was drawn, 500 μL of the prepared solution was added to the cell and stirred for 100 s at 2000 rpm. By repeating these processes in the next steps, the voltamogram was obtained. Then, 100 μL of the quadruple standard solution was added to the cell in three different stages. The polarograph was used to compute the mean of the three measurements for the evaluation. The device drew the polarogram curves of Zn, Cd, Pb and Cu for black and green tea samples as illustrated in Figure 2.
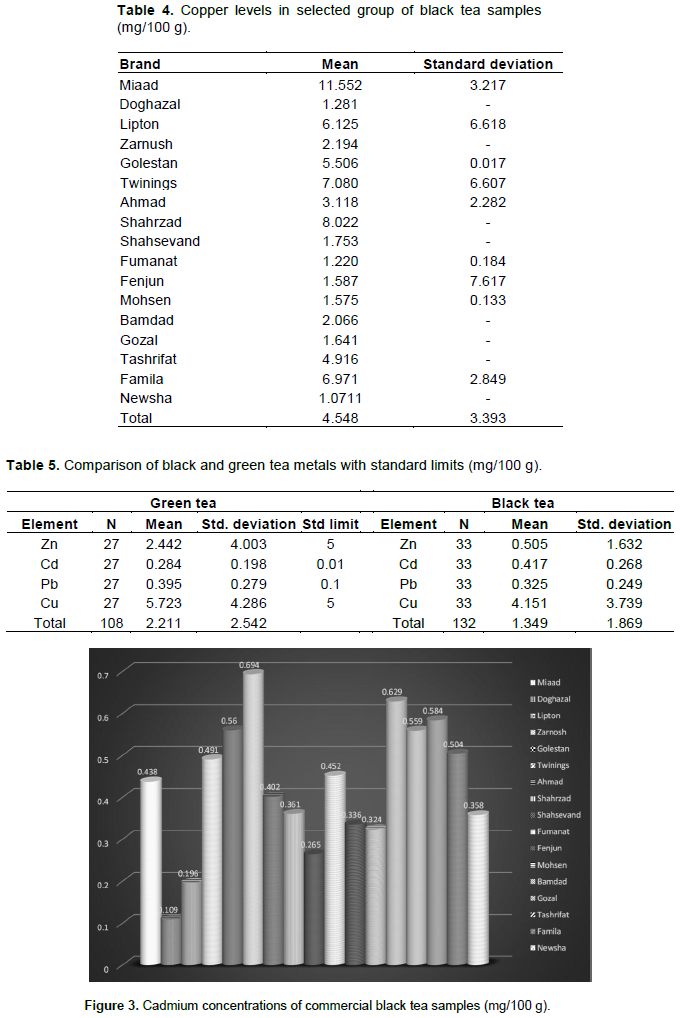
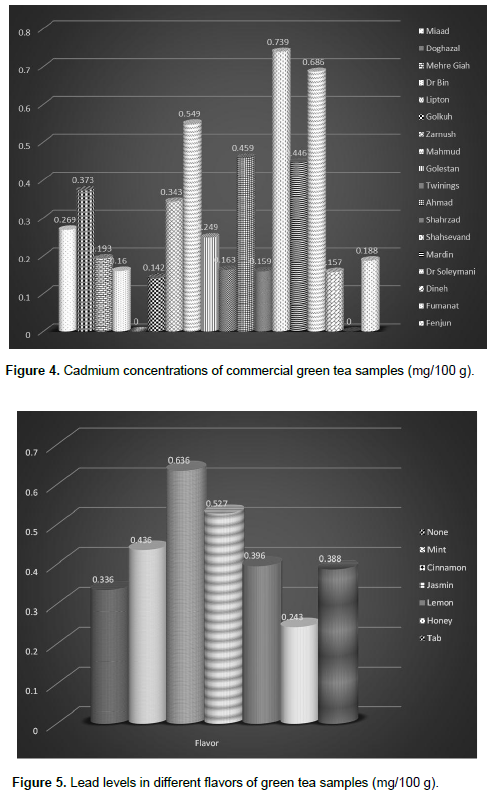
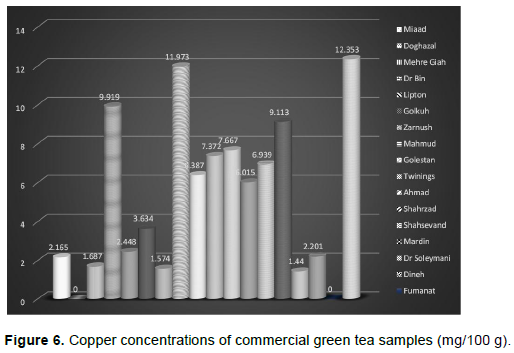
The level of the selected heavy metals in 25 commercial green and black teas is presented in Tables 1 to 5 and Figures 3 to 6. Concentrations of categories of tea and the samples’ flavor are also shown. Analysis of variances (ANOVA) showed no significant statistical difference between green and black tea in terms of heavy metals concentration. Sample 1 groups were ignored with regards to effect of tea flavor in the distribution of heavy metals in the samples. Flavor was not a significant factor in determining the level of heavy metals in tea samples. T-test was conducted to compare the mean concentration of each element with acceptable or allowable daily intake (ADI) as reported by WHO. The mean concentration of Zn and Pb in this study was less than the ADI of reference article and the mean concentration of Cu and Cd had no significant statistical difference with ADI of reference article (by 95% of confidence interval). Cu had the highest mean concentration, while Pb showed the minimum level among the studied elements. The mean concentration of Zn was 0.505±1.632 mg per 100 g for black tea and 2.442±4.003 mg per 100 g for green tea, which varied through a range of 0.00 (non-detectable) to 12.52 mg/100 g with a standard deviation of 12.52. The mean concentration of Cd was 0.417±0.268 mg for black tea and 0.284±0.198 for green tea. The minimum and maximum level for Cd was 0.00 (non-detectable) and 0.996 mg/100 g, respectively. The mean concentration of Pb was 0.325±0.249 mg/100 g for black tea and 0.395±0.279 mg/100 g for green tea. The level of Pb varied between 0.00 (non-detectable) and 0.933 mg/100 g. The average concentration of Cu was 4.151±3.739 mg/100 g for black tea and 5.723±4.286 mg/100 g for green tea. The minimum and maximum concentration of Cu was 0.00 (non-detectable) and 13.82. There is a significant difference between black and green tea content of zinc and cadmium in all samples (P < 0.05) and with regards to lead and copper, there is no significant differ-rence between black and green tea samples (P > 0.05).


In a survey, Nkansah et al. (2016) in Ghana, after monitoring 15 green and black commercial teas, reported the average concentration of Zn, Cd and Pb to be 0.02, 0.036 and 0.016 mg per 100 g, respectively. All the reported sums are less than the ones obtained in the current study, taking into account the difference between the experimental techniques performed. In both studies, Pb had the least concentration of the selected elements.
Falahi and Hedaiati (2013), through a related previous study in Iran, reported a mean concentration of Zn, Cd, Pb and Cu to be 2.88, 0.0134, 0.021 and 1.59 mg/100 g, respectively. The concentrations in the current study, on the other hand, were 1.38, 0.357, 0.357 and 4.85 mg/100 g. The selected elements in this study show a noticeable rise in concentration except for Cu in comparison with the previous study. In a study, Raj et al. (2011) measured the concentrations of some metals in green and black teas in India. The results showed that the concentration was 0.231 for lead, 0.089 for cadmium, 2.539 for zinc and 1.434 for copper per 100 g of black tea, whereas the amounts in green tea were less than LOQ (0.5 mg/kg) for lead and 0.159, 2.639 and 1.128 per 100 g for Cd, Zn and Cu, respectively.
In another study, Hosseni et al. (2013) compared 10 brands of Iranian black tea and 10 brands of imported black tea in terms of contamination with lead and cadmium. The results of their study revealed that the amount of lead and cadmium in Iranian tea is higher than that of imported tea. The average value measured for lead in Iranian and imported black tea was 0.04975 and 0.02933 mg/100 g, respectively. As for cadmium, the average amount of 0.0045 mg/100 g for Iranian and 0.000914 mg/100 g for imported black tea was reported. Values for lead and cadmium in these two categories of tea were less than the maximum allowable concentration and did not pose any problem to human health.
In a research, Sadeghi et al. (2016) measured concentration of zinc, copper, lead and cadmium in four brands of baby food (rice and wheat based) and powder milk with DPASV and polarograph set. Total mean ± SE of zinc, copper, lead and cadmium in baby foods (n = 240) were 11.86 ± 1.474 mg/100 g, 508.197 ± 83.154 μg/100 g, 0.445 ± 0.006, 0.050 ± 0.005 mg/kg, respectively. Also, these amount in powder milk (n = 240) were 3.621 ± 0.529 mg/100 g, 403.822 ± 133.953 μg/100 g, 0.007 ± 0.003, 0.060 ± 0.040 mg/kg, respectively. Zinc level in baby food type I was higher than labeled value (P = 0.030), but in other brands, there was no difference. Concentration of copper in all the samples was in labeled range (P > 0.05). In each of the four products, level of lead and cadmium was lower than the standard limit (P <0.05). Amount of zinc and lead in baby food type I, was different compared to other products. Concentration of zinc and cadmium in baby food type I, was higher than in type II (P = 0.043, 0.001 respectively). Concentration of lead and cadmium in baby food type II, was higher than in infant formulas, but are in standard limit (Sadeghi et al., 2014). Sadeghi et al. (2014) aimed to measure the levels of trace elements: zinc, copper and heavy metals: lead and cadmium by differential pulse anodic stripping voltammetry in 19 barley grain cultivars and their malts in Iran. Ferric reducing antioxidant power (FRAP) assay was also used for determination of antioxidant activity of the samples. The mean levels of Zn, Cd, Pb and Cu were measured to be 18.813 ± 8.575, 0.212 ± 0.116, 0.278 ± 0.163, 3.746 ± 1.118 mg/100 g in the barley samples and 14.364 ± 6.391, 0.153 ± 0.098, 0.179 ± 0.082 and 3.033 ± 1.392 mg/100 g in the malt samples, respectively. The highest concentration of Zn was measured in the Bahman cultivar of barley and Mb-82-4 sample of malt, while the Sahra cultivar of barley and Valfajr sample of malt had the lowest concentration of Pb and the Nimrooz cultivar of barley and Rihane-03 sample of malt had the lowest concentration Cu. The mean levels of zinc and lead in the evaluated samples of barley and the mean levels of zinc, lead and cadmium in the samples of malt were significantly lower than the standard limits (Sadeghi et al., 2016). Maleki et al. (2010) in a research investigated the cadmium and lead content of several commercially available brands of tea (Camellia sinensis) in Iran and compared the release of cadmium and lead from them by infusion. Ten of the most consumed brands of Iranian and imported black tea were bought from local markets. The results showed that the min and max lead contents in the studied tea were 0.66 ± 0.14 and 15.48 ±0.58 μg/g for Sharzad and Sharyat tea, respectively. In addition, the minimum and maximum cadmium content was 0.09 ± 0.013 and 1.92 ± 0.38 μg/g for Ahmad and Sharyat tea, respectively (Maleki et al., 2010).
This study evaluated the health risk of Cd and Pb as well as the health benefits of Zn and Cu in tea of 25 different brands in Iran. The results of the analysis of black and green tea samples are presented. There were wide variations in the heavy metal contents of black and green tea. Consumer brand teas are the blend of various individual teas from different regions across the country. The results of the mean concentration of the selected heavy metals in the current study are in agreement with the results of other studies. The higher levels of some elements in this study as compared to the ones in other studies may be explained by the sensitivity of the laboratory technique applied in this study. The level of the selected heavy metals in green and black tea in this study is in the acceptable range, although, based on some high levels seen in few samples, the risk of exposure to heavy metal intoxication for Iranian tea consumers could not be ignored. There was noticeable amount of zinc and copper in black and green teas. Zinc is an important mineral that is found in every single cell of the body. The red and white blood cells, bones, retina, kidneys, pancreas and liver, all store zinc. The tenth most common element in the human body, zinc, is vital for the functioning of more than 300 hormones and countless enzyme systems in the body. Zinc is also vital for cells to divide and replicate during the production of new tissues. Copper is a key mineral in different body systems. It is central to building strong tissue, maintaining blood volume, and producing energy in cells.
The authors declare that there is no conflict of interest.
This work is student thesis and supported by grant (No: 94-03-33-29825), from Tehran University of Medical Sciences.
REFERENCES
|
Chen ZM, Lin Z (2015). Tea and human health: biomedical functions of tea active components and current issues. Journal of Zhejiang University Science B 16(2):87-102.
Crossref
|
|
|
|
Ghoochani M, Shekoohiyan S, Yunesian M, Nazmara S, Mahvi AH (2015). Determination of aluminum and zinc in infusion tea cultivated in north of Iran. Journal of Environmental Health Science and Engineering 13:49
Crossref
|
|
|
|
|
Rezaee E, Mirlohi M, Fallah A, Babashahi M (2014). A Systematic Review on Exposure to Toxic and Essential Elements through Black Tea Consumption in Iran: Could It be a Major Risk for Human Health? International Journal of Preventive Medicine 5(11):1351-1359.
|
|
|
|
|
Salahinejad M, Aflaki F (2010). Toxic and essential mineral elements content of black tea leaves and their tea infusions consumed in Iran. Biological Trace Element Research 134(1):109-117.
Crossref
|
|
|
|
|
Roohani N, Hurrell R, Kelishadi R, Schulin R (2013). Zinc and its importance for human health: An integrative review. International Journal of Research in Medical Sciences 8(2):144-157.
|
|
|
|
|
Uriu-Adams JY, Keen CL (2005). Copper, oxidative stress, and human health. Molecular Aspects of Medicine 26(4-5):268-298.
Crossref
|
|
|
|
|
Seenivasan S, Anderson TA, Muraleedharan N (2016). Heavy metal content in tea soils and their distribution in different parts of tea plants, Camellia sinensis (L). O. Kuntze. Environmental Monitoring and Assessment 188(7):428.
Crossref
|
|
|
|
|
Brzezicha-Cirocka J, Grembecka M, Szefer P (2016). Monitoring of essential and Heavy metals in green tea from different geographical origins. Environmental Monitoring and Assessment 188(3):183.
Crossref
|
|
|
|
|
Falahi E, Hedaiati R (2013). Heavy metal content of black teas consumed in Iran. Food Additives and Contaminants: Part B Surveillance. 6(2):123-126.
Crossref
|
|
|
|
|
Nkansah MA, Opoku F, Ackumey AA (2016). Risk assessment of mineral and heavy metal content of selected tea products from the Ghanaian market. Environmental Monitoring and Assessment 188(6):332.
Crossref
|
|
|
|
|
Maleki A, Zazouli M, Mohseni A, Saberian M, Izanloo H (2010). Determination of Cadmium and Lead Contents in Black Tea and Tea Liquor from Iran. Asian Journal of Chemistry 22(2):1387-1393.
|
|
|
|
|
Raj V, Srividhya B, Subramanian R (2011). Determination of Lead, Manganese, Copper, Zinc, Cadmium, Nickel and Chromium in tea leaves. International Journal of Pharmacy & Pharmaceutical Sciences 3(4):257-258.
|
|
|
|
|
Hosseni SM, Shakerian A, Moghimi A (2013). Cadmium and Lead Content in Several Brands of Black Tea (Camellia sinensis) in Iran Journal of Food Biosciences and Technology 3:67-72.
|
|
|
|
|
Sadeghi N, Oveisi M, Jannat B, Hajimahmoodi M, Behfar A, Behzad M., Norouzi N, Oveisi M, Jannat B (2014). Simultaneous Measurement of Zinc, Copper, Lead and Cadmium in Baby Weaning Food and Powder Milk by DPASV. Iran. Journal of Pharmacy Research 13(1):345-349.
|
|
|
|
|
Sadeghi N, Oveisi M, Jannat B, Hjimahmoodi M, Malayeri N, Behzad M (2016). Assessment of Some Heavy Metals Concentration and Antioxidant Activity in Barley Grain Cultivars and Their Malts from Iran. Journal of Agricultural Chemistry and Environment 5:121-131.
Crossref
|
|