Full Length Research Paper

ABSTRACT
Rice is the staple food in the Republic of Guinea. However, its production is seriously hampered by iron toxicity. The fight against this stress necessarily involves the search for tolerant or resistant varieties. The study aims to determine quantitative trait locus (QTL) associated with tolerance to iron toxicity and to identify genotypes tolerant or resistant to iron toxicity. Thus, 90 local rice accessions collected in two regions of Guinea with high iron toxicity were evaluated using 33,537 single nucleotide polymorphism (SNP) markers. Seventy of the SNP markers expressed a polymorphism rate of 100%. Diversity analysis of the entire collection with these markers revealed a total of 140 alleles, a moderate Nei genetic diversity of 0.426, a fairly high Shannon diversity index of 0.610 and an organization of the accessions into four genetic groups. The study also identified 12 potentially iron-tolerant accessions and five QTLs associated with iron-toxicity tolerance located on chromosomes 1, 2, 3, 11, and 12. The 12 genotypes identified could be exploited in the lowland rice breeding program.
Key words: Oryza, abiotic stress, molecular characterization, variability, molecular markers.
INTRODUCTION
Rice is the main cereal and staple crop for almost 50% of the world’s population (Ahmed et al., 2019; Mahender et al., 2019; Rasheed et al., 2020). It significantly influences food security in most countries (Ara et al., 2017). About 160 million hectares are devoted to rice production worldwide, with an approximate annual production of about 500 million metric tons (Kirby et al., 2017). Indeed, the north-eastern region of India is globally considered one of the hot pockets for rice genetic resources and a potential region with extremely diverse conditions for rice cultivation (Myers et al., 2000). But, it is produced in various agroecologies and cropping systems including rain fed upland and lowland, irrigated, and mangrove (Balasubramanian et al., 2007). Thus, worldwide, several studies have focused on the genetic diversity of rice (Chakravarthi et al., 2006; Ogunbayo et al., 2005; Sajib et al., 2012) and its response to biotic and abiotic stresses (Mohammadi-Nejad et al., 2008; Aghaee et al., 2011; Selvaraj et al., 2011; Islam et al., 2012; Onyango et al., 2019).
In the Republic of Guinea, rice is also the staple food of more than 12 million people (ANASA, 2012). Indeed, the per capita consumption of rice is about 100 kg/person/year (SNSA, 2010). Rice is sown on nearly 520,000 ha and represents 65% of the country's cereal production (FAO, 2017). Its annual production has increased considerably in recent decades, from 420,000 tonnes in 1991-1992 to 895 tonnes in 2012 (ANASA, 2012). Despite the significant investments made by the state over the last decade and all potential it has (fertile land, abundant rainfall), rice production in Guinea remains below the expectations of producers and consumers (ANASA, 2012). The country still imports an average of 300,000 tonnes on the international market (CILSS/FAO/MA, 2012) to meet the population's demand for rice. The main causes of low national rice production are high production costs and low yields due to biotic factors including diseases (blast, helminthosporium, yellow mottle, etc.), weeds, and abiotic factors such as iron toxicity. Iron toxicity is one of the most important yield limiting abiotic stresses in flooded lowland rice of humid tropic areas (Becker and Asch, 2005). In Savanna zones of Africa, interflow of ferrous ion occurs from upper slopes (Moorman and Van Breeman, 1978). More than 50% lowland rice is being affected with Fe toxicity in West Africa. This stress is still one of the major constraints of lowland rice cultivation in the Republic of Guinea. The traditional culitvated varieties are poorly adapted to it. Indeed, iron toxicity causes significant yield losses in the West African sub-region, ranging from 12 to 100% depending on the rice cultivar used and the levels of iron toxicity (Masajo et al., 1986; Abifarin et al., 1988, 1989).
Several studies combining conventional and molecular breeding approaches are currently being used by Africa Rice in collaboration with the national research programmes of Guinea, Ghana, Nigeria, and Burkina Faso, Côte d'Ivoire within the STRASA project to develop iron-tolerant rice varieties. Among the promising genetic resources for iron toxicity tolerance, 181 varieties were screened for iron toxicity tolerance in susceptible areas in Nigeria and Burkina Faso and under controlled conditions in station pots. Eighty lines were identified as tolerant on the basis of their yield under stress conditions, their iron toxicity scores and other agronomic traits, and producer choice were tested in the four project countries in Participatory Varietal Selection (PVS) rice gardens.
Also, several technological packages such as the development of tolerant or resistant varieties by the Africa Rice Center and the use of silica or fertilisers have been put in place to combat iron toxicity. However, farmers still face enormous difficulties related to the problem of large-scale dissemination of these varieties, their adaptation, the availability of silica, the high cost of fertilisers and the lack of development of plains (Barry, 2020; Barry et al., 2019a). The low success of these previous works in developing iron toxicity tolerant varieties is also related to the complexity of tolerance to this stress in rice.
Local varieties could play an important role in the management of this abiotic rhinestone. Indeed, traditional cultivars are storehouse for a number of desirable alleles. They are the source material for tailoring genotypes for improved agronomic performance, resilience to stresses and enhancement of quality traits (Kapoor et al., 2019). Thus, to improve rice productivity in iron toxicity affected areas, one of the easily accessible and economically profitable avenues for local producers is the use of local iron stress tolerant or resistant cultivars. In addition, previous studies using morphological markers (Barry et al., 2019a; Barry, 2006) revealed the existence of agro-morpho-physiological variability and a positive effect of silica on reducing iron toxicity. However, morphological traits, although they are the primary tools used in breeding programmes, are generally not very informative because of the strong influence of the environment (Anderson et al., 2006).
Unlike morphological and biochemical markers, DNA markers are not influenced by fluctuations in the environment and are independent of the organ analysed and the stage of development of the plant (Tagu and Moussard, 2003). Molecular markers are therefore essential tools in plant breeding, contributing to the acceleration of plant breeding and opening up new perspectives for the breeder. According to Hirschhorn and Daly (2005), the gene-phenotype association reveals missing alleles due to the fact that favourable alleles tend to be rare and difficult to detect. The application of genomic tools has become an essential component in plant breeding programmes and is used to identify novel genes related to agro-nomic or stress tolerance traits. Indeed, studies on rice using single nucleotide polymorphisms (SNPs) have identified loci that can be associated with 14 morphological traits (Xu et al., 2012) such as plant height, grain shape, grain colour, and leaf colour, to name a few. QTLs associated with toxicity tolerance have already been identified in several studies offering prospects for marker-assisted selection (Matthus et al., 2015; Nugraha et al., 2016). Recent prospecting and collection of materials in areas of high iron toxicity has resulted in the collection of 90 traditional rice accessions (Barry et al., 2019b). An evaluation of this local material by integrating tolerant or resistant control varieties would make it possible to select local cultivars that are more adapted and tolerant to iron toxicity. This study aims (i) at determining the level and structure of genetic diversity of local rice cultivars using SNPs markers, (ii) identifying iron-tolerant or iron-resistant local accessions and (iii) identifying molecular markers associated with iron tolerance and/or resistance.
MATERIALS AND METHODS
Plant
The plant material consists of 90 local rice accessions collected inKindia and Macenta prefectures and six introduced improved varieties used as controls of which four (CK 73, ORULUX 6, AZUCENA, NERICA L-19) are considered resistant or tolerant to iron toxicity and two (IR 64, BOUAKE 189) sensitive to iron toxicity.
Molecular markers
A total of 33,537 SNP markers were used for the analyses and 26,067 SNP markers were identified for this study. These markers were developed specifically for diversity studies of local rice accessions collected in Guinea and the identification of specific markers associated with tolerance to iron toxicity. These markers were generated following partial sequencing of the rice genome in collaboration between AfricaRice and the Kenya-based International Livestock Research Institute. The SNP profiles were identified using bioinformatics processing of the sequencing data.
DNA extraction
Eight 6 mm diameter leaf discs were punched from 15 days old leaves and collected in 96 deep PCR plates. DNA extraction and sequencing of the plant material was performed by the Integrated Genotyping Support and Service (IGSS) of the Kenya-based International Livestock Research Institute (ILRI) hub (BecA-ILRI hub) using DArTseq™ technology from DArT (Diversity Arrays Technology Pty Ltd) in Australia. DArTseq™ represents a combination of DArT complexity reduction method and next generation sequencing platforms (Kilian et al., 2012; Altshuler et al., 2000). Compared to other similar approaches, DArTseq™ produces a lower marker density (10 thousand and up to 35,000 loci versus> 800,000 loci with a GBS approach) but has significantly higher coverage and results in less missing data (Chen et al., 2016). An additional advantage is that DArTseq™ can directly mark samples as heterozygous/homozygous at each locus with the lower density approach (Chen et al., 2016) and has the ability to produce multiple short, high-quality polymorphic loci using an analytical pipeline custom (Sansaloni et al., 2011; Raman et al., 2014; Al-Beyroutiova et al., 2016) facilitating the optimisation of species-specific projects in the platform.
Data filtering process and DArTseq SNP call
The DArTseq SNP-derived markers were filtered to eliminate less informative SNPs and genotypes using FlapJack software (Milne et al., 2010), where genotypes with more than 30% missing data, SNP loci with more than 20% missing data and rare SNPs with less than 5% minor allele frequencies (MAF) were pruned. Only 2677 informative DArTseq SNPs (out of 10,219) and 462 genotypes were considered after filtering and quality control of the data. The ICP value of SNPs is high when it is above 0.5 (ICP > 0.5), moderate when it varies between 0.25 and 0.5 (0.25 < ICP < 0.5) and low when it is below 0.25 (ICP < 0.25) (Botstein et al., 1980).
Construction of linkage maps and QTL detection
For the genotyping data, genotype, environment, and G × E were considered as random factors with a replicate nested in the environment and a block nested in the replicate and environment as a fixed factor. A combined analysis was performed by R using the agricultural package to fit the best linear unbiased prediction (BLUP) model for each genotype at both the Sérédou and Kilissi sites used in GWAS. Marker-trait associations were performed by a compressed linear mixed model implemented in Genome Association and Prediction Integrated Tool (GAPIT).
Analysis of molecular genetic diversity data
Genetix, FSTAT V2.9.3.2 and Darwin V6.0 software were used to assess the genetic parameters of the whole collection and the diversity according to collection areas (Kindia and Macenta) and species (Oryza sativa and Oryza glaberrima). GenAlex version 6.501 software was used to evaluate the genetic parameters of the entire collection. These are the average number of alleles per locus (At), the number of effective alleles (Ae), the polymorphism rate (P), the Shannon diversity index (I), the expected heterozygosity (He), the observed heterozygosity (Ho) and the polymorphism information content (PIC). The genetic differentiation index (Fst) was determined with the software FSTAT V2.9.3.2 and the Nei genetic distance between pairs of genetic groups were used to describe the interpopulation diversity. The structuring of the genetic diversity of the collection was carried out by the software DARwin version 6.0. Based on the genetic distance matrix estimated between individuals in the total population by Genetix software, local accessions were identified as potentially tolerant or resistant. Principal component analysis (PCA) was carried out using GenALEx software version 6.501 to identify the associations between the genetic groups obtained and finally to verify in the different groups, the local accessions that are tolerant or resistant to iron toxicity in relation to the resistant controls.
RESULTS
Identification of SNPs markers and study of genetic diversity
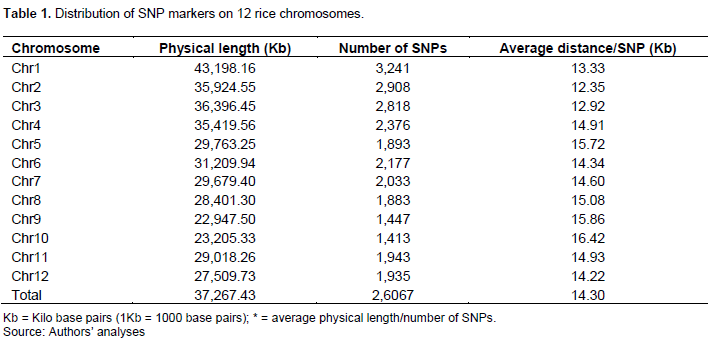
On the 12 chromosomes, 26,067 SNPs markers (Table 1) were detected with a number varying between 1,413 (Chr 10) and 3,241 (Chr 1). The average marker spacing was 14.3 Kb over the entire rice genome of 372,673.43 Kb. The extreme values ranged from one (1) SNP every 12.25 Kb on chro-mosome 2 to 1 SNP every 16.42 Kb on chromosome 10.
Selected markers and level of diversity of SNPs markers
The characteristics of selected SNPs markers and values of the genetic diversity parameters are recorded in Table 2. Of the SNP markers identified, only 70 SNPs that expressed a PIC value between 0.3 and 0.5 were retained for the genetic diversity study. These selected SNPs are distributed over all 12 rice chromosomes with a number of SNPs ranging from 02 (chr 9) to 11 (chr 2).
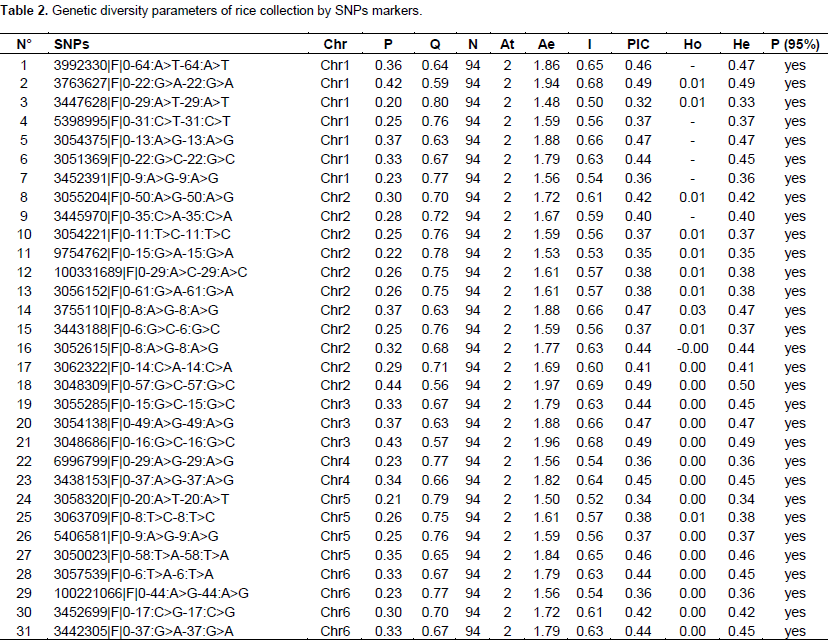
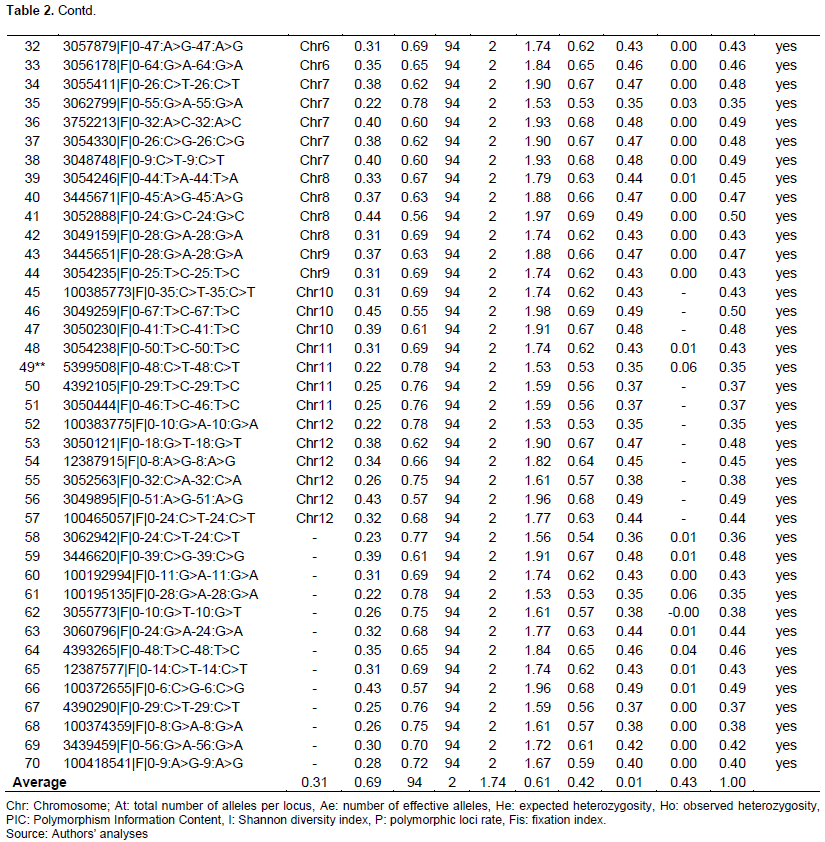
A total of 140 haplotypes with an average number of two per locus were detected (Figure 1). The genetic diversity of Nei (He) ranged from 0.33 (SNPs 3447628|F|0-29:A>T-29:A>T) to 0.5 (3048309|F|0-57:G>C-57:G>C) with an average of 0.43, respectively. The observed heterozygosity (Ho) was lower and ranged from 0 for SNP 3992330|F|0-64:A>T-64:A>T to 0.064 for SNP 5399508|F|0-48:C>T-48:C>T with a mean of 0.006. As for the Shannon diversity index (I), it expressed higher values ranging from 0.52 for the SNP marker 3058320|F|0-20:A>T-20:A>T to 0.69 for the markers 3049259|F|0-67: T>C-67:T>C. Polymorphism information content (PIC) ranged from 0.32 for the SNP marker 3447628|F|0-29:A>T-29:A>T to 0.49 for 3049259|F|0-67:T>C-67:T>C with a mean of 0.42. The fixation index or intrapopulation genetic differentiation (Fis), which is a measure of the difference between the population of individuals found in the observed heterozygous state (Ho) and the expected heterozygous (He) showed a relatively high positive value (0.98).
Structuring the genetic diversity of rice in Guinea
Comparison of accessions according to collection area
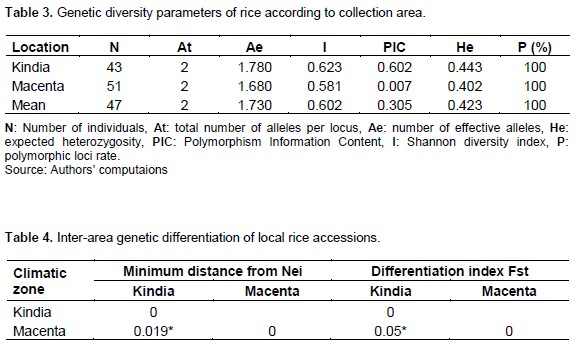
The values of the diversity parameters of accessions in the Kindia area are higher than those in the Macenta area (Table 3). Indeed, the Kindia area revealed an effective number of alleles of 1.78; an expected heterozygosity of 0.44; a Shannon index of 0.62% and a polymorphism information content of 0.60. However, in Macenta, an effective number of alleles of 1.68; an expected heterozygosity of 0.40; a Shannon index of 0.58, a polymorphism rate of 100% and a low polymorphism information content of 0.30 were recorded. The polymorphism rate of the SNPs loci is 100% for both areas. The Nei genetic distance and the estimated genetic differentiation index between the accessions of the two zones revealed significant differences between the local accessions of the zones (Table 4).
Comparison of accessions by species (O. sativa and O. glaberrima)
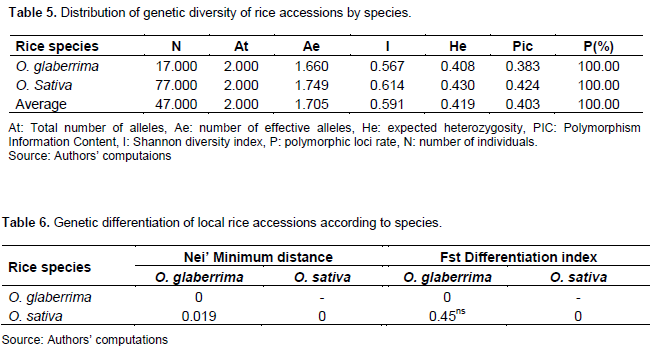
The values of the diversity parameters of the O. sativa species accessions are higher than those of the O. glaberrima species (Table 5). Indeed, Oryza sativa species revealed an effective number of alleles of 1.75; an expected heterozygosity of 0.43; a Shannon index of 0.61; a polymorphism rate of 100% and a polymorphism information content of 0.42. For O. glaberrima, the effective number of alleles was 1.66; expected heterozygosity, 0.41; Shannon index, 0.57; polymorphism information content, 0.38 and polymorphism rate of SNPs loci 100%. The genetic differentiation index revealed a significant difference between the two species (O. sativa and O. glaberrima) on tolerance and/or resistance to iron toxicity (Table 6). The genetic distance matrix between the species indicates a difference of 0.45 between O. sativa and O. glaberrima species. These relatively low values indicate that the species are genetically close in tolerance and/or resistance to iron toxicity.
Organisation of genetic diversity by markers and description of genetic groups
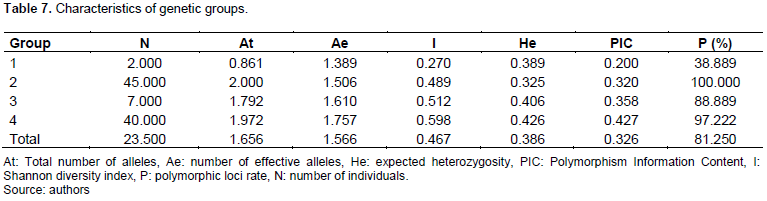
The estimated distances between individuals in the total population ranged from 0 to 0.56. Examination of the dendrogram of the total population (Figure 1) allows us to distinguish four distinct genetic groups (1, 2, 3, 4) at the threshold of the 5% confidence interval independent of the collection area and consisting, respectively of 2 accessions for group 1, 47 accessions for group 2, 7 accessions for group 3 and 40 accessions for group 4. Estimation of the genetic diversity parameters of the four identified genetic groups showed that a variation in the number of effective alleles from 1.389 (group 1) to 1.506 (group 2) and in the expected heterozygosity 0.325 for group 2 to 0.426 for group 4. The percentage of polymorphism was generally high except for group 1 which expressed the lowest rate of 38.889%. Finally, the Shannon diversity index and polymorphism information content ranged from 0.270 to 0.489 for groups 1 and 2 and from 0.512 to 0.598 for groups 3 and 4, respectively. In general, group 2 showed the highest values of diversity parameters, while groups 1 and 3 expressed the lowest values (Table 7).
Comparison of genetic groups
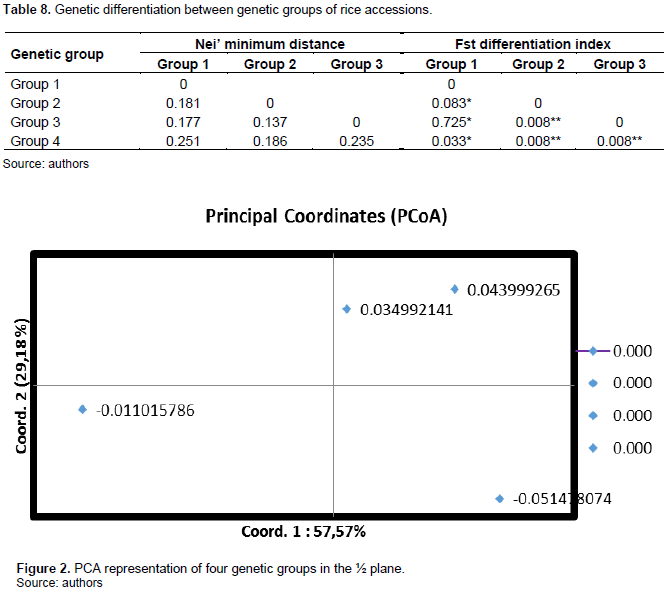
The average value of the intergroup differentiation index (Fst) is 0.14. Most of the total genetic variability (86%) is explained by intrapopulation variation. The genetic distances of 0.181 between genetic groups 1 and 2 and 0.177 between groups 2 and 3 (Table 8). These are relatively low. This would indicate that the accessions have a high genetic proximity. The Principal Coordinates Analysis (PCA) indicates that axis 1 (Coord.1) explains 57.57% of the total genetic variation, axis 2 (Coord.2) explains 29.18% and confirms that groups 2 and 3 are genetically close and axis 3 which explains 13.24% of the variability indicates that groups 1 and 4 are the most distant. These two groups would therefore be genetically more distant (Figure 2).
Identification of alleles associated with tolerance to iron toxicity
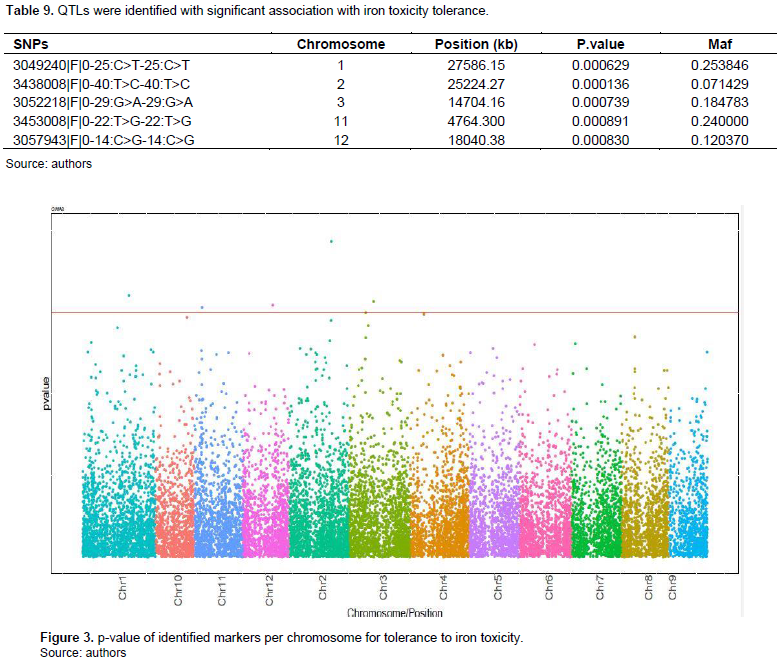
Of the 12 rice chromosomes, five chromosomes carry Quantitative Trait Locus (QTL) associated with tolerance to iron toxicity. These potentially influential QTLs are located on chromosomes 1, 2, 3, 11, and 12 (Table 9). The most significant SNP (3438008 | F |0-40: T> C-40: T>C) associated with tolerance is located on chromosome 2 at 25224.27 kb with a P-value of 0.000136 and followed by SNP 3049240 | F |0-25:C>T-25: C>T, which is located on chromosome 1 at 27586.15 kb (Figure 3).
DISCUSSION
Analysis of the genetic diversity of local Guinean rice accessions shows higher variability in O. sativa than in O. glaberrima. O. sativa is the most cultivated species with higher yields than O. glaberrima. O. glaberrima has completely disappeared in some regions such as East Africa (Bezançon, 1995). In contrast, the study revealed that it still occurs in Guinea to a considerable degree in the two study regions which are the rice granaries of Guinea. These results have already been reported by several authors (Second, 1985; Ghesquiere and Miezan, 1982; Barry et al., 2007) on a larger sample. A comparison of the average genetic diversity at common loci of the Guinea accessions with samples used elsewhere for other studies was made. These accessions are drawn from the collection of local rice varieties in Guinea and are assessed for iron tolerance through their yield. Yield is a parameter controlled by several genes corresponding to yield components. Thus, the use of resistant or tolerant controls and SNPs markers allowed the identification of iron-tolerant and iron-resistant rice accessions. Molecular characterisation of these local rice accessions (O. glaberriama and O. sativa) in Guinea revealed multiple traits in local accessions at the different study sites that define the yield increase and the tolerance of certain accessions to iron toxicity.
Furthermore, the markers used helped to identify the alleles of interest of these local accessions evaluated in Kindia and Macenta. This was further confirmed by the distribution of the accessions through the phylogenetic tree. Analysis of the dendrogram of the 96 local accessions shows a clustering of accessions by similarity in terms of Nei genetic distance. The 12 local rice accessions that were selected in both study sites all fall into the same group as the resistant control varieties. Groups 2 and 3 are the closest genetically. Group 4, on the other hand, is significantly further away from the other three groups 1, 2 and 3 with distances of 0.251, 0.186 and 0.235, respectively. The selected local accessions are predisposed to a more significant yield performance than other accessions that are in other groups to which they are similar. This could be explained by the additive effect of the different traits accumulated by the latter. However, the nature of these effects needs to be verified by agronomic data such as yield. In the same sense, Xiao et al. (1986) state that genetic distances obtained by RAPD or SSR markers can be useful in predicting the yield potential and heterosis of intraspecific species. However, the effect of the accumulation of several traits in a line is not clearly defined. The 70 validated SNP markers revealed diversity within the local rice accessions studied with a polymorphism rate of 100% at the 5% threshold. Previous works (Maravilla et al., 2017; Adeniji et al., 2012) reported higher or lower rates of 97 and 65.12%, respectively. The positive difference between the expected (0.44) and observed (0.064) heterozygosity and the higher positive value of the fixation index (Fis) (0.98) indicate a deficit of heterozygotes with an inbreeding coefficient of 2%, which indicates that the accessions collected in Kindia and Macenta prefectures are poor in heterozygous individuals. This high level of inbreeding could be explained by the preferentially self-pollinating mode of reproduction of rice.
According to Jordana et al. (2003), inbreeding modifies genotypic frequencies and the consequence is a loss of genetic variability over generations. The expected heterozygosity of 0.44 with an effective number of alleles ranging from 1.66 to 1.78 per locus and the genetic distances between accessions (0 to 0.56) reflect a relatively high genetic diversity of the collection of local rice accessions established in Kindia and Macenta prefectures. These differences can be explained by the genotypic diversity, the sample size, and the origin of the plant material. Indeed, the allelic richness of a population is known to depend on the sample size, since the chances of discovering a new allele increase each time a new individual is observed (Foulley and Ollivier, 2006). Similarly, according to (M’Hamed et al., 2008), the number of alleles per locus is affected by several factors such as genotype primer sequences and minor variations in amplification protocols. Moreover, according to Zhu et al. (2012), the diversity revealed in a collection is all lower when the markers used are developed on another species. Indeed, the SNPs markers used in this study were developed on local rice accessions and are therefore specific to these species (O. sativa and O. glaberrima). The influence of the climatic zone factor on the level and organisation of genetic diversity is very low. This low genetic differentiation between local accessions of the two prefectures is considered due to a large and continuous exchange of plant material between producers through weekly markets, population migration on the one hand, and the self-pollination rate (98%) of rice on the other. Similar results were reported by Barry (2006) in Guinea Maritime and revealed the existence of exchanges of planting material in different villages between families and acquaintances.
The analysis of the genetic diversity of O. sativa and O. glaberrima accessions using tested and validated SNPs markers has shown their effectiveness in revealing polymorphisms within rice. These SNPs markers tested and validated in this study are potential markers for the study of the genetic diversity of rice at the national, subregional and even international levels with a view to preserving and enhancing these species (O. sativa and O. glaberrima) which are well exploited throughout the world for a breeding programme and comparison of entities within collections. It also revealed the existence of a distribution of accessions into genetic groups based on tolerance and/or resistance to iron toxicity. Genetic structuring is much more determined by the collection area factor and by the species factor (O. glaberrima and O. sativa). Finally, five QTLs associated with tolerance to iron toxicity have been also identified on chromosomes 1, 2, 3, 11 and 12. Furthermore, Nugraha et al. (2016) identified TBGI380435 located on 14.45 Mbp of chromosome 9 as associated to leaf bronzing and relative shoot weight characters. A major QTL for salt tolerance named Saltol was mapped on chromosome 1 (Mohammadi-Nejad et al., 2008).
CONCLUSION
The study highlighted significant genetic diversity within local rice accessions grown in the Republic of Guinea. The diversity is organised in four genetic groups and allowed the detection of 12 accessions potentially tolerant to iron toxicity. Five markers linked to iron toxicity were also identified.
CONFLICT OF INTERESTS
The authors have not declared any conflict of interests.
ACKNOWLEDGEMENTS
The authors thank the research staff of the Bioscience Laboratory of the UJKZ of Ouagadougou for reading and correcting this manuscript and the WAAPP (PPAAO) for its financial support and IRAG for ITS institutional support.
REFERENCES
|
Abifarin AO (1988). Grain yield loss due to iron toxicity. WARDA Technical Newsletter 8(1):1-4. |
|
|
Abifarin AO (1989). Progress in breeding rice for tolerance to iron toxicity. WARDA Annual Report pp. 34-39. |
|
|
Adeniji OT, Kusolwa P, Reuben OWMS, Deo P (2012). Molecular diversity among seven Solanum (eggplant and relatives) species assessed by simple sequence repeats (SSRs) markers. African Journal of Biotechnology 11(90):15643-15653. |
|
|
Aghaee A, Moradi F, Zare-Maivan H, Zarinkamar F, Irandoost HP, Sharifi P (2011). Physiological responses of two rice (Oryza sativa L.) genotypes to chilling stress at seedling stage. African Journal of Biotechnology 10(39):7617-7621. |
|
|
Ahmed H, Tetteh Anang B, Anang BT (2019). Impact of improved variety adoption on farm income in Tolon district of Ghana. Agricultural Social Economic Journal 19(2):105-115. |
|
|
Al-Beyroutiova M, Sabo M, Sleziak P, Dusinsky R, Bircak E, Hauptvogel P, Kilian A, Sié M (2016). Evolutionary relationships in the genus Secale revealed by DArTseq DNA polymorphism. Plant Systematics and Evolution 302(8):1083-1091. |
|
|
Altshuler D, Pollara VJ, Cowles CR, Van Etten WJ, Baldwin J, Linton L, Lander ES (2000). An SNP map of the human genome generated by reduced representation shotgun sequencing. Nature 407(6803):513-516. |
|
|
ANASA (2012). National Agency for Agricultural and Food Statistics. Summary report Conakry, Republic of Guinea 11 p. |
|
|
Anderson MS, Schultze-Kraft R, Peters M, Hincarpie B, Lascano CE (2006). Morphological, agronomic and forage quality diversity of the Flemingia macrophylla world collection. Field Crops Research 96(2-3):387-406. |
|
|
Ara I, Lewis M, Ostendorf B (2017). Understanding the spatially variable effects of climate change on rice yield for three ecotypes in Bangladesh, 1981-2010. Advances in Agriculture 11p. |
|
|
Balasubramanian V, Sie M, Hijmans RJ, Otsuka K (2007). Increasing rice production in sub-saharan Africa: challenges and opportunities. Advances in Agronomy 94:55-133. |
|
|
Barry MB (2006). Diversity and dynamics of local varieties (O sativa, O Glaberima) in Guinea, Consequences for the of genetic resources' Doctorat thesis, National Hight School Agronomic of Rennes, France 158 p. |
|
|
Barry MB, Pham J, Noyer J, Billot C, Courtois B, Ahmadi N (2007). Genetic diversity of the two cultivated rice species (O. sativa &O. glaberrima) in Maritime Guinea. Evidence for interspecific recombination. Euphytica 154(1):127-137. |
|
|
Barry ML (2020). Caractérisation de variétés traditionnelles de riz cultivées (Oryza sp.) en Guinée et identification de génotypes tolérants à la toxicité ferreuse. Université Joseph Ki-Zerbo, Ouagadougou, Burkina Faso, Mémoire Thèse Doctorat unique. |
|
|
Barry ML, Sawadogo N, Ouédraogo MH, Nanéma KR, Barry MB, Bationo-Kando P, Sawadogo M (2019a). Effect of Silica on Rice Agromorphological Diversity Under Iron Toxicity Conditions in Lowland Rice of Guinea Conakry. European Scientific Journal 15(3):118-130. |
|
|
Barry ML., Nanema KR, Tiendrebéogo KF, Sawadogo N, Ouedraogo MH, Barry MB, Bationo-Kando P, Sawadogo M (2019b). Prospecting Collection and Ethnobotanical Studies of Traditional Rice Varieties in Guinea. International Journal of Current Microbiology and Applied Sciences 8(12):809-825. |
|
|
Becker M, Asch F (2005). Iron toxicity in rice-conditions and management concepts. Journal of Plant Nutrition and Soil Science 168(4):558-573. |
|
|
Bezançon G (1995). Riziculture traditionnelle en Afrique de l'Ouest: valorisation et conservation des ressources génétiques. Journal D'agriculture Traditionnelle et de Botanique Appliquée 37(2):3-24. |
|
|
Botstein D, White RL, Skolnick M, Davis RW (1980). Construction of a genetic linkage map in man using restriction fragment length polymorphisms. American Journal of Human Genetics 32(3):314-331. |
|
|
Chen J, Zavala C, Ortega N, Petroli C, Franco J, Burgueno J, Costich DE, Hearne SJ (2016). The development of quality control genotyping approaches: a case study using elite maize lines. PloS One 11(6):e0157236. |
|
|
CILSS/FAO/MA (2012). Rapport Conjoint pour l'évaluation finale de la campagne agricole en Guinée, Conakry, République de Guinée 43p. |
|
|
FAO (2017). Suivi du Marché du Riz (SMR). Rapport, Volume XX, Ed 1, 10. |
|
|
Foulley JL, Ollivier L (2006). Genetic diversity and allelic richness: concepts and application to cattle breeds. In: Thirteenth meeting on ruminant research, 6-7 December 2006, Paris, France pp. 227-230. |
|
|
Ghesquiere A, Miezan K (1982). Study of the genetic structure of traditional rice varieties in Africa. ORSTOM-IRAT meeting from 1 to 3 Sept. 1982, report. Multigr. ORSTOM. 31 p. |
|
|
Hirschhorn JN, Daly MJ (2005). Genome-wide association studies for common diseases and complex traits. Nature Reviews Genetics 6(2):95-108. |
|
|
Islam AF, Ali MR, Gregorio GB, Islam MR (2012). Genetic diversity analysis of stress tolerant rice (Oryza sativa L.). African Journal of Biotechnology 11(85):15123-15129. |
|
|
Jordana J, Alexandrino P, Beja-Pereira A, Bessa I, Canon J, Carretero Y, Dunner S, Laloe D, Moazami-Goudarzi K, Sanchez A, Ferrand N (2003). Genetic structure of eighteen local South European beef cattle breeds by comparative F- statistics analysis. Journal of Animal Breeding and Genetics 120(2):73-87. |
|
|
Kapoor C, Avasthe RK, Chettri PK, Gopi R, Kalita H, Rao DS, Babu VR (2019). Morphometric, Physico-chemical and Micronutrient Characterization of Rice (Oryza sativa L.) Landraces of Sikkim Himalayas. Indian Journal of Plant Genetic Resources 32(3):327-339. |
|
|
Kilian A, Wenzl P, Huttner E, Carling J, Xia L, Blois H, Caig V, Heller-Uszynska K, Jaccoud G, Hopper D, Aschenbrenner-Kilian C, Evers M, Peng M, Cayla K, Hok C, Uszynski P (2012). Diversity Arrays Technology: a generic genome profiling technology on open platforms. In: Popmanon F, Bonin A., editors. Data production and analysis in population genomics, methods and protocols. New York: Springer 888:67-89. |
|
|
Kirby M, Ahmad MUD, Mainuddin M, Khaliq T (2017). Agricultural production, water use and food availability in Pakistan: historical trends, and projections to 2050. Agricultural Water Management 179:34-46. |
|
|
M'Hamed HC, Abdellaoui R, Kadri K, Naceur MB, Hadj SB (2008). Evaluation de la tolérance au stress salin de quelques accessions d'orge (Hordium vulgare L.) cultivées en Tunisie:approche physiologique. Sciences and Technologie. C, Biotechnologies 28:30-37. |
|
|
Mahender A, Swamy B, Anandan A, Ali J (2019). Tolerance of iron-deficient and toxic soil conditions in rice. Plants 8(2):1-34. |
|
|
Maravilla AMB, Ocampo ETM, Canama AO, Delfin EF (2017). Hybridity Testing of Eggplant F1 Progenies Derived from Parents with Varying Response to Drought Using SSR Markers. Philippine Journal of Science 146(3):277-286. |
|
|
Masajo TM, Alluri K, Abifarin AO, Janakiram D (1986). Breeding for high and stable yields in Africa. In: the wetlands and rice in subsaharian Africa (Eds.) ASR. Juo, JA. Lowe Ibadan, Nigeria pp. 107-114. |
|
|
Matthus E, Wu LBW, Höller Y, Becker SS, Michael MF (2015). Loci, genes, and mechanisms associated with tolerance to ferrous iron toxicity in rice (Oryza sativa L.). Theoretical and Applied Genetics 128(10):2085-2098. |
|
|
Milne I, Bayer M, Cardle L, Shaw P, Stephen G, Wright F, Marshall D (2010). Tablet-next generation sequence assembly visualization. Bioinformatics 26(3):401-402. |
|
|
Mohammadi-Nejad G, Arzani A, Reza AM, Singh RK, Gregorio GB (2008). Assessment of rice genotypes for salt tolerance using microsatellite markers associated with the saltol QTL. African Journal of Biotechnology 7(6):730-736. |
|
|
Moorman FR, Van Breeman N (1978). In Rice: Soil, water and land (IRRI, Philippines) 185 p. |
|
|
Myers N, Mittermeier RA, Mittermeier CG, da Fonseca GAB, Kent J (2000). Biodiversity hotspots for conservation priorities. Nature 403(6772):853-858. |
|
|
Nugraha Y, Utami DW, Rosdiant I, Ardie SW, Ghulammahdi M, Suwarno, Aswidinnoor H (2016). Markers-traits association for iron toxicity tolerance in selected Indonesian rice varieties. Biodiversitas 17(2):753-7630. |
|
|
Ogunbayo SA, Ojo DK, Guei RG, Oyelakin OO, Sanni KA (2005). Phylogenetic diversity and relationships among 40 rice accessions using morphological and RAPDs techniques. African Journal of Biotechnology 4(11):1234-1244. |
|
|
Onyango DA, Entila F, Dida MM, Ismail AM, Drame KN (2019). Mechanistic understanding of iron toxicity tolerance in contrasting rice varieties from Africa: 1. Morpho-physiological and biochemical responses. Functional Plant Biology 46(1):93-105. |
|
|
Raman H, Dalton?Morgan J, Diffey S, Raman R, Alamery S, Edwards D, Batley J. (2014). SNP markers?based map construction and genome?wide linkage analysis in Brassica napus. Plant Biotechnology Journal 12(7):851-860. |
|
|
Rasheed A, Fahad S, Hassan MU, Tahir MM, Aamer M, Wu ZM (2020). A review on aluminum toxicity and quantitative trait loci mapping in rice (Oryza sativa L). Applied Ecology and Environmental Research 18(3):3951-3961. |
|
|
Sajib AM, Hossain MM, Mosnaz ATMJ, Hossain H, Islam MM, Ali MS, Shamsul H. Prodhan SH (2012). SSR marker-based molecular characterization and genetic diversity analysis of aromatic landreces of rice (Oryza sativa L.). Journal of BioScience & Biotechnology 1(2):107-116. |
|
|
Sansaloni C, Petroli C, Jaccoud D, Carling J, Detering F, Grattapaglia D, Kilian A (2011). Diversity Arrays Technology (DArT) and next-generation sequencing combined: genome-wide, high throughput, highly informative genotyping for molecular breeding of Eucalyptus. BMC Proceedings 5(7):1-2. |
|
|
Second G (1985). Relations évolutives chez le genre Oryza et processus de domestication' ORSTOM, Paris, Paris, collection étude et thèses 189 p. |
|
|
Selvaraj CI, Nagarajan P, Thiyagarajan K, Bharathi M, Rabindran R (2011). Genetic parameters of variability, correlation, and path coefficient studies for grain yield and other yield Attributes among rice blast disease resistant genotypes of rice (Oryza sativa L.). African Journal of Biotechnology 10(17):3322-3334. |
|
|
Service National des statistiques Agricoles (SNSA) (2010). Rapport national, Conakry, République de Guinée 11 p. |
|
|
Tagu D, Moussard C (2003). Principles of techniques of molecular biology. Ed. 2. |
|
|
Xiao J, Li J, Yuan L, McCouch SR, Tanksley SD (1996). Genetic diversity and its relationship to hybrid performance and heterosis in rice as revealed by PCR-based markers. Theoretical and Applied Genetics 92(6):637-643. |
|
|
Xu X, Liu X, Ge S, Jensen JD, Hu F, Li X, Dong Y, Gutenkunst RN, Fang L, Huang L, Li J, He W, Zhang G, Zheng X, Zhang F, Li Y, Yu C, Kristiansen K, Zhang X, Wang J, Wright M, McCouch S, Nielsen R, Wang J, Wang W (2012). Resequencing 50 accessions of cultivated and wild rice yields markers for identifying agronomically important genes. Nature Biotechnology 30(1):105-111. |
|
|
Zhu XC, Wu HW, Raman H, Lemerle D, Stanton R, Burrows GE (2012). Evaluation of simple sequence repeat (SSR) markers from Solanum crop species for Solanum elaeagnifolium. Weed Research 52(3):217-223. |
|
Copyright © 2024 Author(s) retain the copyright of this article.
This article is published under the terms of the Creative Commons Attribution License 4.0


