ABSTRACT
Land use-land cover (LULC) is a vital phenomenon for the understanding interactions between the environment and human activities. In order to study and manage the resultant changes, it is pertinent to map different themes from time to time. The study focuses on the effect of the location of cement factory on land use-land cover in Obajana Community, Lokoja Local Government Area Kogi, Nigeria. The study employed supervised digital image classification method using Arc GIS 10.2 and ILWIS 3.3 Academic to classify the area into bare surface/degraded area, built-up area, vegetation and water body. The study revealed that changes have occurred within the period, 2005 to 2015; vegetal cover decreased by -19.2 km2 (49.74%), built-up area has increased by 2.1 km2 (5.44%). Bare surface/degraded area increased by 2.1 km2 (5.44%). A decrease of -0.1 km2 representing -0.26% was observed in the water body. It is therefore, recommended that land use land cover changes should be monitored at an interval of ten to fifteen years not only for urban planning purposes but to improve and manage land and land resources in a sustainable way.
Key words: Land use, land cover, change detection, image classification, urban growth.
Cities are dynamic, this is because changes are inevitable. Kafi et al. (2014) stated that these changes can be attributed to one factor or the other depending on the socio economic, political and climatic condition of a given area. Due to physical development activities, the earth surface is being gradually altered in some manner and man’s presence on the earth and his use of land has had a profound effect on the natural environment, thus resulting in an
observable change in the land use-land cover (LULC) over time (Sreenivasulu et al., 2014).
Tripathi and Kumar (2012), in their study of Remote Sensing Based Analysis of Land use land cover Dynamics in Takula Block, Almora District India, employed Landsat- 5 TM (Thematic Mapper) and Landsat 7 ETM + (Enhanced Thematic Mapper Plus) data. These data sets were imported in ERDAS Imagine version 9.1. The dominant change which occurred in the study area is the croplands which were 13.48% in 1990 and increased to 21.47% in 2005. Analysis of their findings revealed a change of 7.99% in croplands which is attributed to increasing demand of cropland to fulfill the increasing need of foods in the study
area.
Similarly, Manish and Ahmed (2010) worked on changes in land use pattern due to mining in Faridabad, using Landsat MSS of 1970 and IRS-P6 of 2006. Ancillary data such as Toposheet 1:50,000 were used for preparing base map and to create DEM. ArcGIS 9.2 and ERDAS 9.1 software were also used for geographical analysis, integration and presentation of the spatial and non-spatial data for change detection over a period of 35 years. It was found out that surface water bodies depleted at faster rate.
Sreenivasulu et al. (2014) carried out land use land cover analysis in and around Rajampet in Kadapa District, Andhra Pradesh, India using remote sensing and GIS. The study employed satellite images, ArcGIS 9.2, ERDAS IMAGINE 9.1, toposheets and satellite imageries. Analysis of the study reveals that there is a fast shrinkage of water bodies and marshy areas and the town is witnessing rapid transformation of land from agriculture to residential.
Also, Praveen and Jayarama, (2013) analyzed land used land cover changes using remote sensing data and GIS, the study was carried out using topographic map and remote sensing data. The study revealed that vegetation cover in the area has largely decreased from 68.23 km2 in 1976 to 21.45 km2 in 2003, with net decrease of 46.78 km2. The area also witnessed agricultural land conversion to settlements and other urban development activities. Water spread area, both man-made and natural water features such as rivers/streams, tanks and reservoirs, also decreased from 12.09 km2 in 1976 to 9.91 km2 in 2003, with net decline of 2.18 km2.
Rawat et al. (2015) used remote sensing and GIS to monitor land use-land cover change, using 30 m image resolution of Landsat Thematic Mapper of 1990 and 2010 for classification. The images were gotten from Global Land Cover Facility (GLCF) and earth explorer site and were imported in ERDAS Imagine version 9.3. Satellite image processing software was used to create a False Colour Composite (FCC). To work out the land use land cover classification, supervised classification method with maximum likelihood algorithm was applied in the ERDAS Imagine 9.3 Software. The result shows significant loose of forest and monumental increase in built up areas and a corresponding decrease in forestry and agricultural land.
A study by Duncan et al. (2009) on open pit gold mining and land use changes in Bogosu-Prestea area, S
outh West Ghana due to mining over a twenty year period (1986 – 2006) was analyzed within the Golden Star Resources Bogoso Prestea Limited (GSRBPL) concession. The study revealed that mining in the area increased by 12.1% in land coverage with decrease in agricultural land use from 97.8% in 1986 to 82.7% in 2006. Settlements increased from 0.45% in 1986 to 4.95% in 2006 due to a rural-urban migration.
Similarly, Chitade (2010) carried out an impact analysis of open cast coal mines of Chandrapur district on LULC using remote sensing and GIS technique. The study was conducted using multi-temporal satellite data (IRS-P5 data of 2009 and 2010 and Landsat-5 data of 1990) to create a LULC mapping of the area; and reported a 67% increase in mine activities in the area. Daniel and Ayobami (2007) conducted Mapping and LULC change detection using remote sensing and GIS techniques in south west Nigeria. An area of 9558.58 km2 was delineated on the Landsat scene covering the study area. The LULC mapping for the area was based primarily on Landsat 5 Thematic Mapper (TM) of December 1986 and Landsat 7 Enhanced Thematic Mapper (ETM) data of January 2002. The images were geometrically corrected to Universal Transverse Mercator (UTM) coordinate system. Their findings revealed that disturbed/degraded forest constituted the most extensive type of LULC in the study area. Accordingly, it accounted for about 49.6% of the total area in 1986, followed by high forest and derived savanna, occupying 30.6 and 12.6% of the total area, respectively. Between 1986 and 2002, the area witnessed significant settlement expansion and illegal logging, leading to further land use change.
Rawat, et al. (2013) carried out research on changes in LULC using geospatial techniques and supervised classification method. For better classification of results, some indices such as normalized difference vegetation index (NDVI), normalized difference water index (NDWI) and normalized difference built-up index (NDBI) were applied to classify the Landsat TM images at a resolution of 30 m of 15th November, 1990 and 2010. Five LULC types were identified and used in this study. They are built-up land, vegetation cover, agricultural land, water body and sand bar. Findings revealed that during the last two decades, the built-up area has increased from 1.25 km2 in 1990 to 4.08 km2 in 2010 which accounts for 8.88% of the total sprawl area. The vegetation cover has decreased from 10.29 km2 in 1990 to 7.29 km2 in 2010.
Kafi et al. (2014) analyzed LULC change detection using remotely sensed data in Bauchi city. They carried out the study grouping the various land use types into five: Wet land, farm land, shrub/grass, built up area and ditches/rocks. Image classification was done using supervised and unsupervised classification. Unsupervised classification was carried out using the 6 bands of multi date images in order to classify the image into clusters. Findings revealed that all the classes except farm land have increased over the years, with the built up area accounting for over 38% from 2003 to 2013. It was also found that the expansion of Bauchi city is more concentrated in the north eastern and South Western part of the city. This they attributed to the newly constructed estates that attracted other construction activities around the north eastern part, and also location of higher institutions around the south western part of the city.
Oluseyi (2006) performed urban land use change analysis of metropolitan city of Ibadan within the periods of 1972 and 2003 and discovered that the land use types that are subject to major changes are vegetal covers and sprawl development. It was also observed that development in Ibadan is similitude of the building types in the tradition core and the transition zones. Beside the city was growing at such an alarming rate using up the green and other forms of soft landscape in the city. Ujoh et al. (2011) analyzed urban expansion and vegetal cover loss in and around Abuja with the use of Landsat imageries of 1987, 2001 and 2006. The study revealed that while built-up area increased, vegetation cover decreased at an alarming rate. Using population figures of the study area for 1987, 2001 and 2006, the land consumption rate (LCR) and land absorption coefficient (LAC) were determined. Increasing population and expansion in the Federal Capital City (FCC) resulted in land degradation including loss of vegetal cover, indiscriminate waste disposal and contamination of surface water.
Ekpenyong (2008) used the GIS database to model the LULC change between 1984 and 2003 for Akwa Ibom State. The result shows that some urban centres had expanded into farmlands/fallow lands and the surrounding secondary forest. Within that period, mangrove forest had reduced by 50%. Other forest covers in the area also changed, thereby threatening food security and climate among others.
Olokeogun et al .(2014) in their study on application of remote sensing and GIS in LULC mapping and change detection in Shasha forest reserve, Nigeria, used the Landsat 1986 and 2004 satellite images of the study area at 30 m resolution and a boundary map of Shasha Forest Reserve with scale 1:350, 000. The research found out that settlement expansion, subsistence farming and illegal logging are the major factors behind the LULC changes observed in the area. They however advised on the need for comprehensive assessment of human activities and adaptation of sustainable forest management.
Even though many researches have been carried out around the world on the use of remote sensing and GIS in monitoring and assessing the effect of mining activities of various environmental components within mining regions, reviewed literatures have shown that much emphasis has been laid generally on LULC changes as well as on the health challenges of people around mining areas.
This
research therefore, assesses the effect of the location of cement factory on land use land cov
er in Obajana community, Lokoja Local Government Area Kogi, Nigeria. The objectives of this study include to:
1. Assess the land use land cover distribution in Obajana.
2. Assess the aerial extent of the land use land cover between 2000 and
2015.
3. Determine the magnitude of change in the land use land cover distribution.
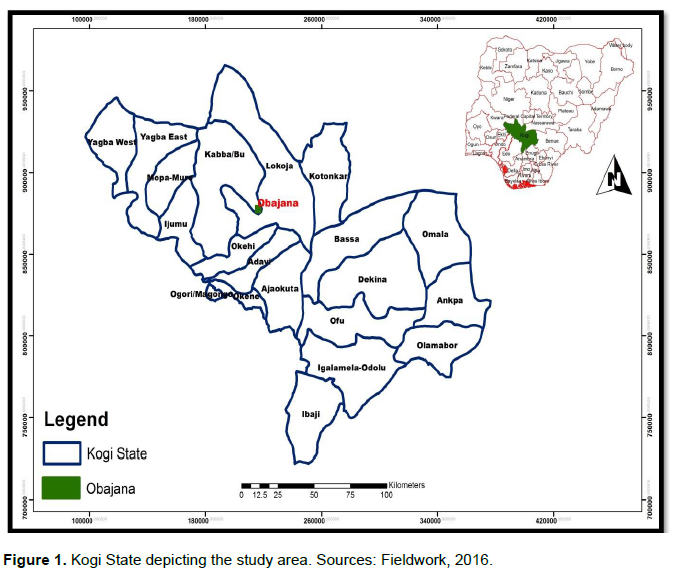
Location of the study area
Obajana is a very small but very important community in Kogi State, north central Nigeria. It is part of Lokoja Local Government Area and is home to the famous Dangote cement factory, rated as the largest in Africa. Obajana can be assessed both by road and by air transport as it has two functional roads and a landing stip
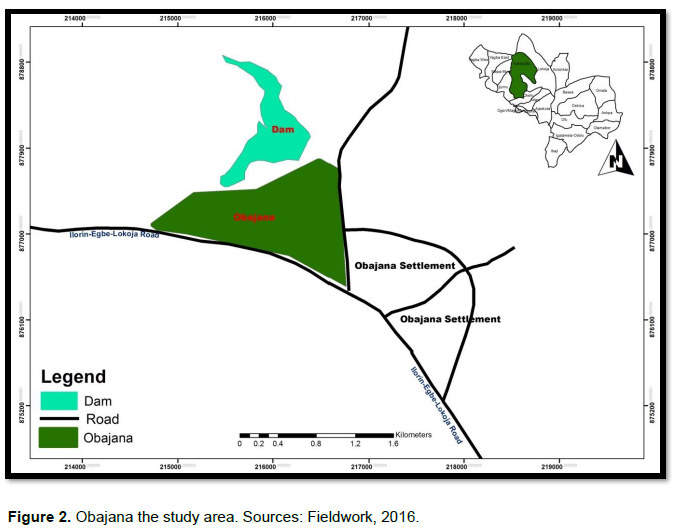
. Obajana lies within longitude 6°24'E to 6°27'E and latitude 7°54'N to 7°56'N. It has an undulating surface which gently slopes downward southwest-northeast trend (Figures 1 and 2
The research made use of the Integrated Land, Water Information System (ILWIS 3.3 Academic), ArcGIS 10.2 and the
Statistical Package for Social Science (SPSS). ILWIS 3.3 academic was use for band combination, image classification and to calculate the normalize differential vegetation index (NDVI) of Obajana. ArcGIS 10.2 was used to clip the boundary of the study area and calculate the area in square kilometer of the resulting land use land cover classes for each study year. The comparison of the land use land cover statistics assisted in identifying the percentage change, trend and rate of change between 2000 and 2015.
Three bands were used to form the false colour composite for this study. These bands are 4, 3 and 2. The bands were combined in ILWIS 3.3 academic using the ''New Map List'' tool found on the operation list.
On each of the satellite images in question (2000, 2005 and 2015), the area of interest that is the study area, were "Clipped out" using the X,Y coordinates of a point on the right upper corner and the X,Y, coordinates of another point on the left Lower corner. This task was also performed on ILWIS 3.3 academic. Sample sets were then created for all the images; built-up area, degraded land, vegetation and water body.
The images were subjected to a supervised classification using the maximum likelihood. This task was performed using the classifier tool on the operation list of ILWIS 3.3 academic. The area of each sample set was determined in square kilometers. The classified images were exported to ArcGIS 10.2 software where the boundary area of Obajana was "Clipped".
Land use land cover change distribution of Obajana (2000-2015)
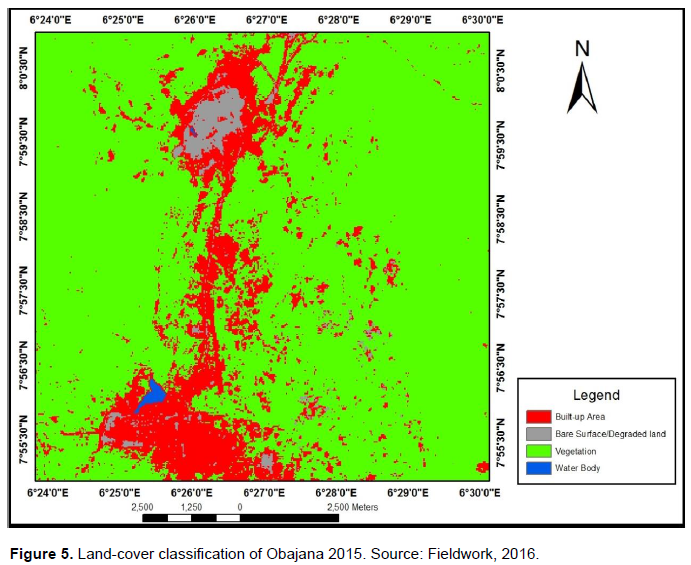
In line with the objectives of the study, geographic information system techniques were employed to identify and map the land use land coverof Obajana over a period of 15 years. The LULC maps are presented in Figures 3, 4 and 5 for 2000, 2005 and 2015, respectively. They show the extent of the land use land cover change. Aerial extents measured in kilometer square (km2) and the corresponding percentages of coverage are presented in Tables 3 and 4 for 2000, 2005 and 2015 respectively. The classes of land use land cover identified are:
i. Bare surface/degraded land
ii. Built-up area
iii. Water body
iv. Vegetation
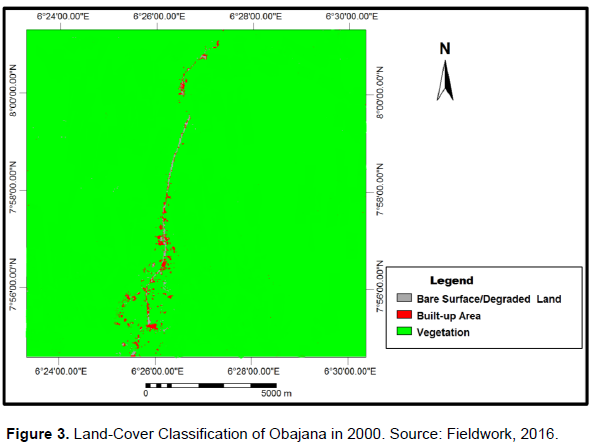
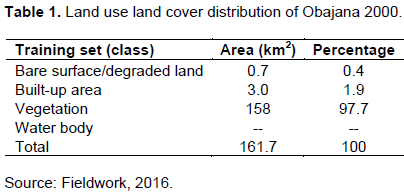
Land use land cover distribution of Obajana 2000
Result presented in Figure 3 reveals that in 2000, greater part of the study area was made up of vast vegetation with scanty built up area and degraded land/bare surface. Table 1 shows that vegetation accounted for 157.8 km2 (97.7%), whereas built up area and bare surface/degraded land covered 3.0 (1.9%) and 0.7 km2 (0.4%), respectively. It has been observed that there was no visible sign of water bodies in the study area. The dominance of vegetal cover could be attributed to wide spread of agricultural practice in the study area before the discovery of limestone deposit and subsequent establishment of the cement industry.
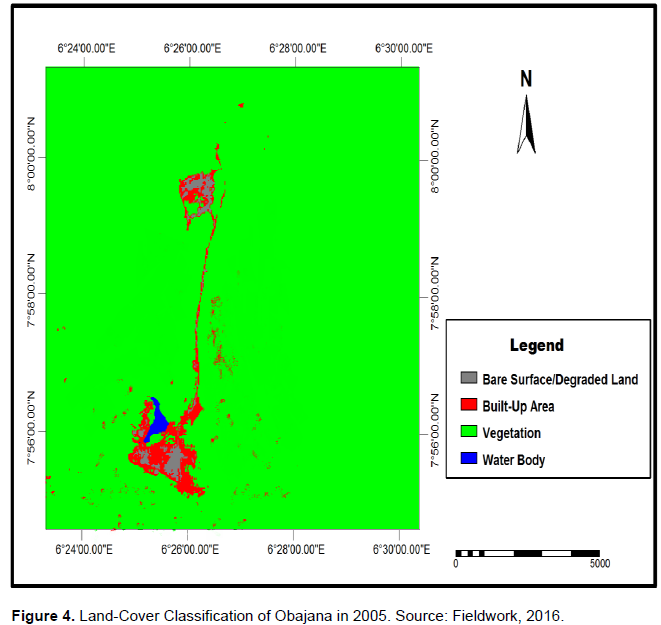
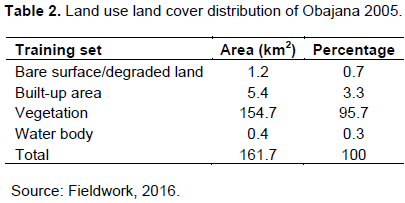
Land use land cover distribution of Obajana 2005
The five year period between 2000 and 2005 witnessed increases in activities both in the basic and non-basic sectors due to proposed establishment of the cement industry in the study area. This therefore, resulted in an increase in the built up area from 3.0 km2 (1.9%) in 2000 to 5.4 km2 (3.3%) in 2005. However, the period experienced a decrease in the size of vegetation from158 km2 (97.7%) in the year 2000 to 154 km2 (95.7%) in 2005. Besides, the degraded area/bare surface increased from 0.7 km2 (0.4%) in 2000 to 1.2 km2 (0.7%) in 2005. It has been observed that within the five year period, water body has emerged occupying 0.4 km2 (0.3%) in form of a dam constructed to serve the cement industry (Table 2).
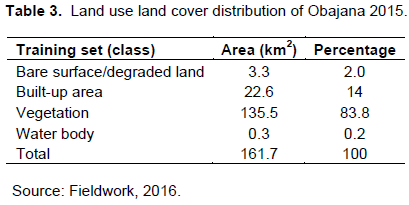
Land use land cover distribution of Obajana 2015
Upon completion of the largest cement factory, the settlement of Obajana had transformed from a small rural agrarian based community into a cement manufacturing destination rated as the largest in Africa. Results presented in Figure 5 and Table 3 therefore, showed that built up area increased from 5.4 km2 (5.4%) in 2005 to 22.6 km2 (14%) in 2015. As a result of the increase in socio economic development, the vegetation steadily declined from 154.7 km2 (95.7%) in 2005 to 135.5 km2 (83.8%) in 2015. There is also an increase observed in Bare surfaces/degraded area from 1.2 km2 (0.7%) in 2005 to 3.3 km2 (2.0%) in 2015. However, water body reduced from 0.4 km2 (0.3%) in 2005 to 0.3 km2 (0.2 %) in 2015.
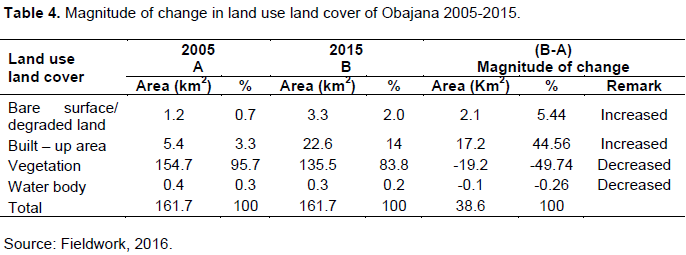
Magnitude of change in land use land cover of Obajana 2005-2015
It has been observed that significant changes have occurred in the land use land cover classes within the 10 year period manifested in the form of increase or decrease in sizes. Result presented in Table 4 shows magnitude of change that have occurred in the classes in terms of aerial extent measured in kilometer square (km2) with corresponding percentages of coverage.
Built- up area
It has been observed that the built -up area covering 5.4 km2 (3.3%) in 2005 has increased to 22.6 km2 (14%) in
2015, thereby recording a total increase of 2.1 km2 (5.44%). The observed change implies that physical development has taken place as a result of socio economic changes brought about by the operation of the cement factory.
Bare surface/degraded area
This class recorded an increase of 2.1 km2 (5.44%) within
the 10 year period. In 2005, it occupied 1.2 km2 (0.7%) and further increased to 3.3 km2 (2.0%). The observed increase can be attributed to socio-economic growth and development witnessed in the study area.
Vegetation
The vegetal cover has indicated a significant change of the highest among all other categories with a decrease of -19.2 km2 (-49.74%). Vegetation occupied 154.7 km2 (95.7%) in 2005 and further decreased to 135.5 km2 (83.8%) in 2015. Site clearing for construction purposes to soothe socio-economic development can be attributed to the observed decrease.
Water body
It has also been noticed that the only water body in form of a dam in the area occupying 0.4 km2 (0.3%) in 2005 decreased by -0.1 km2 (0.26%), following a decrease of 0.3 km2 (0.2%) in 2015. The observed decreased can be attributed to natural dry up, thereby forming suitable sites for appropriate development purposes.
CONCLUSION AND RECOMMENDATIONS
The research has shown that the major land use land cover classes in Obajana; bare surface/degraded land, built-up area, vegetation and water body have witnessed changes within the ten years period studied. The research has demonstrated that remote sensing and geographic information system (GIS) can be very good tool for mapping, tracking urban expansion and detecting land use land cover
changes. Settlement expansion due to operational activities of the cement industry is the major factor behind the land use land cover changes observed in the area. In order to achieve sustainability in growth and development of the land use land cover of Obajana, the following recommendations are made:
1.
Environmental impact assessment (EIA) study should be carried out on the cement industry in Obajana, to have firsthand information on the impact of the plant on the host community’s land use land land cover. Once the EIA is done and areas of impact identified, then a comprehensive master plan or development plan should be developed based on the environmental management plan (EMP) of the EIA to guide pattern and direction of future de
velopment.
2. Land use land cover changes should be monitored at an interval of ten to fifteen years not only for urban planning purposes, but for improving and managing land use and land resources in a sustainable way.
3. Adaptation of sustainable vegetal cover management practices such as close supervision of agricultural and forest reserves and making more arable lands available through restoration of already degraded and improvised
lands.
The authors declare that there is no conflict of interests.
REFERENCES
|
Chitade AZ, Katyar SK (2010). Impact analysis of open cast coal mines on Land use land cover using remote sensing and GIS technique: a case study. Int. J. Eng. Sci. Technol. 2(12):7171-7176.
|
|
|
|
Daniel AM, Ayobami TS (2007). Application of remote sensing and GIS inland use/land cover mapping and change detection in a part of south western Nigeria. Afr. J. Environ. Sci. Technol. 1(5):099-109.
|
|
|
|
|
Duncan EE, Kuma JS, Frimpong S (2009). Open pit mining and land use changes: an example from Bogosu-Prestea area, South West Ghana. Electron. J. Inform. Syst. Dev. Countr. P 36.
|
|
|
|
|
Ekpenyong RE (2008). Analysis of findings from the Akwa Ibom State LULCchange early warning system. Nigerian. J. Geogr. Environ. 1(1):68 -76.
|
|
|
|
|
Kafi KM, Shafri HZM, Shariff ABM (2014). An analysis of LULC change detection using remotely sensed data; A Case study of Bauchi City. In IOP Conference Series: Earth and Environmental Science, 20(1):12-56.
Crossref
|
|
|
|
|
Manish W, Ahmad S (2010). Changes in Land use Pattern due to Mining in Faridabad (Haryana. A paper presented at 11th India Esri User Conference. Olokeogun OS, Iyiola K, Iyiola OF (2014). Application of remote sensing and GIS in Land Use Land Cover mapping and change detection in Shasha forest reserve, Nigeria. Int. Arch. Photogramm. Remote Sens. Spat. Inform. Sci. 40(8):613.
|
|
|
|
|
Oluseyi OF (2006). Urban land use change analysis of a traditional city from remote sensing data: The case of Ibadan metropolitan area, Nigeria. Human. Soc. Sci. J. 1(1):42-64.
|
|
|
|
|
Praveen K, Jayarama RSR (2013). Analysis of LULCChanges Using Remote Sensing Data and GIS at an Urban Area, Tirupati, India. Sci. World J. 1(1):24-33.
|
|
|
|
|
Rawat JS, Manish K (2015). Monitoring land use/cover change using remote sensing and GIS techniques: A case study of Hawalbagh block, district Almora, Uttarakhand, India. Egypt. J. Remote Sens. Space Sci. 18:77-84.
Crossref
|
|
|
|
|
Sreenivasulu G, Jayaraju K, Lakshmi P (2014). Land Use and Land Cover analysis using remote sensing and GIS: a case Study in and around Rajampet, Kadapa District, Andhra Pradesh, India. Indian J. Sci. Res. 8(1):123-129.
|
|
|
|
|
Tripathi DK, Manish K (2012). Remote Sensing Based Analysis of LULCDynamics in Takula Block, Almora District(Uttarakhand). J. Hum. Ecol. 38(3):207-212.
|
|
|
|
|
Rawat JS, Vivekananda B, Manish K (2013). Changes in land use/cover using geospatial techniques: A case study of Ramnagar town area, district Nainital, Uttarakhand, India. Egypt. J. Remote Sens. Space Sci. 16:111-117.
Crossref
|
|
|
|
|
Ujoh F, Kwabe ID, Ifatimehin OO (2011). Urban Expansion and Vegetal Cover loss in and around Nigeria's Federal Capital City. J. Ecol. Nat. Environ. 1(1):10-14.
|
|