ABSTRACT
This study examined the levels of rural water access and coverage in Akwa Ibom State, Nigeria. In Akwa Ibom State, there are two statutory bodies involved in water supply: Akwa Ibom State Water Company Limited and Akwa Ibom State Rural Water Supply and Sanitation Agency. Apart from these two statutory bodies, the federal government, United Nations Development Programme (UNDP), Exxon Mobil, and other foreign bodies are involved in rural water supply. This study explores the contribution of these bodies towards improved rural water coverage and access using scientific approach. Data on mini water schemes and hand pump boreholes in rural areas in the state were obtained from official records and utilized for analysis. The result indicated inequity in the location of projects. The distribution however does not conform to the clearly spelt out criteria for sitting of water schemes in the rural communities. With this distribution gap created by such chaotic pattern, it was apt to examine the level of access which also revealed that access to safe water in the state is grossly inadequate. At the state level, the coverage and access levels of 37.69 and 33.99% were observed. Four spatial factors were examined to ascertain their influence on rural water supply using correlation analysis and result singled out rural population to be highly significant correlated with the number of safe water points(r=0.678). This implies that about 46% of variance in safe water points in rural areas of the state is explained by rural population factor. It can be inferred that poor coverage and access to safe water facilities provide clear indicators of the state of poverty in rural areas of Akwa Ibom State and thus, call for urgent attention.
Key words: Water coverage, water access, rural areas, trends, dimensions, Nigeria.
Water is one of the essential needs of man. Securing access to potable water supply is a central issue of concern not only in urban areas but much more in rural areas. The importance of water supply for domestic uses cannot be compromised not only because of its social and economic values, but also because water based sources of livelihoods have become critical to the survival and health of most rural households, providing valuable contributions to rural livelihoods (Bain et al., 2014). Water is therefore a very strategic socio-economic asset especially in poor economies where wealth and survival are measured by the level of an access to water. Water is an important element in the varied and complex social relations of production within which conflict between individuals and communities are bred. Therefore no nation, city or rural area can survive as an entity without access to sustainable water supply. Access to water supply is therefore one of the key factors that enhance the wellbeing of the rural households. Inaccessibility and unequal access to safe water supply can constrain the inclusiveness of growth and thus result in low standard of living among the rural people (Yange et al., 2013). In circumstances where access is denied, communities’ as well as individuals standard of living and productivity becomes drastically reduced.
However, despite the critical role of water for social and economic development, only about 89% of the population had access to improved/safe drinking water supply in the year 2012 (WHO/UNICEF, 2014). This implies that that nearly one in every ten people worldwide have access to improved drinking water and as a result, millions of people, mostly children, still die yearly from diseases mainly associated with lack of access to safe water source (Bain et al., 2014). One of the millennium development goals (MDGs) targets is that by 2015 the proportion of people without sustainable access to safe drinking water should have been reduced by 50%. Perhaps the most frightening is the UNWWD Report (2006) which predicted that by 2050, at least one in every four people are likely to live in a country affected by chronic or recurring lack of access to safe water source. This calls for immediate and sustaining action amongst our policy makers and various stakeholders involved especially in rural water supply if we are to avert this menace.
Rural water coverage and access are terms that have been used interchangeably. However, the same term may have different meanings for different practitioners (Ross and Bostoen, 2010). According to WHO/UNICEF (2004), water coverage refers to the proportion of the population using improved sources of drinking water. It is based on the principle that an improved source of water is designed to deliver water to a certain number of people. Rural water coverage is often calculated by multi-plying the number of each safe water points by the number of people who should be served by those water points. However, coverage may not give accurate estimate of access due to functionality and distance to the water source(s). For example, it could be assumed that water point can serve a particular number of people but the number actually having access could be very different (IIDL, 2008).
The Ministry of Local Government and Housing in Zambia; defined access to water in rural areas based on the ability of people to collect at least a minimum of 25 liters of water per person per day for domestic purposes all year round, and also walk less than 500 meters to the water point (Village Water, 2010). This could be a good definition; however, it is important to note the length of time spent queuing at the water point. The Mozambique definition, for example, refers to a 30 min round trip including going to the water point, queuing, fetching the water, and returning home (Ross and Bostoen, 2010). However, WHO/UNICEF (2004) broadly defined rural water access as the availability of at least 20 L per person per day from an improved source within one kilometer of user’s dwelling. The standard for Nigeria according to FGN (2000) is that access to rural water supply should guarantee minimum level of service, serving about 250-500 persons per point. WHO/UNICEF (2004) estimated that in Africa, the rural areas enjoy between 25-50% of rural water coverage. WHO/UNICEF (2014) estimates in 2012 indicate that Sub-Saharan Africa achieved 53% of safe water access while the rural water courage for Nigeria in the same year was 49%. It was against the background of poor water coverage that the federal government in the year 2000 came up with the following targets while emphasizing on the provision of sufficient potable water to all Nigerians in an affordable and sustainable way:
i) Improving service initial coverage of 40 to 60% by year 2003;
ii) Extension of service coverage to 80% of population by the year 2007;
iii) Extension of service coverage to 100% of the population in the year 2011; and
iv) Sustain 100% full coverage of water supply and wastewater service for the growing population beyond the year 2011.
Improved water sources are defined in terms of the types of technology and levels of services that are more likely to provide safe water than unimproved technologies. Improved water sources include household connection, public standpipes, boreholes, protected dug wells, protected spring and rainwater harvesting. Unimproved sources are unprotected wells, unprotected springs, vendor provided water, and bottle water (WHOSIS, 2008). It is emphasized here that potable/wholesome water is the same thing as safe water source as long as its availability is enough to guarantee water demand. The more reason bottled water is not considered as safe source unless there are other improved sources to compliment it. This research adopts safe water source instead of potable/wholesome to be in line with the current trend in public water supply.
Equitable and sustainable distribution of water supply facilities in our rural communities is very fundamental for guaranteeing rural water coverage and access. Population of a place is very fundamental when issue of water coverage is to be addressed whereas water access looks beyond population issue, where the water points are actually sited is also of paramount importance. This implies that for equitable distribution of safe water to our rural populace, coverage and access should be seen to satisfy these tenets (Atser, 2012). Compromise to these tenets could likely result in under utilization, mismanage-ment and neglect of the facility. Nigeria has a water policy and rural water programs should be implemented in line to guarantee right to both coverage and access of safe water delivery especially in the rural communities of Akwa Ibom State. This research is concerned with investigating the extent to which water coverage and access is guaranteed in Akwa Ibom State.
Improving water coverage and access is not only imperative but more importantly, it is within the tenets of sustainable development, which according to the WCED (1987), is development that meets the needs of the present generation without compromising the ability of future generation to meet their own needs and is widely understood as either intergenerational equity principle or intra-generational equity principle. The overall aim is to eliminate poverty which Millennium Development Goals intend to achieve through equitable distribution of amenities such as right access to safe water. On this basis, sustainability has been added to equity in distribution (Haughton, 1998). Furthermore, Haughton while examining equity did not only based on how environmental “disamenities” such as pollution are distributed but also on environmental assets, in particular, the issue of inequitable access to environmental resources, such as water, remarked that many water developments failed to satisfy the basic distribution equity and environmental justice tenet; and that no groups, particularly the disadvan-taged, should be made worse off in absolute or relative terms because of water policies. This issue has been taken care in the water policy of Nigeria and there is no discrimination between the rich and poor in rural and urban areas of the country. This is also linked to the research because the degree of success or failure in guaranteeing safe and sustainable water coverage and access to a large extent depends fully on the understanding of emphasis placed in this concept, which are some of the salient points the Nigeria water policy is anchored on.
The stratification of equity into horizontal and vertical dimensions still relates to two broad issues namely: the universality of needs (horizontal equity) and special or targeted supplies (vertical equity). For horizontal equity, everyone needs a particular basic necessity at some point where as vertical equity relates to targeting a specific supply to the needs of a special group such as the poor. The distinction between these situations still turns on the interpretation of need. In line with the benchmarks in Article 2 and 25 of the Universal Declaration of Human Right of 1992, access to domestic water supply services, of an acceptable level, is vital to human well being and dignity and is widely recognized as a human need and, therefore, a basic human right (Anan, 2003). It is therefore essential that coverage be universal. Contaminated water jeopardizes both the physical and social health of the people. It is an affront to human dignity. Once again, this recent definition of access to water as basic human need and right emphasized the responsibilities of governments and international com-munity in the water sector to come up with a sustainable framework on water coverage and access without negating the tenet of distributional equity.
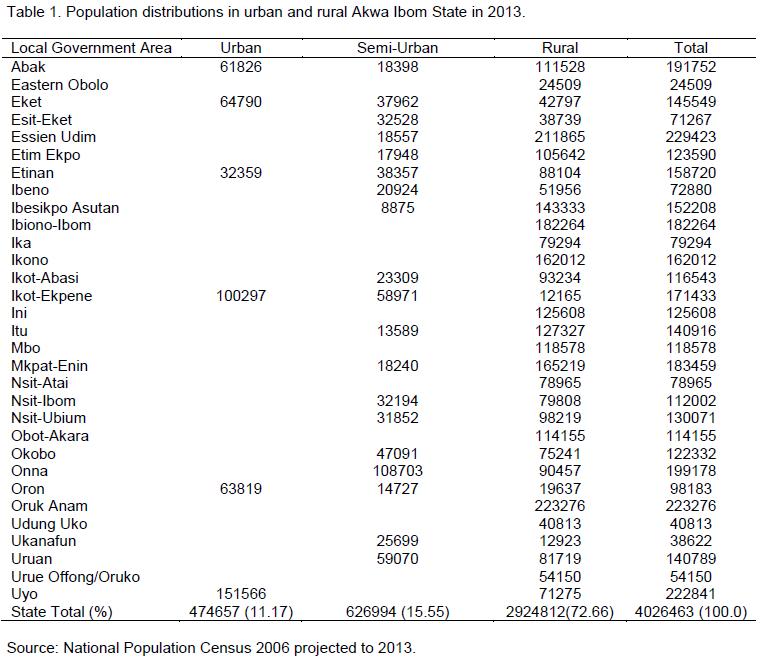
Akwa Ibom State is the study area. It is one of the oil rich states in the Niger Delta Region of Nigeria. Located in the southeastern coast of Nigeria, Akwa Ibom State was created on September 23, 1987 from the former Cross River State of Nigeria. The State is wedged in between Rivers, Abia and Cross river States and the Republic of Cameroon to the Southwest, North, East and Southeast respectively while the Bight of Bonny bordered the State to the South. It lies between latitudes 4°32' N and 5°32' N; and longitudes 7°28' E and 8° 25' E. According to NPC (2007), Akwa Ibom State has a total land area of 6,187 km2, which represents 0.67% of the total land mass of Nigeria. The State has 31 Local Government Areas with Uyo, Eket, Ikot Ekpene, Abak, Etinan, and Oron being the most developed urban centres (Table 1). According to the most recent National Population Census conducted in 2006, Akwa Ibom State had a total population of 3,920,208 persons out of which 87.89% constituted rural population while 12.11% formed the urban population (NPC2007). The most striking characteristic of the population of Akwa Ibom State is its crude density. When compared with other states in the south and southeastern parts of the country, the area is one of most densely settled state. Apart from Imo and Anambra States, Akwa Ibom State is the third most densely populated state with densities as high as 634 persons per square kilometer in Nigeria (NPC 2007).
In Akwa Ibom State, there are two statutory bodies involved in water supply. The first is Akwa Ibom State Water Company Limited which is charged with the responsibility of urban and peri-urban water supply while the second, Akwa Ibom State Rural Water Supply and Sanitation Agency has the mandate of rural water supply. Apart from these two statutory bodies set up by Akwa Ibom State Government, the Federal Ministry of Agriculture also intervenes in rural water supply in the state directly or through Cross River Basin Development Authority. There is also foreign collaboration with UNICEF and UNDP on rural water supply. Multinational oil companies like Exxon Mobil, Elf and Shell Petroleum Development are also involved in rural water supply in the state. Sometimes Local Government Administration extends their statutory function of maintaining the water schemes in their domains to direct execution of water supply projects. The research examined the dimensions in rural water schemes in the state in terms of coverage and access particularly that the level of coverage does not necessarily translates to the same level of access unless it is matched with population. Data on the total length of all the roads in the state and total area of all the 31 Local Government Areas in the state were obtained from the State Ministry of Works and Transport. Data on poverty index were obtained from the Akwa Ibom State Ministry of Economic Planning and Development. The data on rural population was projections from the 2006 census results. To compute water coverage, the following formula was used:
Pc = (ps /pp) 100%
Where pc =%age water coverage, ps = Population served (500 as maximum number of persons to be served per one safe water point multiplied by the number of safe water points) and pp = projected population to year 2013.
For rural water access, different formulae were applied in computing the percentage rural water access for each LGA. The
basic assumption is that each safe water point is expected to service a maximum of 500 people within maximum distance of 250 m radius (FGN, 2000).
Ppc - Pp/Nc
Where Ppc = Average community population in a LGA; Pp = LGA population; Nc = Number of communities per LGA.
Wprc = Ppc/Tpwp
Where Wprc = Required water points per community in LGA; Tpwp= Threshold population for water point (500 persons)
Wprl = Wprc x Nc
Where Wprl = Required water points in LGA
Percentage access = (NSWP/WPrl) x 100
Where NSWP =Total number of water points found in LGAs Pearson correlation statistics was employed to investigate the relationships between spatial influences of the number of safe water points among the 31 Local Government Areas in the State using version 17 of Statistical Package for Service Solutions (SPSS) software.
Table 2 shows the rural water coverage in the 11 Local Government Areas (LGAs) with its total population as rural and while Table 3 shows the access status in the same 11 LGAs adjudged as entirely rural. To analyze the rural water coverage in each of the LGAs, water per capita in each of the LGAs was calculated based on Nigeria water demand standard. This is based on the fact that each water point should be able to serve a maximum of 500 persons per day and delivers at least
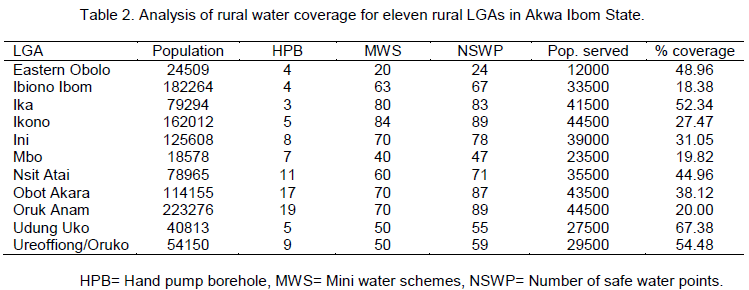
30 liters of water per day per person (FGN, 2000). The maximum of 500 persons to be served by one safe water point was then multiplied by the total number of safe water points in each of the LGAs to arrive at estimated water coverage. This implies the expected population that water supply could meet their water demand given the right access. The percentage of this was then found with respect to the entire population of the LGA to give percentage coverage for coverage analysis and the result is in Table 2.
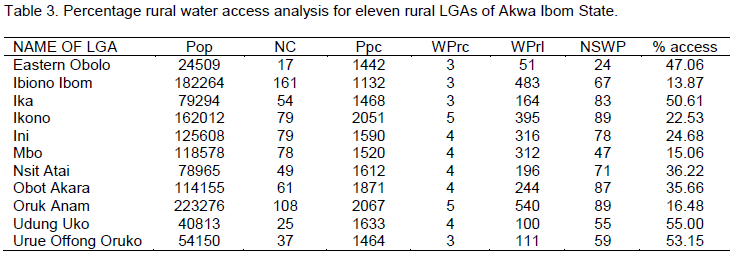
For rural water access analysis, the eleven LGAs adjudged by National Population Census of 2006 to be 100% rural were first considered. The idea of averaging the community approximate population was to enable application of 250 – 500 persons service standard per safe water point so as to arrive at required number of points for the respective communities which is to be used in calculating the number of points required in a particular LGA. With this the percentage access was then calculated by finding the number of water points within a community against the number of community in the LGA. Table 3 shows the analysis of percentage rural water access in the eleven rural LGAs.
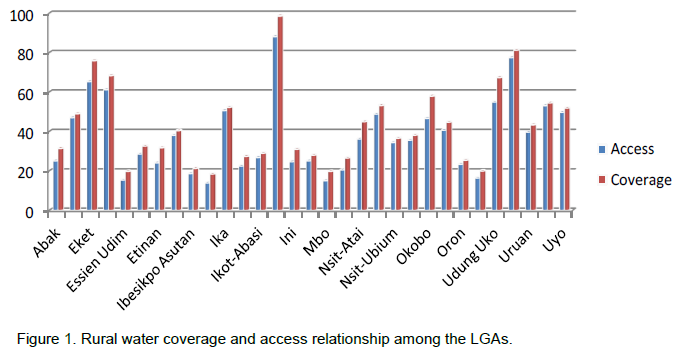
There is an indication of inequity in the location of projects. The distribution however does not conform to the FGN (2000) which clearly spelt out criteria for sitting of water schemes in our rural communities. With this distribution gap created by such chaotic pattern, it is apt to say there is urgent need to correct the lopsidedness being observed. Similarly, the study also revealed that safe coverage in the state is grossly inadequate. Based on FGN (2000) which states that Nigeria should attend 100% full coverage of safe water supply for the growing population beyond 2011, many LGAs are still not able to meet the target. Even among the LGAs that are classified as urban, the attainment of 100% full coverage is still not achievable. There are 18 LGAs with coverage range of 18 – 40% with Ibiono Ibom LGA being the least with coverage level of 18.38%. Few LGAs that had coverage levels above 70% are those LGAs having peri-urban and urban centres and these are Eket, Ikot Ekpene and Ukanafun. Probably all the water points could not be said to belong entirely to the rural areas and vice versa. A total of 12 LGAs had coverage levels of between 41 to 69% while only 3 LGAs had coverage
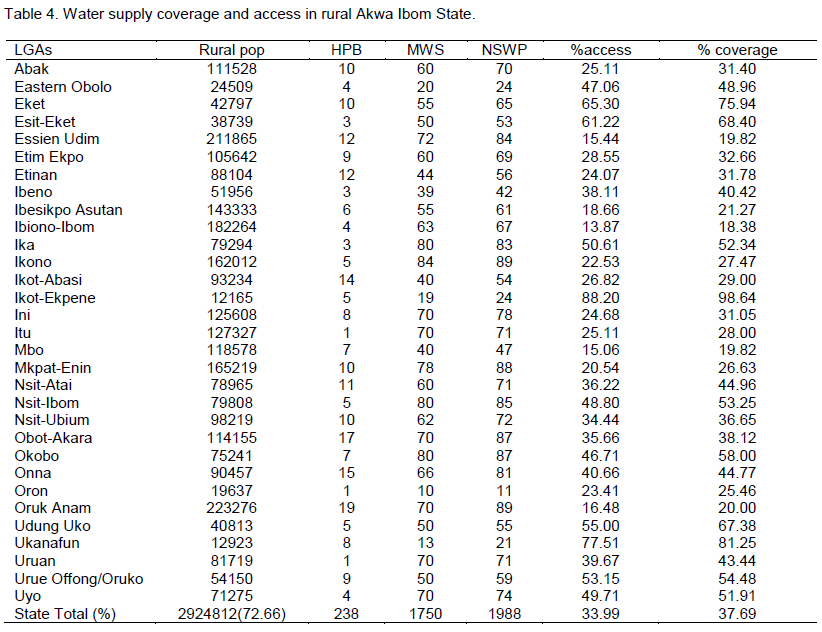
levels of 70% and above (Figure 1). Table 4 shows the dimensions in rural water coverage and access for the entire state. The data in Table 4 were utilized to examine the relationship between rural water access and coverage as illustrated graphically in Figure 1. The R-square coefficient value of 0.979 indicates that about 98% of access level relate to coverage levels. This implies that improving coverage levels would indirectly impact positively on access to safe water points. Water coverage has spatial connotation and therefore could improve access. The result of poor access revealed in this study is a good pointer to policy makers and various stakeholders to reflect on the design and implementation of mini water schemes in the state with emphasis given to water distribution.


Based on FGN (2000) rural water access benchmark no LGA could rightly be said to have access to safe water. Ikot Ekpene had what could be regarded as the highest precent age water access of 88.20% and closely followed by Ukanafun (77.51%) while Ibiono Ibom had the least access level (13.87%). A comparison of water access with coverage even revealed more water access problem among the LGAs. In ideal situation and given the right framework, water generated should be equal to water access (FGN, 2000). That is to say that the volume of water generated must be distributed proportionately in accordance with the standard stipulated by FGN (2000) before coverage could be equated to access. A situation where many inhabitants and communities have to travel long distances (more than 30 min) as well as queue for water, irrespective of the number of water points within the water headwork does not add any special advantage but rather creates access problem. For a community to have access to water, it therefore means that the house-holds within the community should travel a maximum distance of 250m to fetch water and each water points should not serve more than 500 persons per day (FGN, 2000). Thus, if the number of water points were said to be evenly distributed across the community such that no individual would travel more than 250 m, then such area would have met the required access target.
In Table 5, four spatial factors were examined to investigate their influence on number of safe water points among the LGAs. The choice of these factors was based on their relative importance. Road infrastructure is the artery of major developments, that is, road infrastructure is preceded by other developments. This implies that where a road goes, development follows. Mini water schemes are provide using heavy motorized driller equipment and as such the more motorable the LGA is in terms of road network, the more the potentials for the provision of mini water schemes. All the four independent variables are surrogate to rural development. The poverty index as well as rural population is good indicators of the level of water accessibility. It is expected that poverty incidence is low among households and communities that have improved access to water supply while areas with high rural population should have more safe water points than those with less population. However, the result as presented in Table 6 and Figure 2 shows that only the rural population factor highly significant correlated with the number of safe water points in the state (r = 0.678, p<
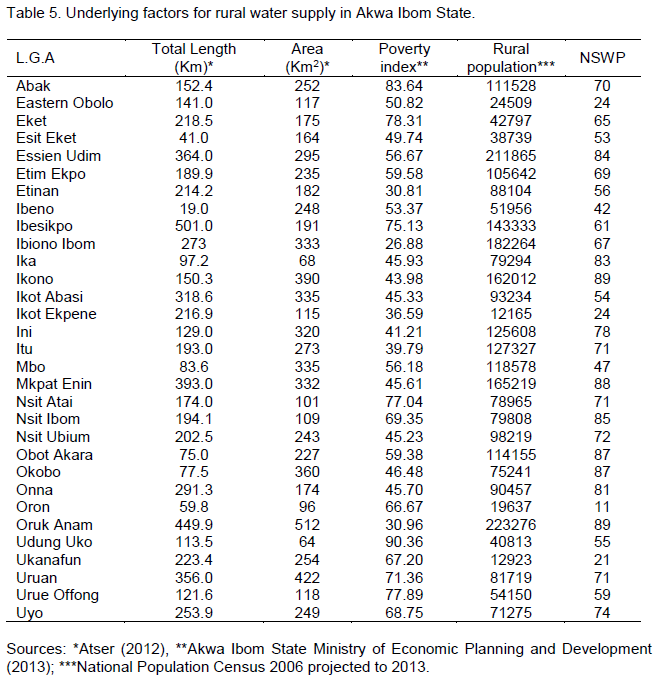
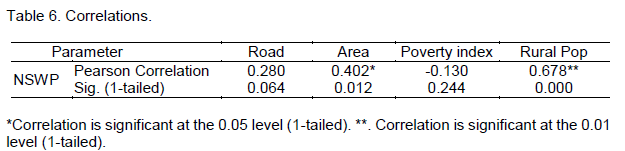
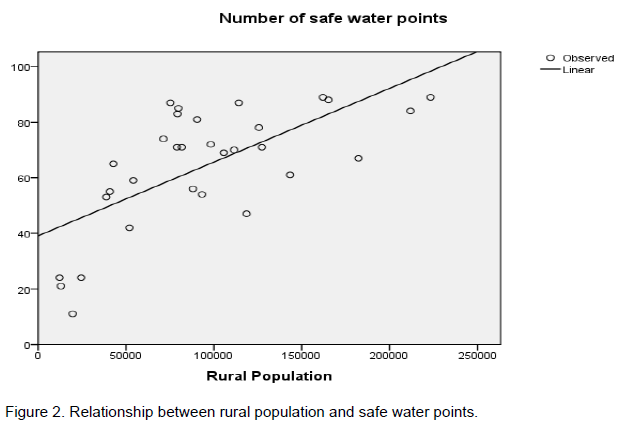
0.001), implying that about 46% of variance in number of safe water points is explained by rural population. The area (0.402) and road (0.280) factors though positively related, had weak influences on water supply going by their R-square values of 16.2 and 8.0% respectively. The poverty index factor however shows negative symptoms (-0.130) of relationships which is expected. The higher the index factor, the lesser the number of safe water points. This relationship is however very weak accounting for only 2% of the variance in the number of safe water points across the state.
RECOMMENDATIONS AND CONCLUSION
There is a need for the statutory government organs to interface with stakeholders involved in rural water programs to maintain a robust spatial database which amongst other things should include hydrologic parameters of all their water programs. This will aid in design, costing and execution of rural water projects. The redesign of the mini water schemes should be looked into. Concentration of the water points at the headwork does not help to address the issue of water access. Steps should be taken to reduce the widening gap between water points away from immediate confines of the headwork but within the limit of hydraulic head. By the year 2015, the target year of MDGs to increase access of population by 50% to safe water, Akwa Ibom State rural population will still be left behind. The result of this research has revealed very low access in the rural communities of Akwa Ibom State. There is urgent need for Akwa Ibom State Government, at least for interim measures, to harness other sources of water to complement groundwater. Effort should be made to explore the possibility of rainwater harvesting and utilization. Some parts of China with annual rainfall less than 500mm have utilized rainwater potentials to balance her water needs, so the lesson from other developing countries’ experiences and international collaboration are very important (Yang et al., 2013). Water quality in our numerous streams should be looked into and improve upon as the case may be to serve as a stop gap in those communities that are in dying need of safe water source (Bain et al., 2012). In conclusion therefore, sustainable rural water coverage and access for Akwa Ibom State cannot be overemphasized. Thus for rural water coverage and access to be sustainable, creation and maintenance of efficient and up-to-date database containing vital information is essential. Also, rural communities in the state are still far from attaining the 100% coverage target as specified in Nigeria water policy. In some areas, more safe water points are generated or covered but only to be poorly distributed or accessed.
The author(s) have not declared any conflict of interests.
REFERENCES
|
Anan I (2003). Technical background paper on water, sanitation and health focus on International changes for achieving the water related targets of MDGs in Asia. UN Water Resources section, Environmental and Sustainable development division.
|
|
|
|
Atser J (2012). Spatial patterns of social infrastructure in Nigeria. LAP LAMBERT Academic Publishing, Av Akademikerverlag GmbH & Co. KG
|
|
|
|
Bain R, Gundry S, Wright JA, Yang H, Pedley S, Bartram J (2012). Accounting for water quality in MDG monitoring: lessons from five countries. Bulletin of the World Health Organization. 90(3):228-235.
Crossref
|
|
|
|
Bain R, Cronk R, Hossain R, Wright J, Yang H, Slaymaker T, Bartram J (2014). Faecal contamination of drinking-water in low- and middle-income countries: A systematic review and meta-analysis. PLoS Medicine. 11; e1001644.
Crossref
|
|
|
|
Bain R, Cronk R, Hossain R, Bonjour S, Onda K, Wright J, Yang H, Slaymaker T, Hunter P, Pruss-Ustun A, Bartram J (2014). Global assessment of exposure to faecal contamination through drinking water based on a systematic review. Trop. Med. Int. Health. 19(8):917-927.
Crossref
|
|
|
|
FGN (2000). National water supply and sanitation policy.
|
|
|
|
Haughton G (1998). Geographical Equity and Regional Resource Management: Water Management in Southern California. Environ. Planning and Design. 25:297.
|
|
|
|
IIDL (2008). National urban water reform project on National water supply and sanitation baseline survey (south-south zone). Federal Ministry of Agriculture and Water Resources Report, Abuja.
|
|
|
|
NPC (1998).1991 National Population Census of the Federal Republic of Nigeria: Analytical Report at the National Level". National Population Commission (NPC), Abuja, p8. NPC (2007). 2006 National Population Census Result: Legal Notice on the Details of the Breakdown of the National and State Provisional Totals". National Population Commission. Printed and published by the Federal Government Printer, Lagos, Nigeria. FGP71/52007/2500(OL24).
|
|
|
|
Ross I, Bostoen (2010).Data reconciliation in South Africa: Looking at monitoring approaches in water and sanitation. A Water Aid Regional workshop in collaboration with WHO/UNICEF.
|
|
|
|
UNWWD(2006).Water: a shared responsibility.
|
|
Village Water (2010).Sustainable Water and Sanitation in Zambia.
|
|
|
|
Water Aid (2006). Effective Financing of Local government to provide water and sanitation services.
|
|
|
|
WCED (1987).Our common future. World Commission on Environment and Development. OUP, Oxford.
|
|
|
|
WHO/UNICEF (2004). Joint monitoring programme for meeting the MDG drinking water and sanitation target: a midterm assessment report.
|
|
|
|
WHOSIS (2008). Access to improved drinking water sources and improved sanitation
|
|
|
|
Yang H, Flower RJ, Thompson JR (2013). Sustaining China's water resource. Science. 339:141-141
Crossref
|
|
|
|
Yang H, Bain RES, Bartram J, Gundry S, Pedley S, Wright JA (2013). Water safety and inequality in access to drinking-water between rich and poor households. Environ. Sci. Technol. 47(3):1222-1230.
|