Full Length Research Paper

ABSTRACT
Focusing on the classification of solar winds into three types of flux: (1) slow winds, (2) fluctuating winds, and (3) high speed-solar winds HSSW (V ≥ 450 km/s on average day), the influence of the convection electric field (EM) via the flow of HSSWs during storms in the internal magnetosphere and on the stability of magnetospheric plasma at high latitudes was investigated. The study involved 1964-2009 period, which encompasses solar cycles 20, 21, 22 and 23. The results show a weak correlation of the frozen electric field profiles with the HSSWs overall solar cycles and a very large number of HSSWs recorded in cycle 23. Particular attention has been paid to solar cycle 22 which rather presents a fairly disturbed profile with sudden variations in solar flux and EM field; however, solar cycle 21 records the lowest level of HSSW. Overall, over all the studied solar cycles, it can be seen that the EM field from HSSWs of very low intensity increases progressively from solar cycle 20 to cycle 23, respectively with a minimum occurrence of 8.48% and a maximum of 9.36%. The results reached show, on one hand, that the magnetosphere is very stable from 15:00UT to 21:00UT, and on the other hand, that there is a significant transfer of mass in the night sector (21:00UT-24:00UT) than on the day side (00:00UT-15:00UT) for all solar cycles over the long period of 45 years.
Key words: Solar cycle, solar wind, magnetosphere, geomagnetic convection, electric field.
INTRODUCTION
Magnetospheric convection electric field (EM) is a key parameter in all existing theories when it comes to the mechanism of magnetic disturbances in the upper atmosphere. These disturbances, more intense via the solar flux at high speed, can have a possible impact on human health (Schwenn, 2006; Belisheva, 2019; Abdullrahman and Marwa, 2020; Hapgood et al., 2021) as well as technological systems (satellites, planes, telecommunications, etc).
Magnetospheric convection is seen as a fundamental driver of magnetospheric processes (Dungey, 1961; Axford and Hines, 1964). Component of the ionosphere/ magnetosphere coupling, EM specifies the motion of the plasma in the internal magnetosphere (Matsui et al., 2008). It contributes with the corotating electric field related to the rotation of the earth to the magnetospheric electric field (Khazanov et al., 2004; Maus, 2017).
Considerable progress has been made on the study of the EM field (Kivelson, 1976; He et al., 2010; Kunduri et al., 2018). These include the study of magnetospheric electric fields and their variation with geomagnetic activity, numerical simulations on the internal magnetosphere-ionosphere convection, the study of the small-scale magnetospheric electric field observed by the Double Star TC-1 satellite (Matsui et al., 2008; Kivelson, 1976).
However, its large-scale study is poorly understood due to its low value in time and space (Fälthammar, 1989; Matsui et al., 2003). Also, this field measurement is technically very difficult, except in the relatively dense plasma of the ionosphere (Fälthammar, 1989). Indeed, first measurements were made from rockets and satellites at low latitude, while measurements at high latitude and in the magnetopause were made much later. Even today, only a few missions have included direct measurements of the magnetospheric electric field in high latitude regions such as the “Parker Solar Probe” mission launched on August 12, 2018 in Florida and “ESA S SMILE” class mission whose launch is scheduled for 2023. Therefore, many studies used data from the electric field on one hand and the magnetic field on the other hand, acquired at high latitudes (Kim et al., 2013; Kunduri et al., 2018) and at latitudes equatorial (Kelley et al., 1979; Fejer and Scherliess, 1995; Fejer et al., 2007). Since there is no way to determine directly the EM field overall distribution, various empirical and mathematical models have been provisionally constructed, with varying degrees of complexity (Wu et al., 1981; Pierrard et al., 2008; Matsui et al., 2013).
This paper is interested in the study of the geo-efficiency of the inner magnetosphere for 1964-2009 period. The aim was to compare the dynamics of the earth's magnetosphere under two hall cycles when it is impacted by the very energetic particles of the high-speed solar wind. In this study, to determine the EM field, linear model of Wu et al. (1981) validated by Revah and Bauer (1982) is used, a rather empirical model with a confidence level of 99% and a correlation of 97%. The objective of the study is to show the influence of HSSW on the EM field per solar cycle.
DATA AND METHODOLOGY
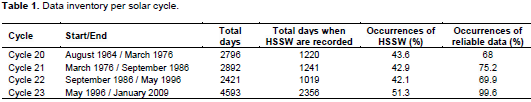
The dawn-dusk electric field strength is specified empirically by the magnetic index Kp distributed in 3 h steps (Maynard and Chen, 1975; Thomsen, 2004). In doing so, data used in this present article are taken over 3-h steps so as to cover a period of 45 years. All data were extracted from CDPP site via the link «https://cdpp-archive.cnes.fr/». A comparison was made with the data available on OMNIWeb (http://omniweb.gsfc.nasa.gov/form/dx1.html) and a filtering was performed. The two surprising peaks of the frozen electric field (in mV/m) and solar wind velocities V (in km/s) were considered as erroneous and removed. In this paper, the data are called good or reliable, when simultaneously the parameters Ey, V, Aa (geomagnetic index) and Bz (component of the interplanetary magnetic field IMF) are available. The data inventory for the period1964-2009 is shown in Table 1.
The hourly values of the Ey (in mV/m) are converted into EM (in mV/m) using the law of field transformation (Wu et al., 1981) according to the equation:
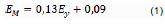
Since we cannot isolate the behavior of part of the solar winds from that of the whole in the case of turbulent flow, it would be necessary to take a holistic view. Using this approach, we calculated the daily (Equations 2 and 3) and annual (Equation 4 and 5) averages of the frozen field and the solar wind speeds:
RESULTS AND DISCUSSION
High-speed solar winds from 1964 to 2009
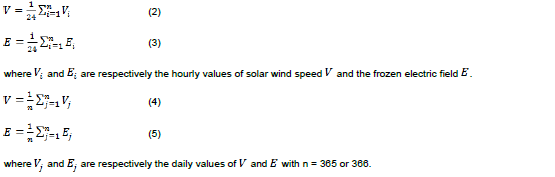
Figure 1 shows high speed solar winds annual averages evolution from 1964 to 2009. Part of our study period was not influenced by high-speed solar winds. It was found that the solar wind speeds maximum are generally observed at the end of the cycle, that is to say in the years of the descending phases. This finding is in agreement with other previous studies (Richardson and Hilary, 2012; Zerbo et al., 2012; Mursula et al., 2015; Borovsky, 2020).
The observed peaks in 1974, 1986, 1994 and 2003 belong, respectively to solar cycles 20 (1964-1976), 21 (1976-1986), 22 (1986-1996) and 23 (1996-2009). The more important peak was observed in 2003 with an annual average speed of 608.50 km/s (Zerbo et al., 2013; Kaboré and Ouattara, 2018). The year 2003 presents the frequent occurrence of high-speed solar winds with a peak of 1189 km/s recorded on October 31, 2003 (Tanskanen et al., 2005 ; Reeves et al., 2011). The year 2003 is a solar cycle 23 year, for the longest time, which recorded over 76% of HSSWs.
In addition, we examined a number of correlations (Table 2). It noticed that the profiles of the solar flux speed V and the frozen field have no dependency ratios. This is confirmed by the curves in Figure 2.
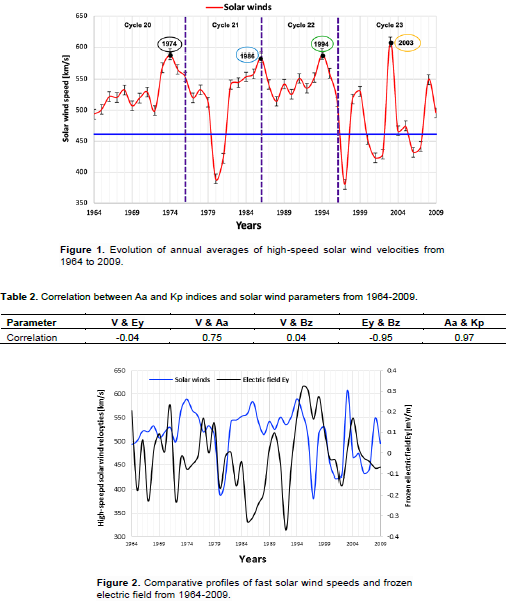
The absence of correlation between V and Ey and then between V and Bz observed, confirms the mechanism of protection of the magnetosphere from solar and planetary phenomena. Our results are in good agreement with those of Maggiolo et al. (2017), Poudel et al. (2019), and El-Borie et al. (2020).
In addition, the graphs in Figure 3 show that the Ey field and the Bz component of the interplanetary magnetic field (IMF) are in phase opposition. The average values of Ey and Bz fields obtained, are 0.031 mV/m and -0.013 nT, respectively. According to Tsurutani et al. (1988) and Herdiwijaya (2019), negative values of IMF-Bz in geocentric solar magnetospheric GSM coordinates, refer to the south direction. The negative correlation of IMF-Bz with the Ey value of the frozen electric field in the solar wind, indicates that the southern orientation of IMF-Bz could be responsible for the initiation of magnetic substorms. Probably, daily fluctuations of the magnetic and electric effects of the magnetospheric origin currents would play a very important role in the magnetic reconnection rate.
Solar wind velocities vary with distance traveled and time, but changes from solar minimum to solar maximum produce larger effects (Richardson et al., 2001). To better understand the temporal variability of high-speed solar winds over the long 45 years period, the data were averaged over 24 h in order to more visually capture the trend of the variations (Figure 4).
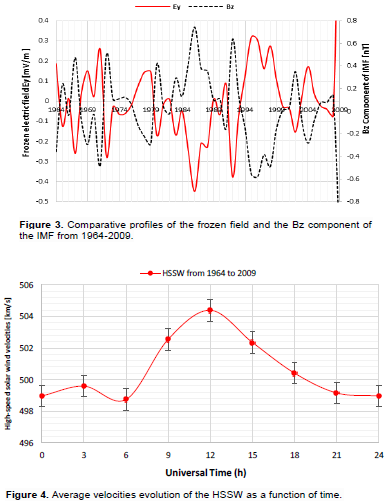
On the graph of Figure 4, a peak is reached at 12:00UT and the minima are observed at night until sunrise. In doing so, we can hypothesize that the high-speed solar winds experience an acceleration from sunrise up to 12:00UT and after 12:00UT, undergo a deceleration. This result corroborates that of Navia (2018). However, the low correlation (r = 0.43) between HSSW and time may be due to the temporal cadence or variety of the solar wind considered in this study.
Magnetospheric electric field from 1964 to 2009
Figure 5 represents the daily variability of the magnetospheric electric field from 1964-2009. In this figure, linear regression curves plotted in dotted lines, are obtained from the least squares method. Plot shows three trends, two increasing and one decreasing with relatively different correlations at different times of the day. This leads respectively to the low daily averages 0.090 mV/m for the first trend, 0.088 mV/m for the second trend, and 0.089 mV/m for the last trend. Over 1964-2009 period, we find that with universal time (UT), correlation of the EM field is much weak (r = 0.16) from 00:00 to 15:00 UT, better (r = 0.98) from 15:00 to 21:00 UT, and excellent (r = 1) from 21:00 to 24:00 UT. The first increasing trend from 00:00 to 15:00 TU with a slope of +2.10-5 mV/m.s, shows the main phase of the magnetic storm (Partamies et al., 2011). The onset of this phase corresponds to the beginning of the IMF change from north to south. During this main phase, we find that the sustained EM field, is directed southward until 21:00UT. According to several works (Nishimura et al., 2009; Partamies et al., 2011), the IMF southward change implies the intensification of the ring current; and according to Gonzalez et al. (1994), since the geomagnetic storm is identified by the intensification of this type of current, we can conclude in this study that the increasing phase of EM field expresses the phase of increasing geomagnetic activity. These authors have confirmed that a south-facing IMF triggers the increase of the convective electric field in the inner magnetosphere, however they do not specify the time at which this increase is perceptible. Our study suggests that the intensification of the ring current took place from 00:00 to 15:00 UT for all the solar cycles 20 to 23 studied.

The next trend is decreasing from 15:00 to 21:00 UT with a slope of -6.10-4 mV/m.s. According to several authors (Gonzalez et al., 1994; Nishimura et al., 2009; Partamies et al., 2011; Kaboré and Ouattara, 2018), the decaying phase of EM field is due to the change of IMF from South to North. In view of this argument and for the whole solar cycles 20 to 23, we can confirm that IMF maintains northward from 15:00 UT until 21:00 UT, and turns southward again after 21:00 UT. During this decreasing phase, there is a dissipation of energy by the inner magnetosphere. In this paper, this dissipation observed over a period of 03 h, is corroborated by the work of Partamies et al. (2011) and Kaboré and Ouattara (2018). This result leads us to suggest that the dissipation of solar-derived energy by the earth's magnetosphere via HSSWs, varies according to the phases of magnetic substorms, in particular, when the IMF is oriented North. Moreover, based on the assumptions that, magnetospheric convection is weakened when IMF shifts from South to North (Kelley et al., 1979; Kaboré and Ouattara, 2018), it could be suggested in this study that the inner magnetosphere is much stable between 15:00 and 21:00 UT. Moreover, the phase changes of the IMF occur around 15:00 UT on the day side and then 21:00 UT on the night side.
Finally, the night side increase phase (21:00-24:00 UT) with a slope of +13.10-4 mV/m.s of the EM field may be due to the magnetic reconnection. This reconnection affecting the plasma dynamics, observed in the night sector (21:00-24:00 UT), would be consistent with the reconnection model proposed in the open magnetosphere concept which illustrates the principle of field line and plasma transport (Dungey, 1961; Lilensten and Blelly, 2000). The consequence of a reconnection with a south-facing IMF is the massive entry of charged particles into the inner magnetosphere. However, facing the sun, direct entries of solar wind particles are possible depending on the magnetic state of the Sun. The particles which find themselves in the magnetosphere, undergo a strong acceleration towards the earth under the combined effect of the electric field and the IMF variations. In sum, fluctuations of the magnetospheric electric field resulting from the high-speed solar winds, observed in this article, are responsible for the initiation of substorms. The intensity of these substorms increases in the mornings and evenings, while they decrease in the afternoons.
Distribution of EM field and HSSW per solar cycle
In order to study the occurrence of the EM field on each solar cycle, temporal evolutions of HSSWs have been represented in Figure 6. The graphs show large amplitudes of HSSWs for even solar cycles (cycles 20 and 22), and low amplitudes for odd ones (cycles 21 and 23). This result corroborates the work of Takalo (2021).
The graphs in Figure 6 reveal the existence of abrupt variations and large amplitudes of HSSWs for solar cycle 22. This may be due, on the one hand, to the fact that the polar coronal holes were more developed for this cycle (Issautier, 2003); and on the other hand, to the high occurrence of storms recorded in this solar cycle 22 (Echer et al., 2008; Nagatsuma et al., 2015; Pokharia et al., 2018). As a result, cycle 22 remains the most "magnetically disturbed" solar cycle, with HSSWs peaking at 569.35 km/s. These observed geomagnetic disturbances are attributed to magnetospheric electric fields due to HSSWs. This observation is in good agreement with that made by other authors (Nishida, 1966; Kikuchi et al., 1996). The graphs in Figure 6 show that cycles 21 and 23 experienced low amplitudes of the high-speed solar winds HSSWs with peaks of 490.66 and 480.63 km/s, respectively around 12:00 UT. Column 5 of Table 1 and Column 3 of Table 3 corroborate this fact. Table 3 gives the averages of the HSSWs velocities and the results of various occurrences of the EM field for the four solar cycles.
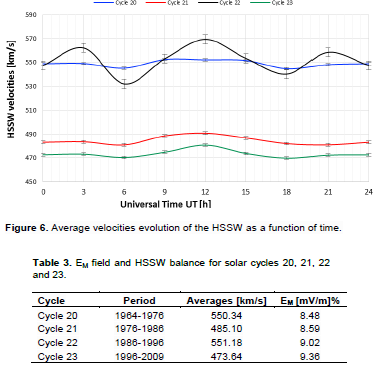
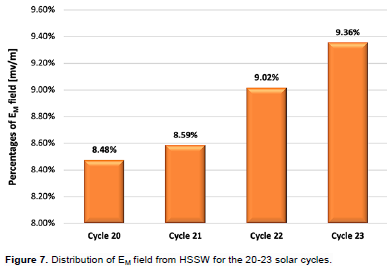
The fourth column of Table 3 shows low occurrences of EM field for all solar cycles studied. The lowest 8.48% occurrence is recorded in cycle 20 and the highest 9.36% in cycle 23. It is important to emphasize that, for our study period, almost all Ey field values of solar cycle 20 are negative (with an average of 0.038 mV/m), hence the weak contribution of EM field. Solar cycle 23 is the most exceptional. With an average duration of around 13 years, cycle 23 records 2356 days of HSSW (Table 1), slightly more than the double of the days recorded by each of the other solar cycles. As a result, cycle 23 is distinguished by remarkable years both for its majestic phenomena (09 major geomagnetic storms from 1997 to 2001, strong solar flares in 2003, violent magnetic storms in 2004, etc.) and for the intensity of its solar activity (Belov et al., 2005; Trichtchenko et al., 2007; Zerbo et al., 2012). The low proportion of EM fields corroborates the work of Bharati et al. (2019). The same authors also predicted a significant decrease in EM field occurrences for the last three solar cycles (22-24). Figure 7 shows EM field distributions from the HSSWs from 1964 to 2009 period. Globally, we noticed an increasing and almost linear evolution of the occurrences. As the depression of the geomagnetic activity level is underlined by several works (Schatten, 2003; Maris and Maris, 2009; Bharati, 2019) with solar cycle 23 being the weakest of the last three, we can confirm that EM field and geomagnetic activity are progressing in phase opposition.
CONCLUSION
Various parameters of solar origin have been used in this study to understand the dynamics of the earth's magnetosphere under the impact of high-speed solar winds (HSSW). For 1964-2009 period, about 85% of the years were under the influence of HSSW. Among these years, four were remarkable with peaks generally observed at the end of the solar cycle around 12:00 UT, which confirms the intensification of HSSW around noon UT. Daily statistical analysis of HSSW populations showed three phases of magnetic substorms manifestations: from 00:00-15:00 UT, from 15:00-21:00 UT then from 21:00-24:00 UT. These three periods are respectively characterized by the main phase of the magnetic storm, the dissipation of the solar energy initially stored by the inner magnetosphere during the first phase, and the magnetic reconnection at night. The results obtained showed that the changes of IMF orientation during these three phases, were observed at 15:00 UT on the day side and 21:00 UT on the night side. Our results confirm that the inner magnetosphere was very stable from 15:00-21:00 UT, and disturbed from 00:00-15:00 UT then 21:00-24:00 UT. For all the solar cycles studied, EM field oscillated between minima (0.087 mV/m around 06:00 UT and 0.089 mV/m around 21:00 UT) and maximum 0.091 mV/m at 15:00 UT. Overall, EM field was very weak (~0.090 mV/m overall studied cycles) and increased progressively from 8.48% (cycle 20) to 9.36% (cycle 23). Of the solar cycles studied, the even-numbered cycles were highly perturbed, with solar cycle 22 the most active.
CONFLICT OF INTERESTS
The authors have not declared any conflict of interests.
ACKNOWLEDGEMENTS
The authors thank the OMNIWeb team and CDPP for the databases.
REFERENCES
|
Abdullrahman HM, Marwa AM (2020). The Effects of Solar Activity and Geomagnetic Disturbance on Human Health. Open Access Journal of Biomedical Science 2(5). |
|
|
Axford WI, Hines CO (1964). Comments on "a hydromagnetic theory of geomagnetic storms" by J.H. Piddington. Planetary Space Science 12(6):660-661. |
|
|
Belisheva NK (2019). The Effect of Space Weather on Human Body at the Spitsbergen Archipelago. In Arctic Studies-A Proxy for Climate Change. IntechOpen. |
|
|
Belov A, Baisultanova L, Eroshenko E, Mavromichalaki H, Yanke V, Pchelkin V, Plainaki C, Mariatos G (2005). Magnetospheric effects in cosmic rays during the unique magnetic storm on November 2003. Journal of Geophysical Research 110(A9). |
|
|
Bharati K, Amar K, Durbha SR, Gurbax SL (2019). Diminishing activity of recent solar cycles (22-24) and their impact on geospace. Journal of Space Weather and Space Climate 9(A1). |
|
|
Borovsky JE (2020). What magnetospheric and ionospheric researchers should know about the solar wind. Journal of Atmospheric and Solar-Terrestrial Physics 204:105271. |
|
|
Dungey JW (1961). Interplanetary magnetic field and the auroral zones. Physical Review Letters 6(2):47-48. |
|
|
Echer E, Gonzalez WD, Tsurutani BT, Gonzalez ALC (2008). Interplanetary conditions causing intense geomagnetic storms (Dst ≤ −100 nT) during solar cycle 23 (1996-2006). Journal of Geophysical Research: Space Physics 113(A5). |
|
|
El-Borie MA, El-Taher AM, Thabet AA, Bishara AA, (2020). The Interconnection between the Periodicities of Solar Wind Parameters |
|
|
Based on the Interplanetary Magnetic Field Polarity (1967-2018): A Cross Wavelet Analysis. Solar Physics 295(9). |
|
|
Fälthammar CG (1989). Electric fields in the magnetosphere -a review, Planetary and Space Science 37(8):899-914. |
|
|
Fejer BG, Jensen JW, Kikuchi T, Abdu MA, Chau JL (2007). Equatorial ionospheric electric fields during the November 2004 magnetic storm. Journal of Geophysical Research 112(A10). |
|
|
Fejer BG, Scherliess L (1995). Time dependent response of equatorial ionospheric electric fields to magnetospheric disturbances. Geophysical Research Letters 22(7):851-854. |
|
|
Gonzalez WD, Joselyn JA, Kamide Y, Kroehl HW, Rostoker G, Tsurutani BT, Vasyliunas VM (1994). What is a geomagnetic storm? Journal of Geophysical Research 99(4):5771-5792. |
|
|
Hapgood M, Angling MJ, Attrill G, Bisi M, Cannon PS, Dyer C, Eastwood P, Elvidge S, Gibbs M, Harrison RA, Hord C, Horne RB, Jackson DR, Jones B, Machin S, Mitchell CN, Preston J, Rees J, Rogers NC, Routledge G, Ryden K, Tanner R, Thomson AWP, Wild JA, Willis M (2021). Development of Space Weather Reasonable Worst-Case Scenarios for the UK National Risk Assessment. Space Weather 19(4). |
|
|
He ZH, Liu ZX, Chen T, Shen C, Li X, Carr C, Rème H (2010). The large-scale magnetospheric electric field observed by Double Star TC-1, Annales Geophysicae 28(9):1625-1631. |
|
|
Herdiwijaya D (2019). Distribution of solar energetic particles and magnetic field orientations related to strong geomagnetic storms in solar cycle 24. Journal of Physics: Conference Series 1204:012121. |
|
|
Issautier K (2003). Large-scale structure of the polar solar wind at solar maximum: ULYSSES/URAP observations. AIP Conference Proceedings. |
|
|
Kaboré S, Ouattara F (2018). Magnetosphere convection electric field (MCEF) time variation from 1964 to 2009: Investigation on the signatures of the geoeffectiveness Coronal Mass Ejections 13(20):273-281. |
|
|
Kelley MC, Fejer BG, Gonzales CA (1979). An explanation for anomalous equatorial ionospheric electric fields associated with a northward turning of the interplanetary magnetic field. Geophysical Research Letters 6(4):301-304. |
|
|
Khazanov GV, Liemohn MW, Newman TS, Fok MC, Ridley AJ (2004). Magnetospheric convection electric field dynamics andstormtime particle energization: case study of the magneticstorm of 4 May 1998. Annales Geophysicae 22(2):497-510. |
|
|
Kikuchi T, Lühr H, Kitamura T, Saka O, Schlegel K (1996). Direct penetration of the polar electric field to the equator during a DP2 event as detected by the auroral and equatorial magnetometer chains and the EISCAT radar. Journal of Geophysical Research: Space Physics 101(A8):17161-17173. |
|
|
Kim H, Cai X, Clauer CR, Kunduri BSR, Matzka J, Stolle C, and Weimer DR (2013). Geomagnetic response to solar wind dynamic pressure impulse events at high-latitude conjugate points. Journal of Geophysical Research: Space Physics 118(10):6055-6071. |
|
|
Kivelson MG (1976). Magnetospheric electric fields and their variation with geomagnetic activity. Reviews of Geophysics 14(2):189. |
|
|
Kunduri BSR, Baker JBH, Ruohoniemi JM, Sazykin S, Oksavik K, Maimaiti M, Chi PJ, Engebretson MJ (2018). Recent Developments in Our Knowledge of Inner Magnetosphere-Ionosphere Convection. Journal of Geophysical Research: Space Physics 123:7276-7282. |
|
|
Lilensten J, Blelly PL (2000). Du soleil a? la Terre : Ae?ronomie et Me?te?orologie de l'Espace. Collection Grenoble Sciences. Presses Universitaires de Grenoble, 416. |
|
|
Maggiolo R, Hamrin M, De Keyser J, Pitkänen T, Cessateur G, Gunell H, Maes L (2017). The Delayed Time Response of Geomagnetic Activity to the Solar Wind. Journal of Geophysical Research: Space Physics 122(11):109-127. |
|
|
Maris G, Maris O (2009). Rapid solar wind and geomagnetic variability during the ascendant phases of the 11-yr solar cycles. Proceedings of the International Astronomical Union 5(S264):359-362. |
|
|
Matsui H, Puhl-Quinn PA, Jordanova VK, Khotyaintsev Y, Lindqvist PA, Torbert RB (2008). Derivation of inner magnetospheric electric field (UNH-IMEF) model using Cluster data set, Annales Geophysicae 26:2887-2898. |
|
|
Matsui H, Quinn JM, Torbert RB, Jordanova VK, Baumjohann W, Puhl?Quinn PA, Paschmann G (2003). Electric field measurements in the inner magnetosphere by Cluster EDI. Journal of Geophysical Research 108(A9). |
|
|
Matsui H, Torbert RB, Spence HE, Khotyaintsev YV, Lindqvist PA (2013). Revision of empirical electric field modeling in the inner magnetosphere using Cluster data. Journal of Geophysical Research: Space Physics 118(7):4119-4134. |
|
|
Maus S (2017). A corotation electric field model of the Earth derived from Swarm satellite magnetic field measurements. Journal of Geophysical Research: Space Physics 122(8):8733-8754. |
|
|
Maynard NC, Chen AJ (1975). Isolated Cold Plasma Regions: Observations and Their Possible Production Mechanisms. Journal of Geophysical Research 80(7). |
|
|
Mursula K, Lukianova R, Holappa L (2015). Occurrence of high-speed solar wind streams over the grand modern maximum. The Astrophysical Journal 801(1):30. |
|
|
Nagatsuma T, Kataoka R, Kunitake M (2015). Estimating the solar wind conditions during an extreme geomagnetic storm: a case study of the event that occurred on March 13-14, 1989. Earth, Planets and Space 67(1). |
|
|
Navia CE, Marcel MN de O, Augusto CRA, (2018). The Highest Geomagnetic Storms of the Solar Cycle Observed at Ground Level. Extreme Weather. |
|
|
Nishida A (1966). Formation of plasmapause, or magnetospheric plasma knee, by the combined action of magnetospheric convection and plasma escape from the tail. Journal of Geophysical Research 71(23):5669-5679. |
|
|
Nishimura Y, Kikuchi T, Wygant J, Shinbori A, Ono T, Matsuoka A, Nagatsuma T, Brautigam D (2009). Response of convection electric fields in the magnetosphere to IMF orientation change. Journal of Geophysical Research 114(A9). |
|
|
Partamies N, Juusola I, Tanskanen E, Kauristie K, Weygand JM, Ogawa Y (2011). Substorms during different phases. Annales Geophysicae 29(11):2031-2043. |
|
|
Pierrard V, Khazanov GV, Cabrera J, Lemaire J (2008). Influence of the convection electric field models on predicted plasmapause positions during magnetic storms. Journal of Geophysical Research 113(A8). |
|
|
Pokharia M, Prasad L, Bhoj C, Mathpal C (2018). A comparative study of geomagnetic storms for solar cycles 23 and 24. Journal of Astrophysics and Astronomy 39(5). |
|
|
Poudel P, Simkhada S, Adhikari B, Sharma D, Nakarmi JJ (2019). Variation of Solar Wind Parameters along with the understanding of Energy Dynamics within the Magnetospheric System during Geomagnetic Disturbances. Earth and Space Science 6(2):276-293. |
|
|
Revah I, Bauer P (1982). Rapport d'activité du Centre de Recherches en Physique de l'environnement Terrestre et Planétaire, Note technique CRPE/115, 38-40 Rue du Général Leclerc 92131 Issy-Les Moulineaux. |
|
|
Richardson IG, Cliver EW, Cane HV (2001). Sources of geomagnetic storms for solar minimum and maximum conditions during 1972-2000. Geophysical Research Letters 28(13):2569-2572. |
|
|
Richardson IG, Hilary VC (2012). Solar wind drivers of geomagnetic storms during more than four solar cycles. Journal of Space Weather and Space Climate 2(1). |
|
|
Schatten KH (2003). Solar activity and the solar cycle. Advances in Space Research 32(4):451-460. |
|
|
Schwenn R (2006). Space Weather: The Solar Perspective. Living Reviews in Solar Physics 3(2). |
|
|
Takalo J (2021). Comparison of Geomagnetic Indices During Even and Odd Solar Cycles SC17 - SC24: Signatures of Gnevyshev Gap in Geomagnetic Activity. Solar Physics 296(1):1-16. |
|
|
Thomsen MF (2004). Why Kp is such a good measure of magnetospheric convection. Space Weather 2(11). |
|
|
Trichtchenko L, Zhukov A, Van DLR, Stankov SM, Jakowski N, Stanis?awska I, Juchnikowski G, Wilkinson P, Patterson G, Thomson AWP (2007). Space weather events: Real-time observations and forecasts. Space Weather 5(6). |
|
|
Tsurutani BT, Gonzalez WD, Tang F, Akasofu SI, Smith EJ (1988). Origin of interplanetary southward magnetic fields responsible for major magnetic storms near solar maximum (1978-1979). Journal of Geophysical Research 93(A8):8519. |
|
|
Wu L, Gendrin R, Higel B, Berchem J (1981). Relationships between the solar wind electric field and the magnetospheric convection electric field. Geophysical Research Letters 8(10):1099-1102. |
|
|
Zerbo JL, Amory-Mazaudier C, Ouattara F (2013). Geomagnetism during solar cycle 23: Characteristics. Journal of Advanced Research 4(3):265-274. |
|
|
Zerbo JL, Amory-Mazaudier C, Ouattara F, Richardson JD (2012). Solar wind and geomagnetism: toward a standard classification of geomagnetic activity from 1868 to 2009. Annales Geophysicae 30(2):421-426. |
|
Copyright © 2024 Author(s) retain the copyright of this article.
This article is published under the terms of the Creative Commons Attribution License 4.0


