Countries lack the infrastructure to deal with the drainage following flashfloods from localized downpours which may originate from localized evaporation or its combination with that from surroundings or from hurricanes. The natural distribution of water is the best and optimum for the globe. Among the world’s riparian countries, India makes her territory both the sources and the sinks of river discharges by constructions of dams, reservoirs, barrages, weirs, etc. on international rivers and diversion of their courses within herself. Water confinement constructions make rivers silted heavily reducing their discharge capacities all through but more so in the downstream. The two catastrophic incidences – 2013 Uttarakhand and 2014 Jammu-Kashmir - presented in this article vouch for the curses of water confinement. Theoretical treatments have been provided for studying the impacts on the climatic variables for pre- and post-dam periods. Against the backdrop of these incidences, India has threatened her western neighbor of cutting off water supply which she has already done to the eastern neighbor. She, however, opens the gates of all dams and barrages built upstream of the river-silted eastern neighbor Bangladesh and floods that country causing irreparable losses of lives and properties, and adding misery to millions of people when India fails to accommodate excess water. On top of this confinement of river discharges within India, she has been working on the master plan of river networking. It is imperative for judges of international arbitration court, donors, World Bank, policy makers, etc. etc. to take lessons out of this study.
Water has the highest potential, on any account, to cause climate change. Nature has set up weather pattern over eons based on the distribution of the water resources. The established pattern can withstand up to certain amount of perturbation introduced via exploitation of water resources by anthropogenic activities. Beyond this point, on a microscale compared to continental or global one, harshness and irregularities in weather phenomena can occur. Infrastructures are made to withstand average effects but not the extreme ones which happen rarely. Rainfalls beyond the usual amount lead to difficult drainage. On top of these, rivers lose drainage capacities through obstructions to discharge and water-holding capacities through silt deposition in the wake of constructions of dams and barrages. In the gas dynamics of weather phenomena, the mixture of two masses of gas a very large number of molecules of a certain mass, occupying a certain volume and a total energy occurs; it results in finite probabilities of multiple macro states defined as a set of microstates that refers to the state of each element of the system.
In the equilibrium condition of the system, only a tiny fraction of the macrostate has a reasonable probability of occurring. If any exchange of volume through expansion of one gas and contraction of the other occurs on top of exchange of energy (which is common in the weather phenomena), the multiplicity function of a component gas will have a sharp peak of width equal to the ratio of the combined total volume and the square root of the total number of molecules. It is very likely that some macrostate multiplicity may satisfy the critical conditions for production of extreme events. Recently, localized extreme events of flooding occurred in several countries, viz. in Australia, USA, European, Asian, and African countries (
https://en.wikipedia.org/wiki/List_of_floods).
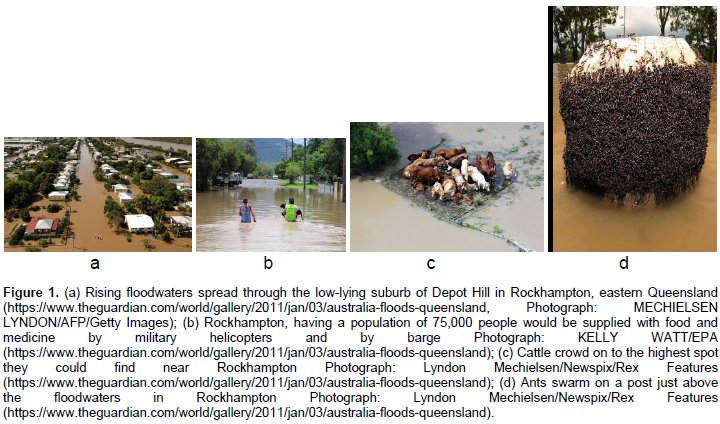
Just to give a few examples for the current decade, Queensland City in Australia was cut off in 2011 as floodwater hit an area the size of France and Germany (Figure 1a to d), affecting 200,000 people in more than 20 towns and cities (Australia News, 2011; https://www.theguardian.com/world/gallery/2011/jan/03/australia-floods-queensland;
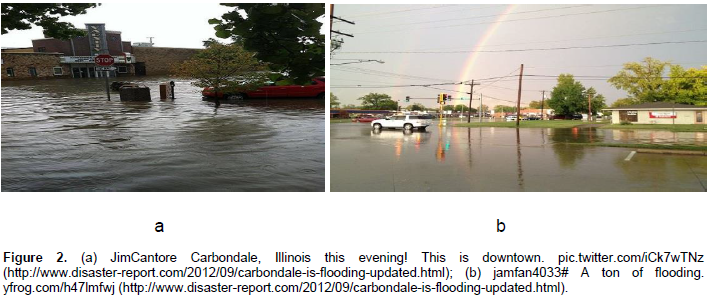
https://www.google.com/search?q=KELLY+WATT/EPA+in+Rockhampton+flood+image&tbm=isch&tbo=u&source=univ&sa=X&ved=0ahUKEwjb6PHh5ejVAhVBzlQKHUc-CpcQsAQIJQ&biw=1467&bih=719#imgrc=6AYeEdCocpBVLM).The city of Carbondale in Southern Illinois in the USA was hit by flood in 2012 (Figure 2a and b). There were reports of very high water near railroad tracks into Carbondale. Highway 13 was closed (http://www.disaster-report.com/2012/09/carbondale-is-flooding-updated.html).

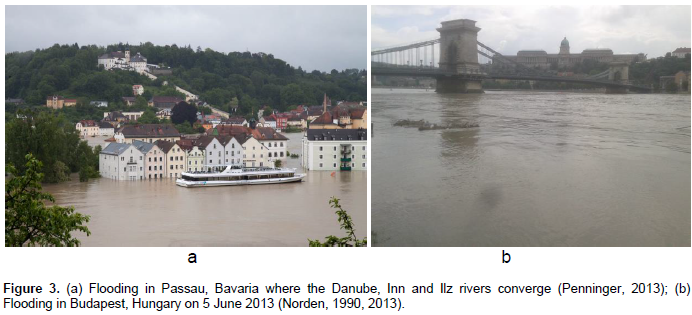
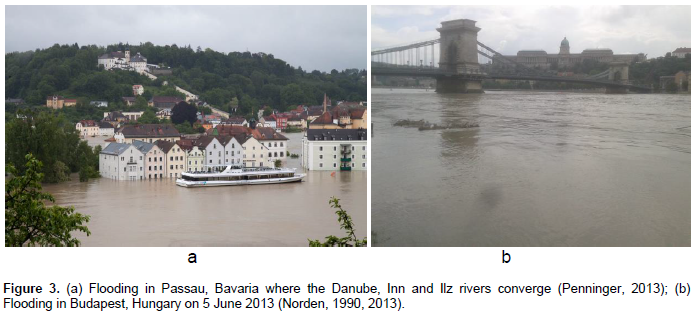
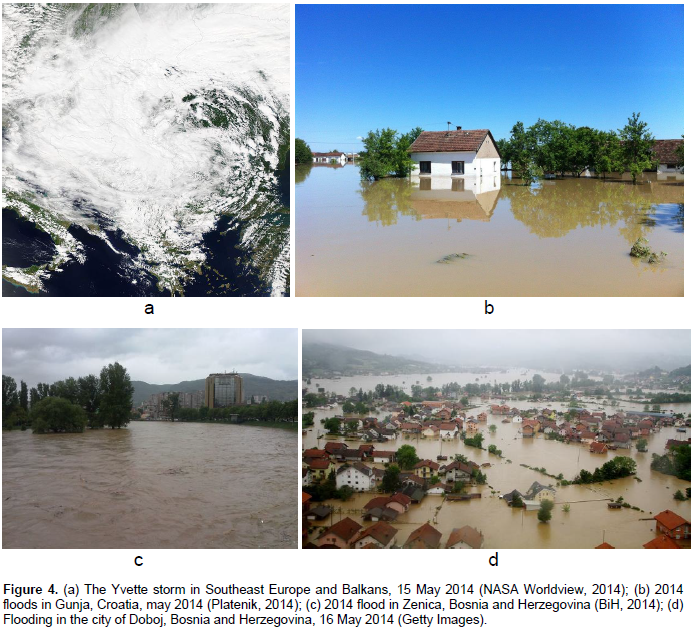
In 2013, the Danube River, the Elbe River and their distributaries were flooded (Figure 3a and b) after several days of rain in late May and early June in the year 2013, one of the wettest including 1962 and 1965 in the last 156 years. The affected countries were German, Czech Republic, Austria, Switzerland, Slovakia, Belarus, Poland, Hungary, and Serbia (Vojvodina) (https://en.wikipedia.org/wiki/2013_European_floods) and the references therein. A cold polar air mass from Central Europe entered into the Mediterranean Basin causing a mixture with the humid subtropical air forming a very low pressure cyclone termed Tamara and Yvette. It caused a rainfall breaking 120 years of records (Figure 4a to d). The devastating cyclone took place during May 13 and 18, 2014 (https://en.wikipedia.org/wiki/2014_Southeast_Europe_flood: Herold, 2014). More news, images and videos of the worst floods occurring every year somewhere on the globe are available in multiple sites (https://news.search.yahoo.com/search;_ylt=A0LEVzdjtJhZGMYAJjxXNyoA;_ylu=X3oDMTEyNzVrY2ZyBGNvbG8DYmYxBHBvcwMxBHZ0aWQDQjQ0ODNfMQRzZWMDc2M-?p=worst+floods+in+2015&fr=tightropetb&fr2=cosmos; https://search.yahoo.com/search?ei=utf 8&fr=tightropetb&p=worsts+floods+in+2016&type=75989_080317).

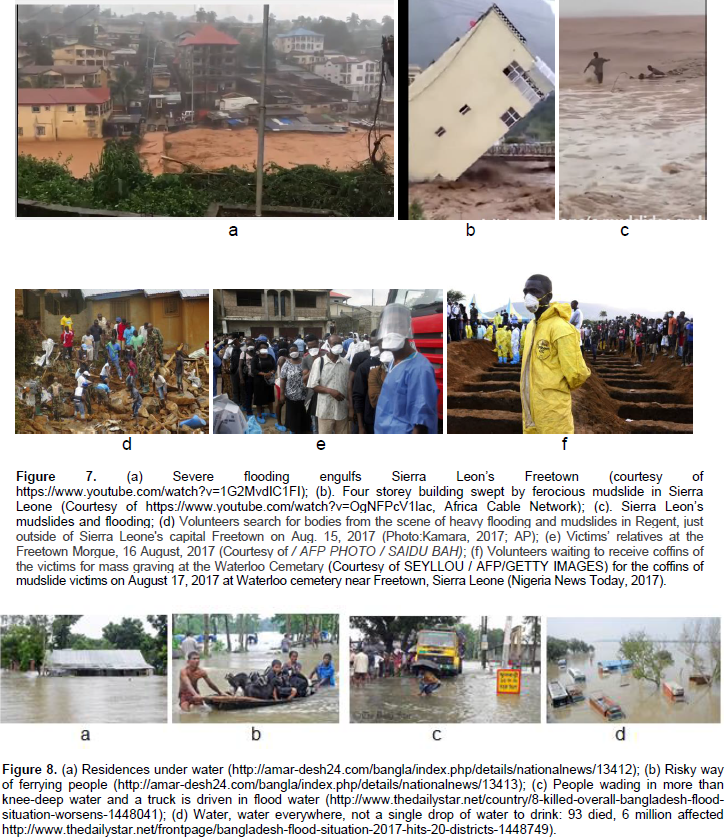
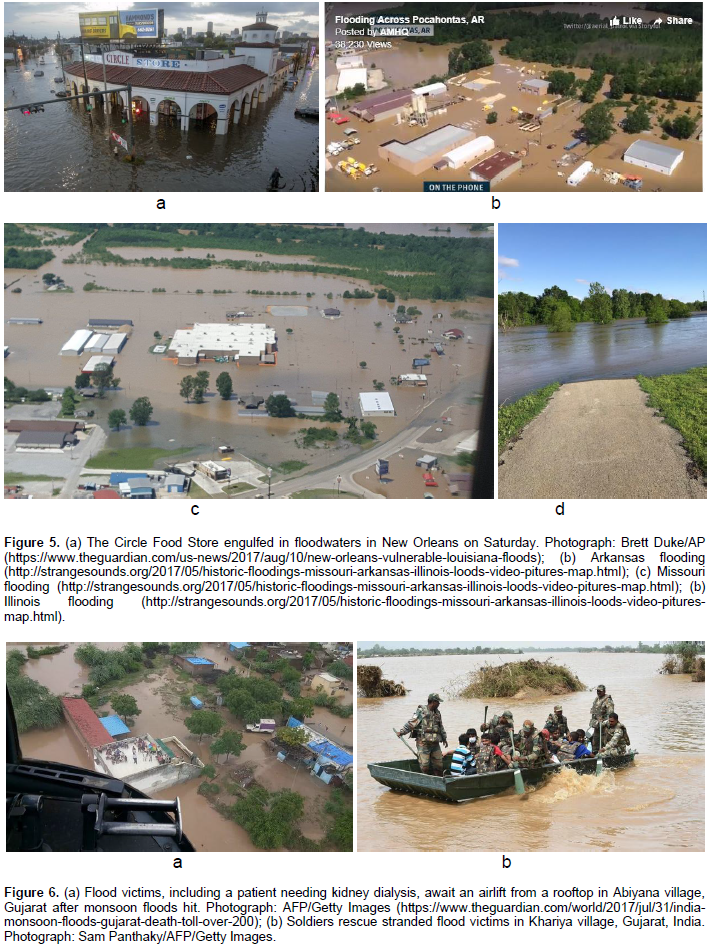
In the current year 2017, New Orleans streets in the state of Louisiana in the USA fell under waist-high water (Figure 5a) in the wake of the day-long deluge on Saturday, August 5, 2017 (Lartey, 2017). Weekend storm and heavy rainfall flooded and caused closure of hundreds of roads in Missouri, Arkansas, and Illinois (Figure 5b to d). A major waterway was shutdown (Sounds, 2017). As of 31 July, 2017 10:32 EDT, 231 died in Gujarat, India (Figure 6a and b), but the figure was rising with receding water. Nearly 130,000 people were relocated. More than 150 factories were shut down, about 50,000 cotton farms got water logged, and more than 4,000 animals were killed. Nearly 700 people died across India in the monsoon season (Safi, 2017). During the time July 1 and August 13, Sierra Leone’s Freetown received more than 27 inches of rain which is more than double the average of 11.8 inches, according to the US National Weather Service's Climate Prediction Center. As of August 15, the death toll rose to 245.

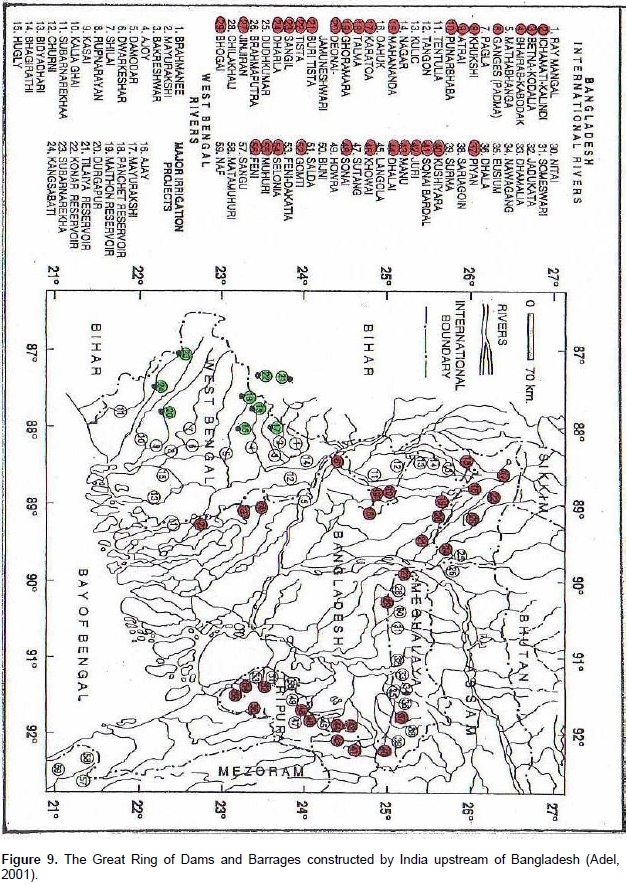
The number was expected to grow. People were desperately hunting for 600 people missing ones. The number of displaced people lay between 2,000 and 3,000 (The Associated Press, 2013; CNN, 2017). Figure 7a to f shows some of the tragic scenes. In Bangladesh, the Daily Star newspaper reported a dangerous flood in the country (Daily Star, 2017a) echoed by the joint report of the UNO resident coordinator and the European Union’s Joint Research Center in Bangladesh (Figure 8a). In the developing news, the daily continued reporting 12 drowned (Figure 8b) in the northern part of Bangladesh (Daily Star, 2017b). Also, the English Daily Star reported 8 deaths and 5 missing (Figure 8c) on August 13, 2017 in the newly worsening flood situation in Bangladesh (UNB, 2017). The Daily Star last reported 20 deaths and about 6 million marooned in water (Daily Star, 2017c; http://amar- desh24.com/bangla/index.php/details/nationalnews/1373 6#). India opens the gates of all dams and barrages built upstream of the river-silted Bangladesh (Figure 9); it floods the country causing irreparable losses of lives and property and adding misery to millions of people when India fails to accommodate excess water.

Bangladesh falls into double trouble if she suffers from flood caused by onsite rainfalls and flooding. This is as a result of Indian release of floodwater. In some years, India drowned Bangladesh twice by flood in the same season. As the anthropogenic activities of changing the virgin environment have increased in coverage, so the feedback effect from nature has increased spatially and temporally. The frequency of natural disasters like tornadoes, tsunamis, floods, etc., has increased in space and time. Tornadoes are followed by heavy rainfalls that cause flashfloods. By far the most important factor of flooding treated in this article as obtained from the general causes of flood (Asumadu-Sarkodie et al., 2015a; Scottish Government, 2008) is the poor drainage capacity of dammed rivers and stream channels rendered by anthropogenic activities of tampering with water resources. Pujari and Dandekar (2013) analyzed Uttarakhand rainfalls for 1901 through 2013 to find maximum rainfalls which were heavier in 1922 (685.6 mm in August) than in 2013 (510.4 mm in June-July 3). The most devastating flood occurred in 2013, clearly indicating the impact of anthropogenic activities in causing the disastrous event. This article focuses on the backdrop of the anthropogenic activities that brought the climax event mentioned in the title.
Project site
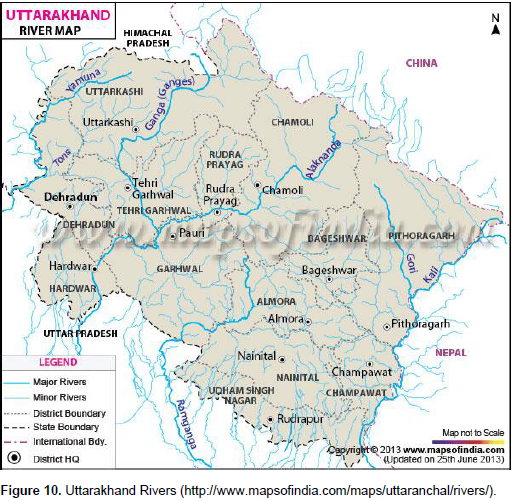
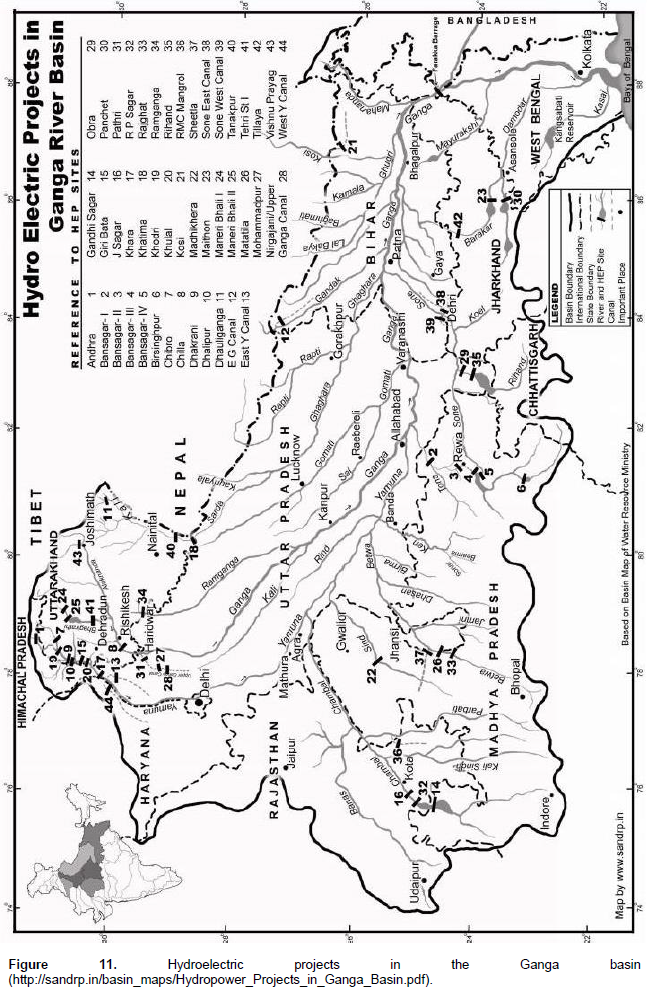
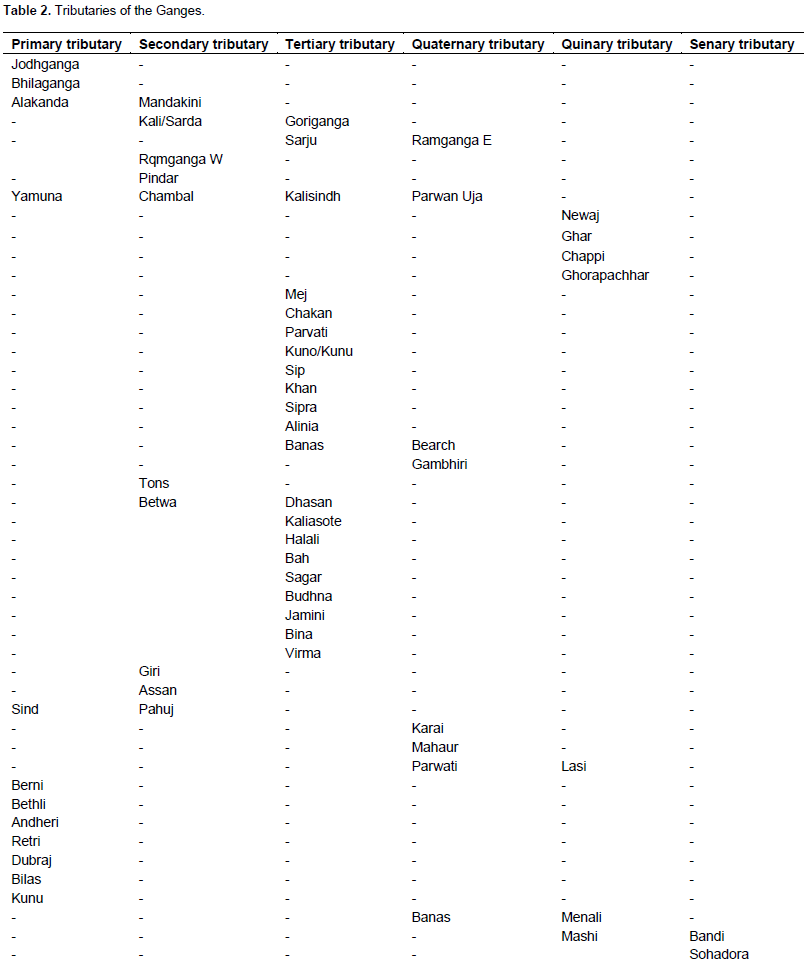
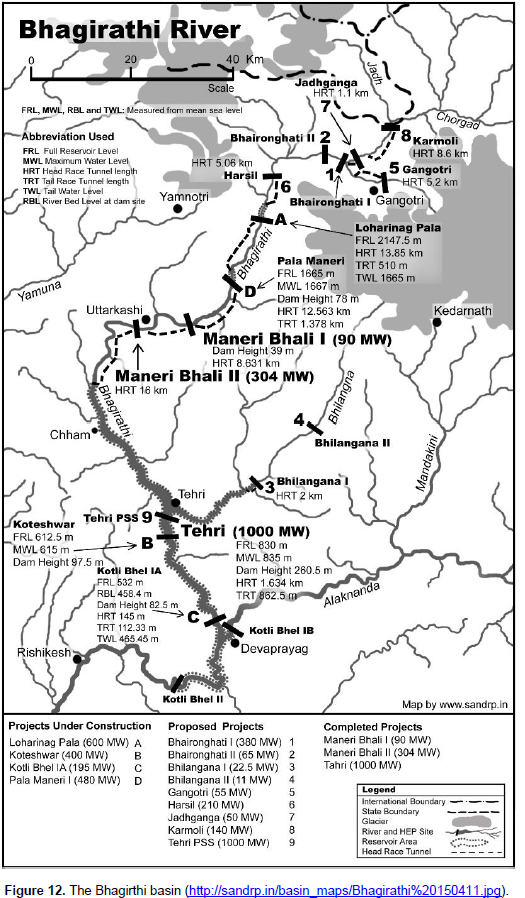
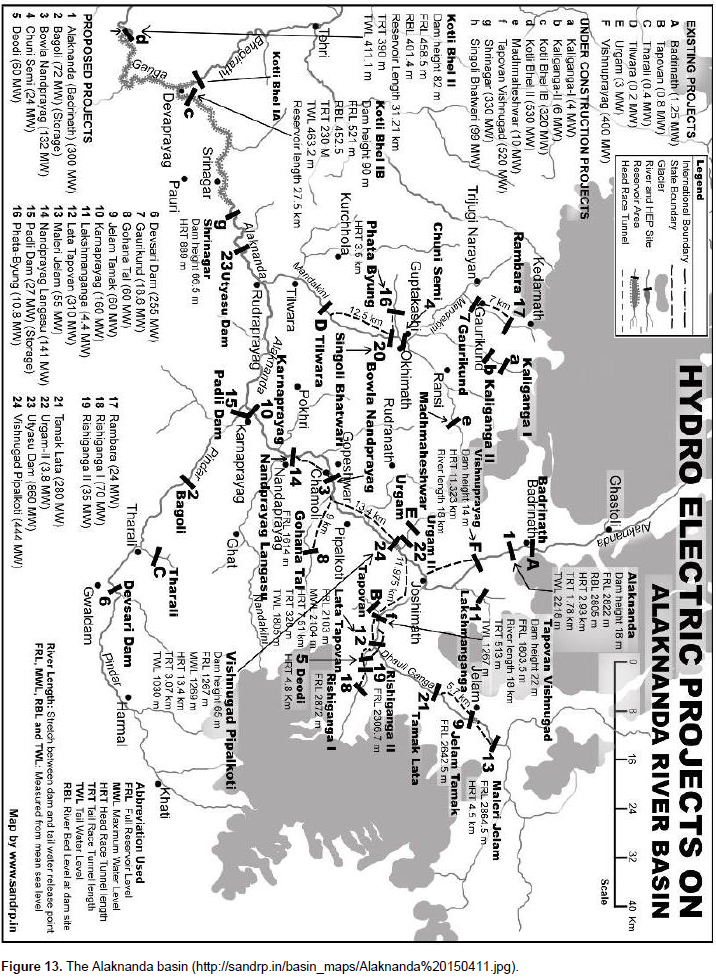
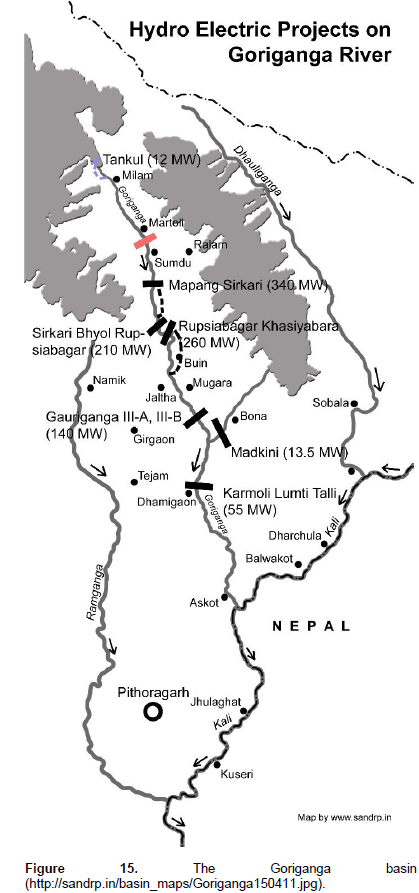
The event under study occurred in the hilly state of Uttarakhand (Figure 10) in Northern India (Figure 11) and in Kashmir (Figure 45). Uttarakhand land area is about 53,484 km2. It was founded on 8 November 2000. According to 2012 Census, its population is 10.08 million. The rivers that include the Ganges and its tributaries in Uttarakhand are the Alakanda River, the Bhagirathi River, the Bhilaganga River, the Dhauliganga River-Garhwal, the Dhauliganga River-Kumaon, the Ganga River, the Gaula River, the Gori Ganga River, the Kali River, the Kosi River, the Mandakini River, the Nandakini River, the Naya River-Easter, the Naya River-Western, the Pindar River, the Ramganga-Western, the Ramganga -Eastern, the Saryu River, the Tons River, and the Yamuna River ( Adel, 2013, 2015a, b, c, d, e). All these are prominent rivers of India. In Uttaranchal, the cultivable land is 784,117 hectares that support 90% of its population’s livelihood of cultivation. Irrigation is done on about 12% of the land and feeding from natural springs is done in 64% of the land.

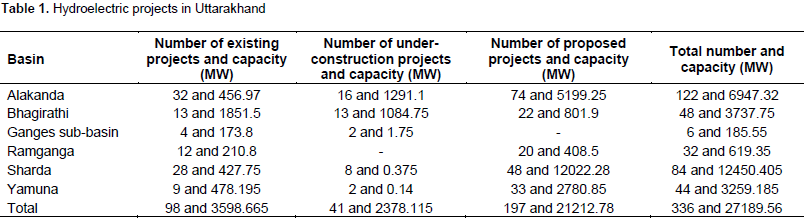
More than 61% of the land is forested. The net sown area is roughly 14%. The gross irrigated area is less than 50% of the net sown areas. Soil is mostly sandy that fails to retain water. Rice, barley, wheat, and corn are major crops (http://efreshglobal.com/efresh/Content/Country.aspx?u=utk;http://agropedia.iitk.ac.in/content/present-scenario-agriculture-uttarakhand). Hydropower projects in Uttarakhand (SANDRP, 2013) are shown in Table 1. Hydropower projects require deforestation, building of dams, diversion structure, desilting mechanism, 5- to 30-km long tunnels wide enough to carry three trains side by side, and also roads, townships, mining, among other components, massive proportion blasting, etc. Further, the activities of constructions of dams, reservoirs, barrages, weirs, etc., which in a cluster can form a mini land-locked ocean introduce the perturbation factor in the weather system. Concentration of these structures over a locality or irrigation over wide spread areas contributes to additional vapors favoring rainfalls. All of these basically affect the land use and land cover (LULC) changes and thence the climate.

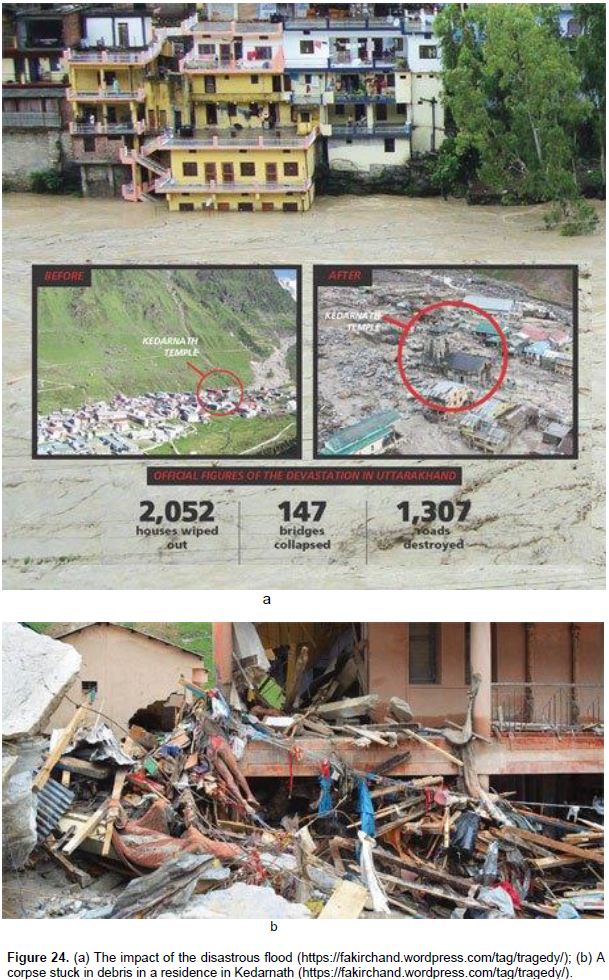
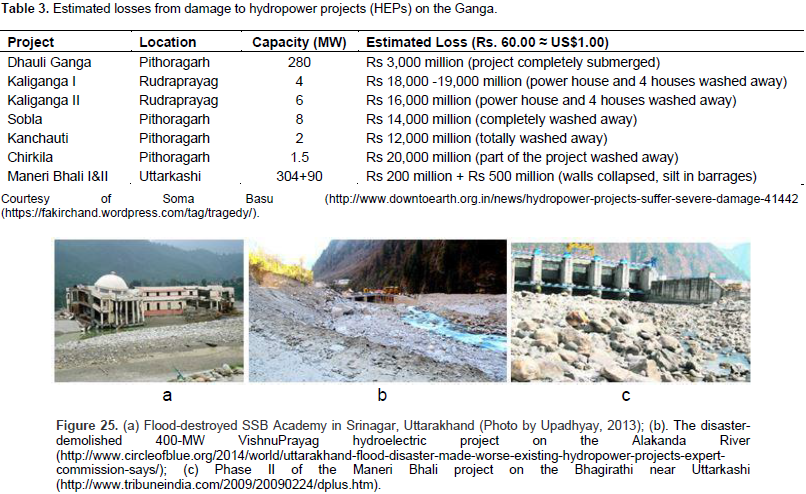
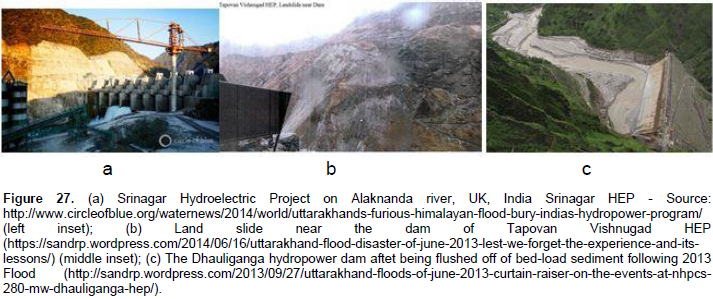
The unfolding of the tragedy including rotten corpses flowing down the Ganga in Uttarakhand was reported by Soma Basu on September 11, 2016 (https://fakirchand.wordpress.com/tag/tragedy/). Some of Bosu’s pictures appear in Figure 24. Table 3 provides an estimated loss, converting the numbers of Basu in millions and showing the equivalence of rupees with US dollars, incurred by the hydroelectric projects. To mention a few of the damaged hydroelectric projects, the flood seriously damaged 10 large projects that included operational and underconstructional ones in that state. It destoyed 19 small size (<25 MW) operational projects. Floodwater surged over the 16.76-m high dam of the Vishnuprayag Hydroelectric Project on the Alakanda River and boulders buried it under 18.3-m thick rubbles. Figure 25 (reproduced with permission from SANDRP) shows some of the destructions. Boulders brought by the swelling river current battered the VishnuprayagHydroelectric Project on the Alakanda River. Mud and silt piled up on the damtop. The concrete cracked and ruptured, and the steel reenforcing bars were exposed. Its capacity was 400 MW.


It took five months to remove much of the piles of boulders on the dam. The project was buried under 20 m of rubbles, its reservoir got filled with rubbles, and the penstock was likely wrecked. Further, the severe consequences included back- flowing of the river to the reservoir behind the dam, filling it with rubbles, opening of a new channel around its eastern side, and washing away of the operating offices and a national highway (http://www.circleofblue.org/2014/world/uttarakhand- flood-disaster-made-worse-existing-hydropower-projects-expert-commission-says/). The walls of both the dams of the 25-year old and 99-MW generating Maneri Bhali-I and the five-year-old 304-MW generating Maneri Bhali-II (Figure 25c) on the Bhagirathi River collapsed. Also, it affected the Banbasa Project on the Sarda River near Nepal. The Singoli-Bhatwari Hydroelectric Project (Figure 26a) was constructed on the Mandakini River, a headstream of the Alaknanda River. The 99-MW capacity project was so destructively attacked by the gushing water that large concrete chunks were gouged out of its foundation bending and deforming the exposed steel reinforcing rods.
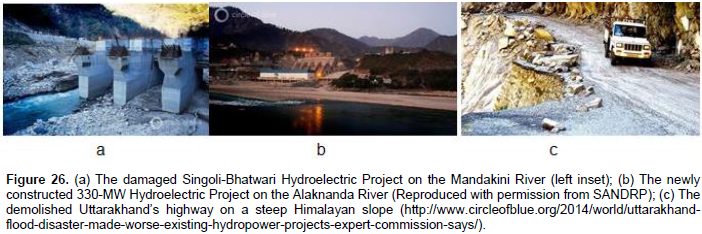
The 330-MW Hydroelectric Project on the Alaknanda River is shown in its new condition in Figure 26b and in its demolished condition in Figure 27a. The disaster destroyed more than 1,000 km of the state’s one-way-in, one-way-out highway (Figure 26c). Another severely damaged huge project was the 330-MW Alaknanda Hydro Power Project in Srinagar (Figure 27a). The floodwater inundated the power station. The turbine got stuck with the deposition of mud and grit. The project’s opening was delayed from October 2013 to March 2014. Included among the under-construction dams that were damaged are the 520-MW Tapovan Vishnugad Dam (Figure 27b) on a tributary of the Alaknanda River that lost the tunnel carrying water to the power house, and the 171-MW Lata Tapovan Project got its concrete work damaged. Also, a landslide blocked the discharge tunnel end at the 280-MW Dhauliganga Power Project (Figure 27c). The closure caused the backup water submerged the entire turbine room that was set deep inside the hill by the dam. It was a damage of at least $50 million (Schneider, 2014).

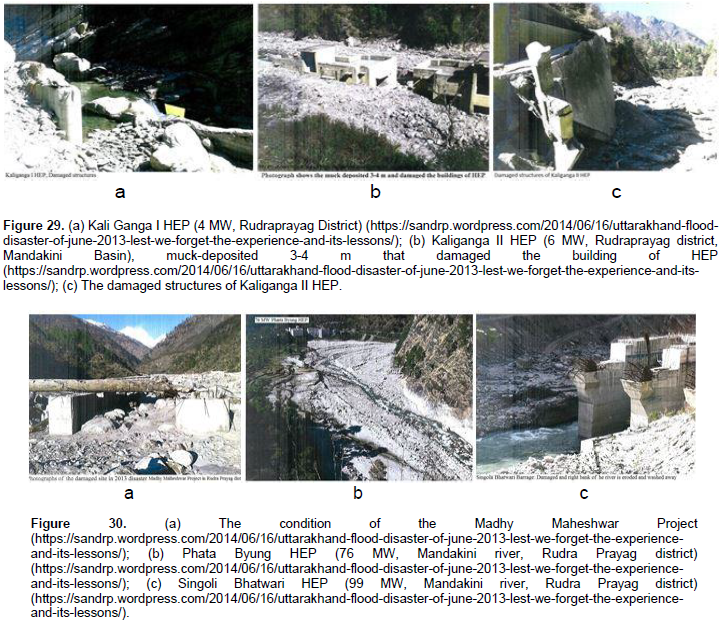
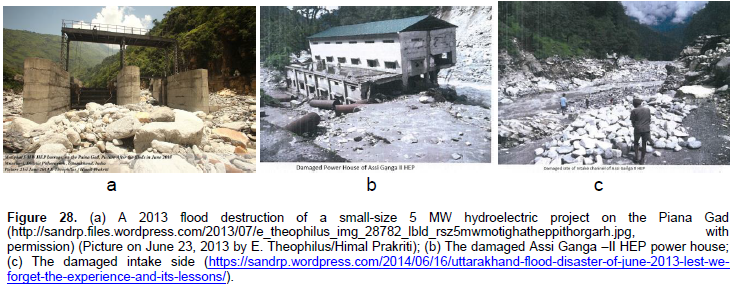
Piana Gad is a small hydroelectric project. Its demolished condition is shown in Figure 28a. The under-construction Assi Ganga-II project had a reservoir depth of 3 m and the full reservoir level was 1,372.95 m high. Its catchment area was 167 km2. Its design discharge was 8.56 cumecs. The total length of the water conductor system was 2.162 km, and the river was diverted over a distance of 2 km. Its damaged condition is as shown in Figure 28b and c. The damaged condition of Kali Ganga I HEP of 4 MW and Kaliganga II HEP of 6 MW in Rudraprayag District in the Mandakini River basin are shown in Figure 29. The post-disaster condition of the Madhy Maheshwar Project in Rudra Prayag District appears in Figure 30a. Figure 30b shows the image of the Phata Byung HEP of 76 MW on the Mandakini River in Rudra Prayag District. The upstream of the dam site shows 10 to 15 m eroded material deposited in the Mandakini River bed. Figure 30c shows the condition of the Singoli Bhatwari HEP of 99 MW on the Mandakini River in Rudra Prayag District.

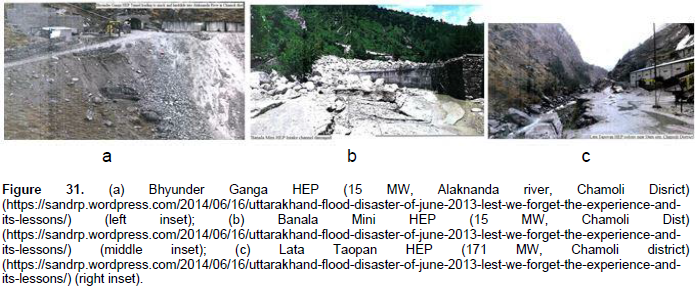
The damaged Bhyunder Ganga HEP of 15 MW on the Alaknanda River in Chamoli District is shown in Figure 31a and the Banala Mini HEP 15 MW in Chamoli District in Figure 31b. The Lata Taopan HEP of 171 MW in Chamoli District appears in Figure 31c. The establishment of too many structures of water resources exploitation at a place leads to loses of the local natural balance. The virgin state may be altered within certain limits, but not limitlessly. It establishes the local climate which is a long-time average effect. Having fulfilled the upstream demand, the water fluid should be left to flow in response to its properties. The flood of 2013 was a reminder to the Indians of this lesson. Had there been not so many dams/reservoirs and barrages, the swelling rivers could quickly discharge their water, and the incessant rain might not even occur because of the lack of the support from the locally produced water vapor. The huge loss of lives and properties could be saved.
Facts and Figures: Projects in the Indus Basin
The Indus River
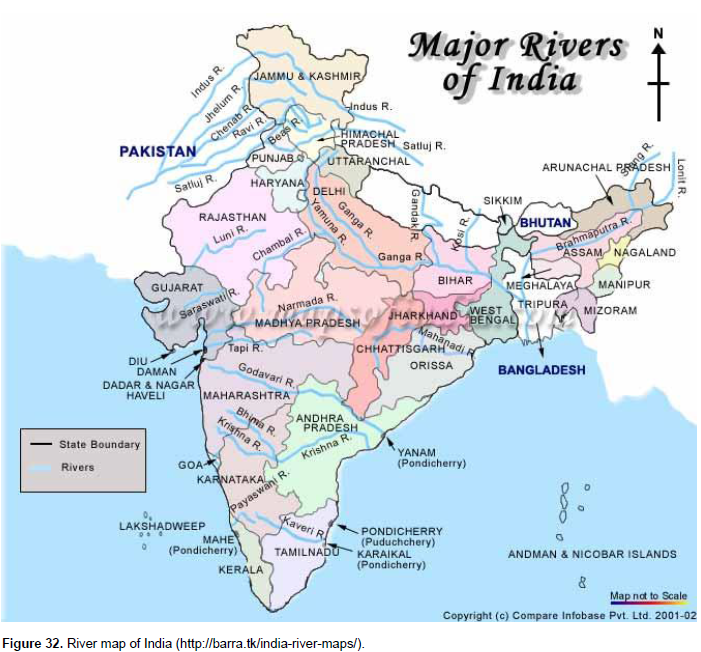
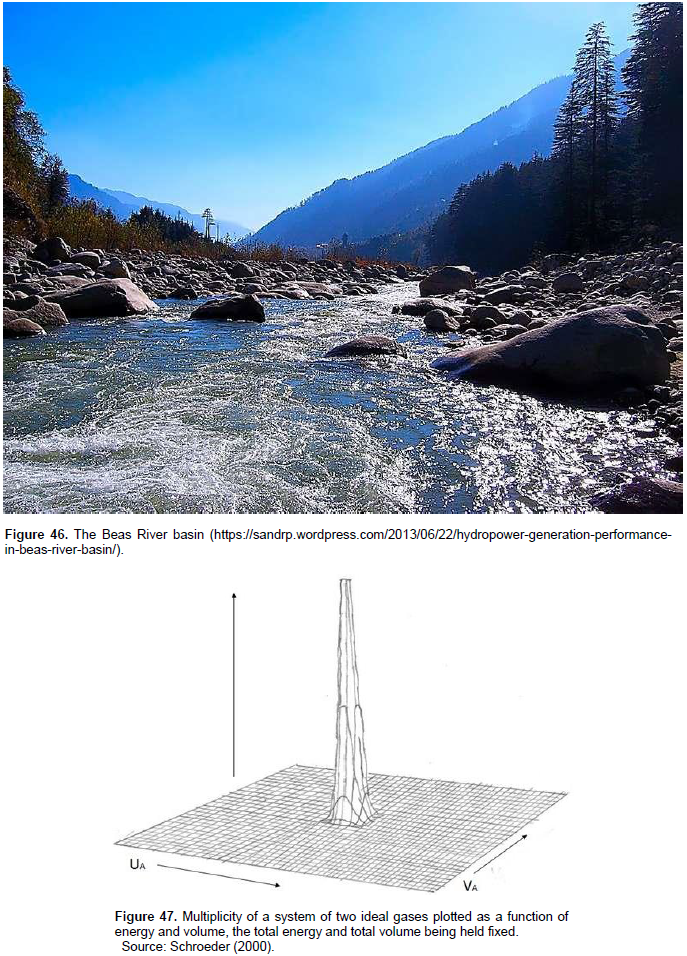
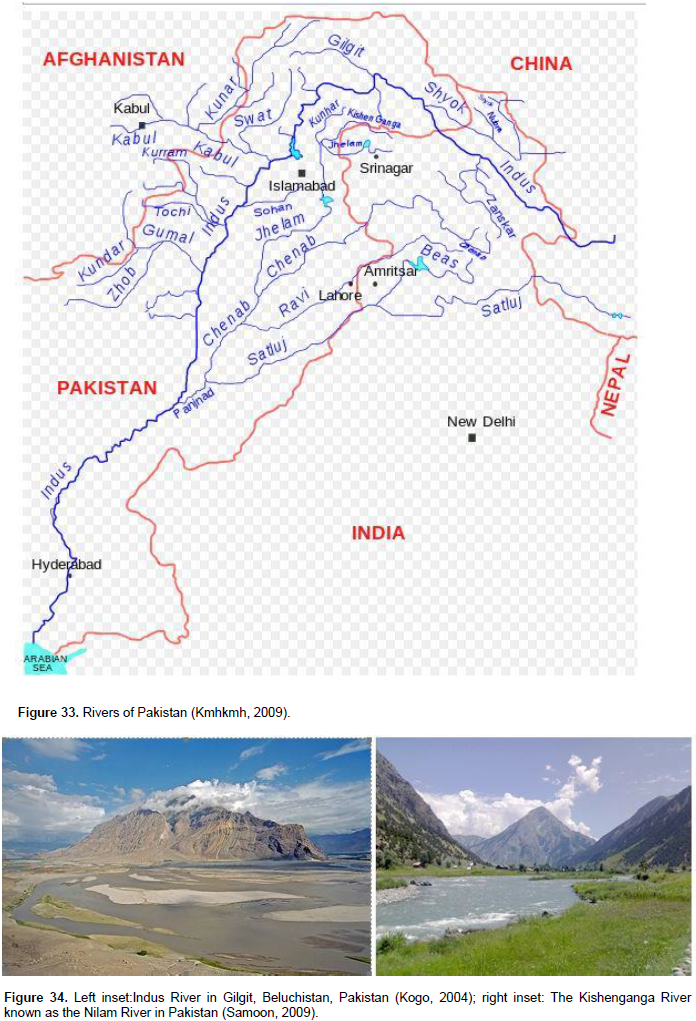
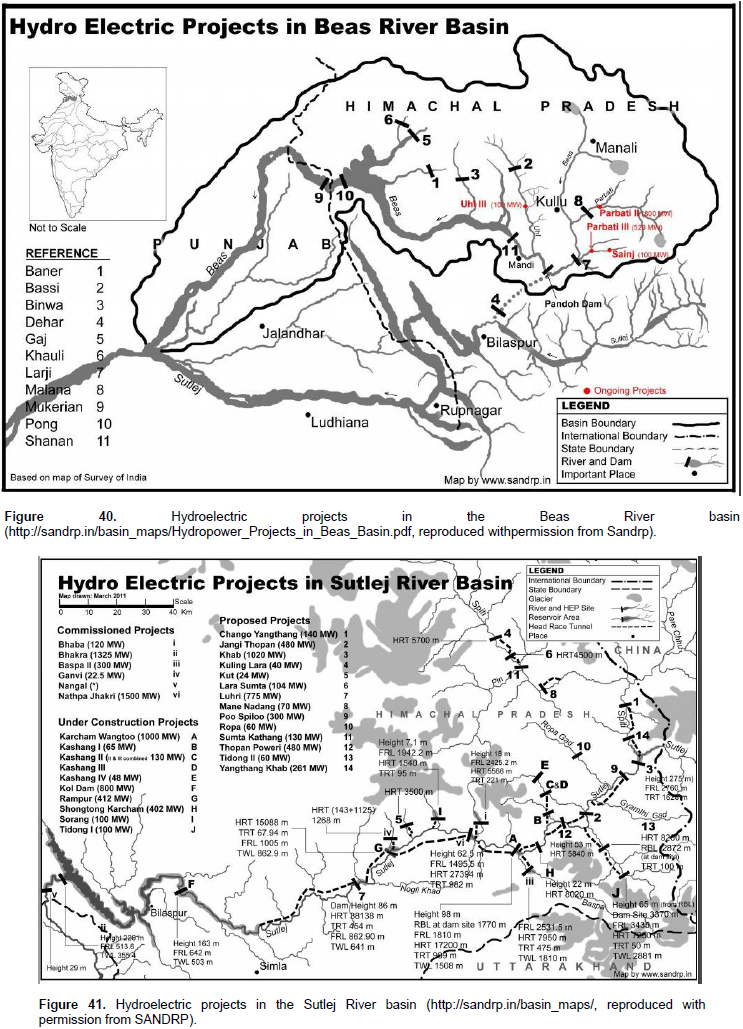
The Indus River (Figure 32, 33 and 34) has length of 3,200 km and a discharge of 6,600 cumecs. Its basin is spread over Pakistan (47%), India (39%), China (8%), and Afghanistan (6%) and these countries have 65, 14, 1, and 11% of their land, respectively, in the Indus Basin (http://www.fao.org/nr/water/aquastat/basins/indus/index.stm). The origins of the rivers of Pakistan being in India (Figure 33), Pakistan feared that India could close the supply of water to Pakistan at times of tensions or wars between the two countries. The World Bank mediated the water sharing treaty between the two countries and it was signed by the Indian Premier and the Pakistani President on 19 September 1960. Although these two countries fought wars, they did not fight for water rights since treaty was signed. It is said to be one of the most successful treaties. According to the treaty, Pakistan got exclusive rights over the Chenub, the Jhelum, and the Indus called the Western River, and India got exclusive rights over the water of the Ravi, the Beas (Figures 32 and 46), and the Sutlej called the eastern rivers (Figure 33). All these rivers join the Indus on its east side.


LULC in the Indus Basin
The followings are the dams in the Indus Basin covering up to India-Pakistan International Border in the state of Jammu and Kashmir of 222,229 km2 serving a population of 12.55 million as of 2011 (http://www.india-wris.nrsc.gov.in/wrpinfo/index.php?title=Dams_in_Jammu_and_Kashmir):
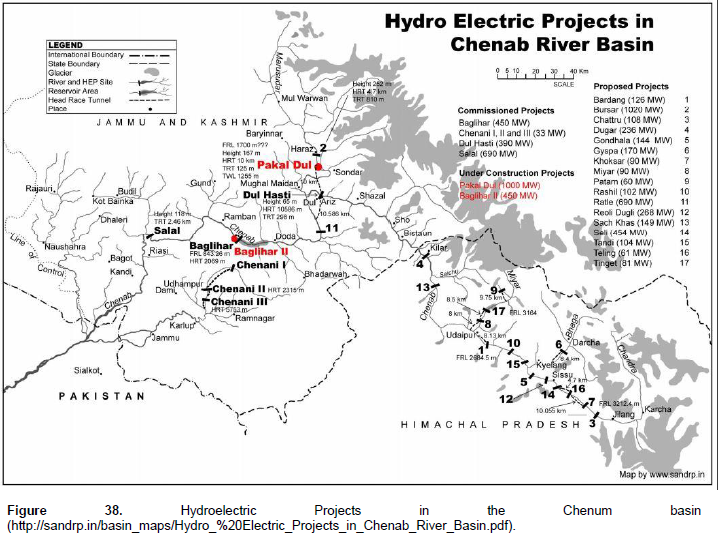
(1) 143-m high and 364.362 m long Baglihar Dam on the Chenab near Ramban City in Ramban District in the Indus Basin up to International Border;
(2) 65-m high 186-m long Dulhasti Dam on the Chenab near Kishtwar City in Kistwar District in the Indus Basin up to International Border;
(3) 37-m high, 189-m long Kishenganga Dam on the Kishenganga in Bandipur;
(4) 57-m high, 247-m long Nimoo Bazgo Dam on the Indus near Leh City in Leh (Ladakh) District;
(5) 227-m long Niu Karewa Storage Yusmarg Dam near Chadura City;
(6) 167-m high, 305-m long Pakal Dul Dam on Marusudar in Kishtwar District;
(7) 113-m high, 487-m long Salal (Rockfill And Concrete) Damon the Chenab near Gool Gulab Garh City in Reasi District;
(8) 53-m high, 114-m long Sewa St II Dam on Sewa near Bashohli City in Kathua District;
(9) 176-m long Uri-II Dam on the Jhelum near Uri City in Baramula District.
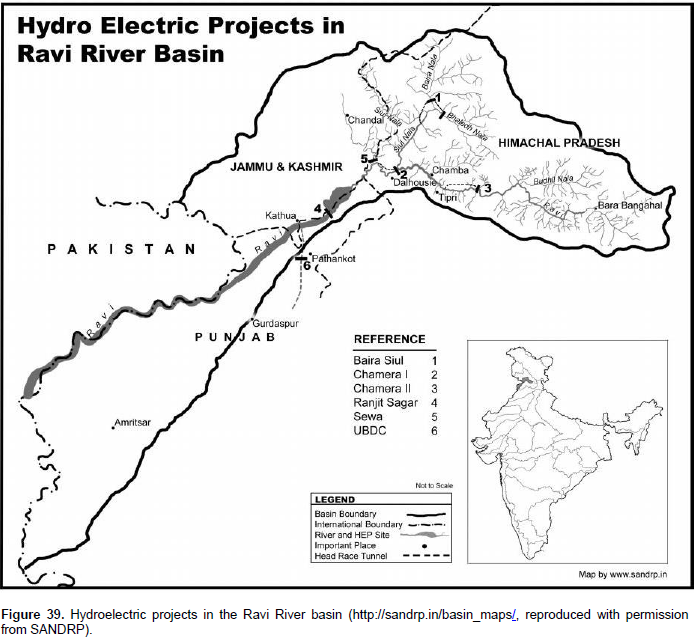
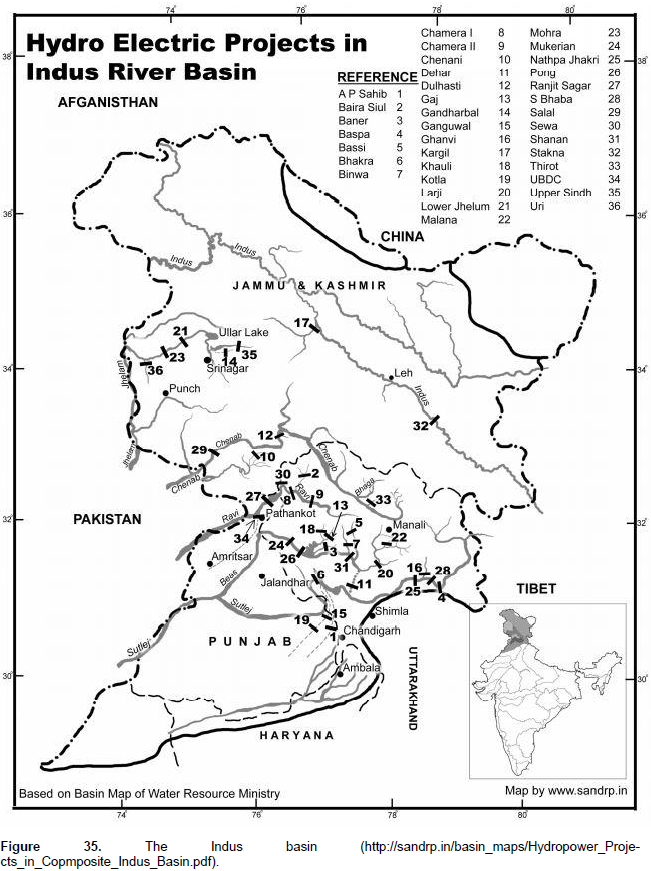
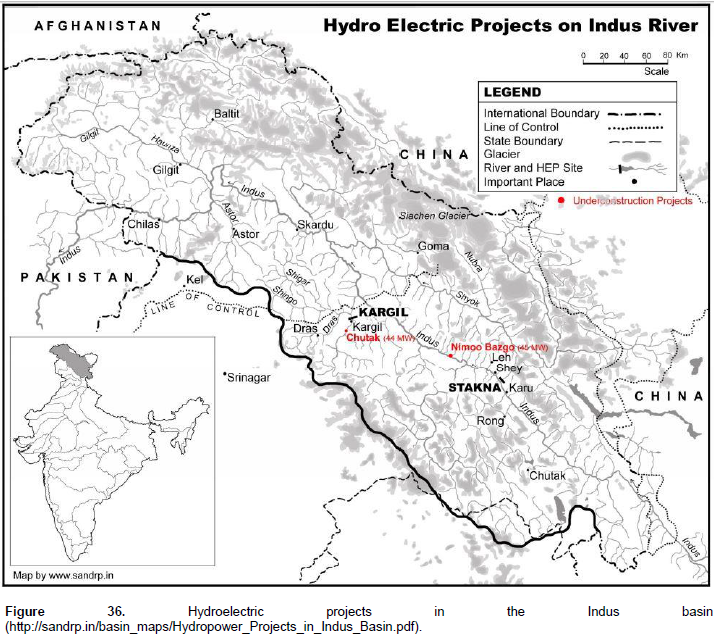
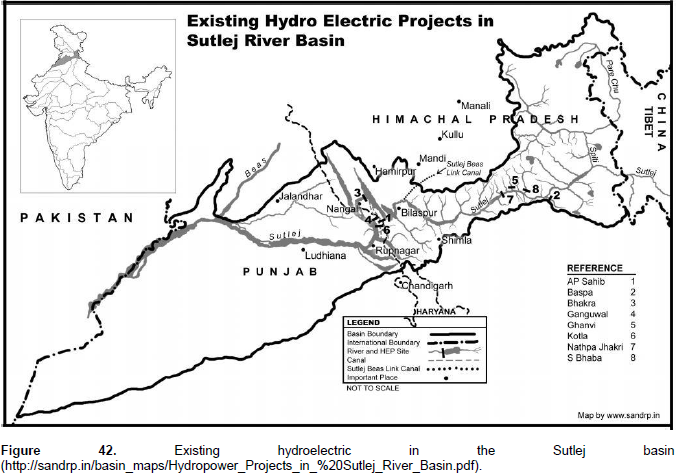
The rivers of Pakistan that have origins in India are as shown in Figure 33. The hydroelectric projects in the Indus Basin, on the Indus River, on the Jhelum River, in the Chenab River basin, in the Ravi River Basin, in the Beas River Basin, and in the Sutlej River Basin are as shown in Figures 35, 36, 37, 38, 39, 40, and 41, respectively. Figure 42 shows the existing projects in the Sutlej River basin.


The Indus Basin 2014 Jammu-Kashmir disaster
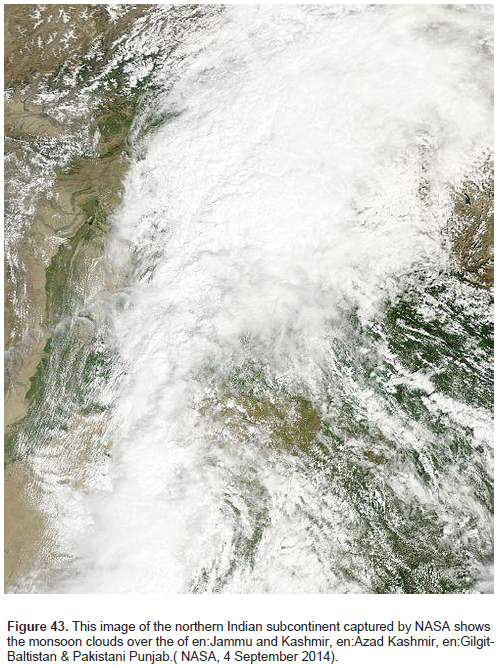
The 2014 India-Pakistan flood may be attributed to the same reason that causes anthropogenic activities. Above this dam-abundant area in the sky, NASA noticed the cloud imaged in Figure 43. This reenforces the idea of locally generated abundant moisture in the air that formed the cloud. The downpour started from September 2, 2014. The state of Jammu and Kashmir had incessant rainfall from September 2, 2014 onward that caused Srinagar’s Jhelum River discharge 70000 cumecs against the normal discharge of 25000 cumecs. The catastrophic rainfall submerged 390 villages in Kashmir, partially affected 1225 villages and affected 1000 villages in Jammu Division.
Adjoining areas of Pakistan were also affected (Greater Kashmir newspaper official website. Retrieved on 7 September 2014.
http://www.greaterkashmir.com/news/2014/Sep/5/kashmir-floods-throw-life-out-of-gear-6.asp; "Flood Situation Grim in Jammu and Kashmir, Army Called for Rescue Efforts". New Indian Express. 5 September 2014. Retrieved 7 September 2014;
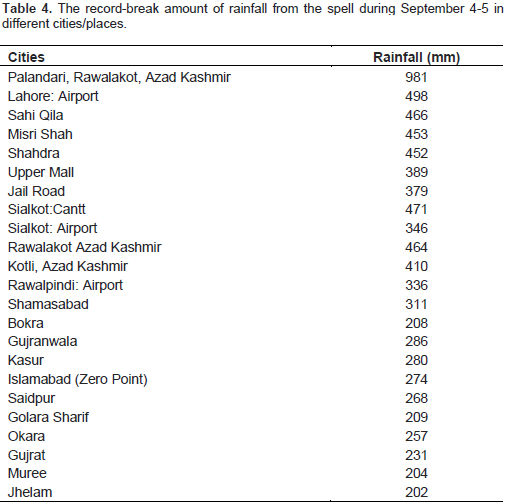
"India and Pakistan Strain as Flooding Kills Hundreds". New York Times. 8 September 2014. Retrieved 9 September 2014). The record-break amounts of rainfall from the spell during September 4 to 5 in different cities/places are stated in Table 4. Even on 8 September, Srinagar’s many surrounding parts were under about 4-m deep water. As of 10 September, more than 190 lives were lost in the Kashmir Valley. Southern Kashmir districts were mostly affected (https://en.wikipedia.org/wiki/2014_India%E2%80%93Pakistan_floods).
India’s Hegemony
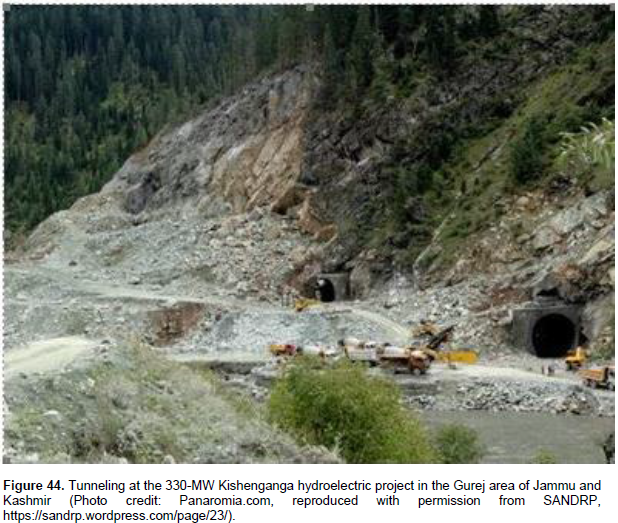
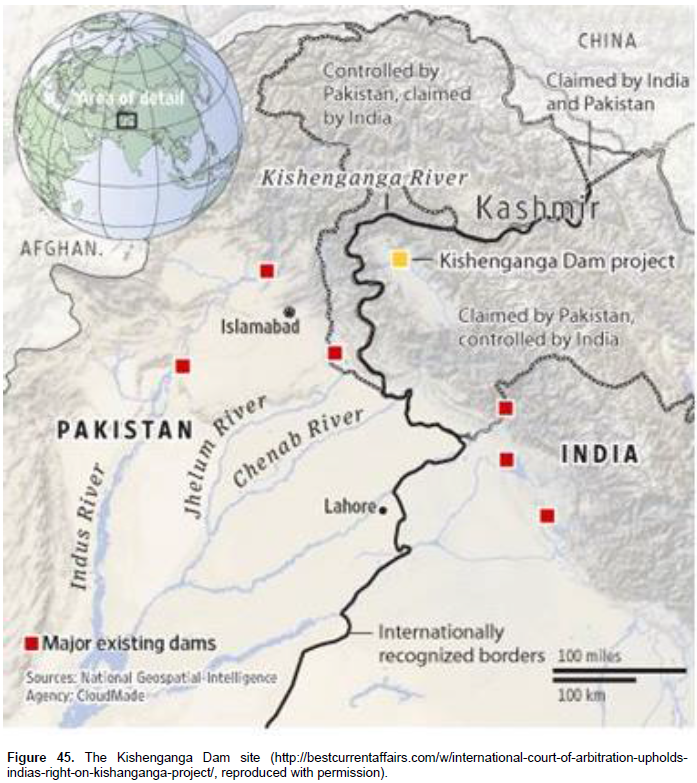
Recently, India is diverting water to build a 330-MW hydroelectric project on the Kishenganga River (Figures 34, 44 and 45), a tributary of the Jhelum River, one of the rivers that Pakistan has exclusive rights on. This river is at an elevation of 750 m, length 245 km, and an average discharge of 465 cumecs. Pakistan approached the international court protesting that India would be diverting the water that would affect its 969-MW Neelum-Jhelum hydroelectric project. She would divert the Kishenganga water through a 24-km long tunnel dug through the mountains (Figure 44) to Bandipur to meet the Wular Lake and the Jheelum River. In 2013, the court gave the verdict in favor of India.

Valuable pieces of information are availabe from case studies on upstream water piracy. Tributaries are the sources of discharge in the main river. Blocking a tributary discharge can cause very adverse effects in the main river basin. The decades-long study results of this author are mentioned in the references. These give valuable insights for the parties, the judges and others concerned in resolving disputes over international water bodies. The verdict was not certainly a wise one in respect of many interconnected potentially harmfull direct and feedback effects for the downriver ecosystem. Certainly, the judges were not aware of the causes of losing the founding and sustaining water resources for a riparian ecosystem.
Surface features change leading to new radiation balance: Temperature variation effect
Other than degrading the river, the upstream basin suffers from deforestration in the process of construction of dams and barrages on the rivers. It causes erosion which is carried downstream creating heavy siltation on river beds. The siltation favors clogging the heads of the distributaries consequent upon which inland surface water bodies are deprived of water. The aquatic world faces the risk of endangerment and extinction. Apart from those effects, landslides can occur in the upstream hilly regions.
Temperature change
The temperate effect may be understood from the radiation balance equation. On the surface of the earth, the energy balance equation is:
M∗ R = MG + MLH + MSH + ∆Ms + ∆Madv (8)
where M∗ R (W m−2) is the net radiant flux density, that is, the difference between incoming and outgoing radiation; MG (W m−2) is the soil heat flux density, a term that includes the thermal diffusivity k, the soil volumetric heat capacity CV, and the downward temperature gradient δT /δz; MLH (W m−2) is the latent heat flux density, a term that includes the latent heat of vaporization L, the air density ρ, the aerodynamic transfer coefficient for humidity CDE, the mean wind speed Ur at the reference height r, and the difference between the specific humidity of the surface qs and at the reference height qa in the air, qs − qa:
MLH = LE (Arya, 1998) (9)
MLH = αsMR/(s + γ) (Henry and Heinke, 1996) (10)
where α is a proportionality constant whose value lies between unity, for a wide range of surface features that are not under very dry conditions, and 1.26 for fully moist surfaces; s is the slope of the saturation vapour pressure versus temperature curve, and γ = 0.64 hPa K−1. MSH (W m−2) is the sensible heat flux density, a term that includes the specific heat of air at constant pressure Cp, the air density ρ, the aerodynamic transfer coefficient for temperature CDH, the mean wind speed Ur at the reference height r, and the difference between the temperature of the surface Ts and at the reference height Ta in the air, Ts − Ta (Hartmann, 1994).
∆ Ms = 1/A ∫ ∂/∂t (ρwatercT) dV (11)
where A is the area and V the control volume of the project site, ρwater is the density of water, which has the highest specific heat of all materials, c is the specific heat of water, and T is the absolute temperature of water. ∆Madv is the heat contribution from the incoming and outgoing air and water in the project site. The right-hand side of Equation 8 shows the distribution of the net radiation, which is made up of
M∗ R = (1 − ρ)M− SW + M− LW − M+ LW (12)
where the superscript plus sign means upward outgoing and the superscript minus sign means downward incoming
M∗ R = (1 − ρ)M− SW + 5.31 × 10⁻¹²T 6 air − εsσ T 4 s (13)
where ρ is the albedo, that is, the ratio of wavelength-averaged solar radiation reflected by the surface to that incident, M− SW is the major part of the daytime radiation received by the Earth and is obtained by integration of the radiance (W m−2 Sr−1) measured over a solid angle of 2π steradians; σ is the Stefan-Boltzmann constant (5.67 × 10⁻⁸ W m−2 K−4); εs (K−3 s−1 m−2) is the soil surface emissivity; Ts (K) is the surface temperature; Tair (K) is the air temperature; M− LW is the thermal sky incoming radiation or longwave irradiance (W m−2) and is an integral over azimuth, zenith angle, and wavelength:
M− LW = 5.31 × 10⁻¹²T 6 air (Swinbank, 1963) (14)
M+ LW (W m−2) is the surface longwave upwelling radiation:
M+ LW = εsσ T 4 s (15)
Taking differentials of the terms in Equation 13 to fit in the changes due to land-cover changes yields:
0 = -δρ M− SW + 3.2 × 10⁻¹¹T 5air δTair − 4εsσ T 3 s δTs (16)
The changes are referring to differences between the pre- and post-dammed average values of the quantities over a certain time interval. While applying Equation 16 for Uttarakhand, the relative weights of the terms in the equation have to be calculated in the perspective of the land use patterns for the pre- and post-dam eras (Adel, 2001). The required data are beyond the author’s reach.
Daily evapotranspiration
The calculation of daily evapotranspiration needs some physical data which are innate to Uttarakhand environment and are beyond the author’s reach. Dey et al. (2013) give daily evapotranspiration rate for a vegetative field as:
ET24 = 8.64 × 10⁷ Λins M∗ R / λρw (17)
where M∗ R is W/m2, λ=2.47×10⁶ J/kg, and ρw = 1000 kg/m3. The calculation according to FAO Penman-Monteith (http://www.fao.org/docrep/X0490E/x0490e06.htm ,1998) method is given by:
ETo = [0.408∆ (M∗ R - MG) + γ 900 u2 (es - ea) / (T + 273)]/[∆ + γ(1 + 0.34u2)] (18)
where ETo = reference evapotranspiration in mm/day, M∗ R= net radiation at the crop surface in MJ/m2.day, MG = soil heat flux density in MJ/m2.day, T = daily average temperature (°C) at 2-m height, u2= wind speed at 2-m height in m/s, es= saturation vapor pressure in kPa, ea= actual vapor pressure in kPa, ∆= slope of vapor pressure curve in kPa/°C, and γ= psychrometric constant in kPa/°C.
Relative humidity change
The variation of the humidity can be explained by the evapotranspiration taking place from distributed water sources. Rind (1995) reported finding a 30% increase in atmospheric moisture following a 4°C rise in temperature. Adel (2001) find from a decade-long study of microlevel climate change an increase of summertime relative humidity of 2.3% for a 1°C rise in temperature. Humidity is dependent on the distribution of water source which has increased in the dammed period. With distributed water resources, at least, near-saturation or saturation is reached more quickly than a few point sources. The variations in the relative humidity may be understood if we can relate them quantitatively with the variations in temperature. The relative humidity U is the ratio of the actual vapor pressure e to the saturation vapor pressure es:
U = e/es (19)
The Clausius-Clapeyron relation (Wallace and Hobbs, 1977) may be manipulated to understand the increase of U with increase in temperature. The relation is:
des/dT = L/T (av − al) (20)
where L is the latent heat of vaporization, T is temperature, av is the specific volume in the vapor phase,
and al is the specific volume in the liquid phase. The ideal gas equation for water vapor is:
eav = RvT (21)
where Rv is the gas constant for water vapor (Wallace and Hobbs, 1977). Since av >> al,
des/dT = L/T av (22)
Substituting for a in Equation 21:
des/dT = Les/RvT 2 (23)
Expressing fractional changes in saturation vapor to the fractional changes in temperature:
δes/es = (L/RvT)(δT /T) = r δT/T (24)
For r ≈ 20 at T ≈ 260 K (Hartmann, 1994), r may be approximately found at the maximum temperature in post-dammed years.
From Equation 19:
δU = (δe − δes/es)/es (25)
The fractional change in relative humidity is related to the actual vapor pressure and temperature by:
δU/U = δe/e − (r/e)(δT / T) (26)
which is obtained with a little manipulation of Equations 19 and 24. The vapor pressure e (hPaHg) can be related
to temperature by the equation:
e = exp (A) exp [−B/(C + T)] (27)
where T (K) is a temperature in the range 284-441 K, A = 18.3036, a constant, B = 3816.44, a second constant, and C = −46.13, a third constant.
From Equation 27:
δe/e = BδT /(C + T)2 (28)
Equation 26 can be written as:
δU/U = BδT / (C + T)2 – r / exp[A − B/(C + T)](δT / T)
= δT {[B / (C + T)2 ] – r / T exp[A − B/(C + T)]} (29)
This shows that the fractional change in relative humidity is related to the change in temperature. Again site- specific values of these quantities may be introduced to find the fractional changes in relative humidity.
Rainfall pattern change
The basic steps necessary for precipitation are the developments of Equation 1, a saturation condition, almost, exclusively by cooling off an updraft movement of moist air, (2) a phase change from the vapor state to liquid and/or the solid state, and (3) small water droplets to precipitation size. The cooling effect may be of cyclonic, orographic, or convective origins. Cyclonic cooling of both non-frontal and frontal types of tropical origin can cause moderate rainfall, often for a long duration and resulting in over 300 mm of rainfall. In orographic cooling, lifting of moist wind up a slope results in expansion and cooling of the air at high altitude, favoring cloud formation followed by precipitation if the dew point is reached. In convective cooling, surface heating generates vertical instability of moist air, resulting in a convection current. Precipitation in this latitude range occurs predominantly from rising air.
Surface heating can produce vertical instability of moist air, resulting in a convection current. Convective precipitation occurs for a short duration but with a high intensity. In about an hour of precipitation, about 100 mm rainfall can occur. Further, for the change of phase from vapor to liquid to occur and remain in equilibrium, the liquid must be in equilibrium with a saturated vapor with a pressure intensity. The free energy to form a droplet of radius r is given by Eagleson (1970):
∆G = −4/3π r3 ηkT ln(e/es) + 4π r2 σ (30)
where η = number of molecules per unit volume, k is Boltzmann’s constant, e/es is the saturation ratio, σ is the interfacial free energy per unit area, that is, the surface tension, e is the vapour pressure, and T is the temperature. For unsaturated vapor (e<es), there is a critical radius r∗ beyond which a droplet can decrease the free energy by growing. This free energy is obtained by differentiating the aforementioned relation:
∆G∗ = 16πσ3 /3[ηkT ln(e/es)] 2 (31)
Applying the Boltzmann’s distribution to the number n(r) of water droplets of radius r, we can write
n(r) = n(I) e−∆G/kT (when n(r) << n(I)) (32)
where n(I) is the number of unassociated water molecules in the same vapor volume. The critical nucleation rate is the rate at which a water droplet of radius r∗ can attach to another water molecule through diffusion/collision from the surrounding vapor molecules. The rate of formation of stable-sized droplets is given by:
J = Bn(I ) e−∆G∗/kT (33)
where Bn(I) ≈ 1025 cm−3 s−1 is the kinetic coefficient for spherical droplets (Fletcher, 1962).
Equations 31 and 33 together establish a relation between relative humidity and the critical nucleation rate. The relation predicts negligible nucleation rate if the saturation ratio e/es < 4. The rate increases as the saturation ratio approaches 4. In the light of the dammed scenario of the state, it can be said that the local moist air or this in conjunction with the incoming moist air from the adjoining areas has added to the humidity of the observation site that did not exist during pre-dammed years. Also, rainfall depends on the growth of water droplets to acquire fall velocities against the updrafts of convective clouds typically of about 1 m/s. The processes of coalescence and diffusion add to the radius of a large droplet in a cloud of smaller droplets. To escape updrafts, drops of average size of 20 µm have to grow about ten times bigger. Vigorously rising deeper clouds make the droplets to grow quicker (Bowen, 1950).
Likelihood of extreme events
Two large interacting systems evolve toward the macrostate of the highest possible entropy. In gas dynamics of mixture of gases, there are finite probabilities of multiple macrostates defined as a set of microstates that refers to the state of each element of a system. The multiplicities of a macrostate depend on the volume, energy, and the number of molecules assumed very large. Monatomic and diatomic molecules differ in their degrees of freedom and so in their energies. At room temperature, the thermal energy is:
Uthermal = N. f. ½ kT (34)
where N is the number of molecules, f is the degrees of freedom, k is Boltzmann’s constant, and T is the Kelvin temperature. At room temperature, air molecules have f = 5. At higher temperatures, vibrational modes contribute, and we may take fair = 7. Treating as an ideal gas, the multiplicity function of N indistinguishable molecules of mass m occupying a volume V and total energy U turns out to be:
ΩN ≈ (1/N!)( VN/h3N)(π3N/2)/(3N/2)!(√2mU)3N (35)
The multiplicity dependence on U and V is given by
Ω(UVN) = f(N))(VN)(U)3N/2 (36)
For two gases A and B each having the same N molecules, volumes VA and VB and energies UA and UB, the multiplicity of the system will be
ΩTotal = [f(N)]2VAVB)N(UAUB)3N/2 (37)
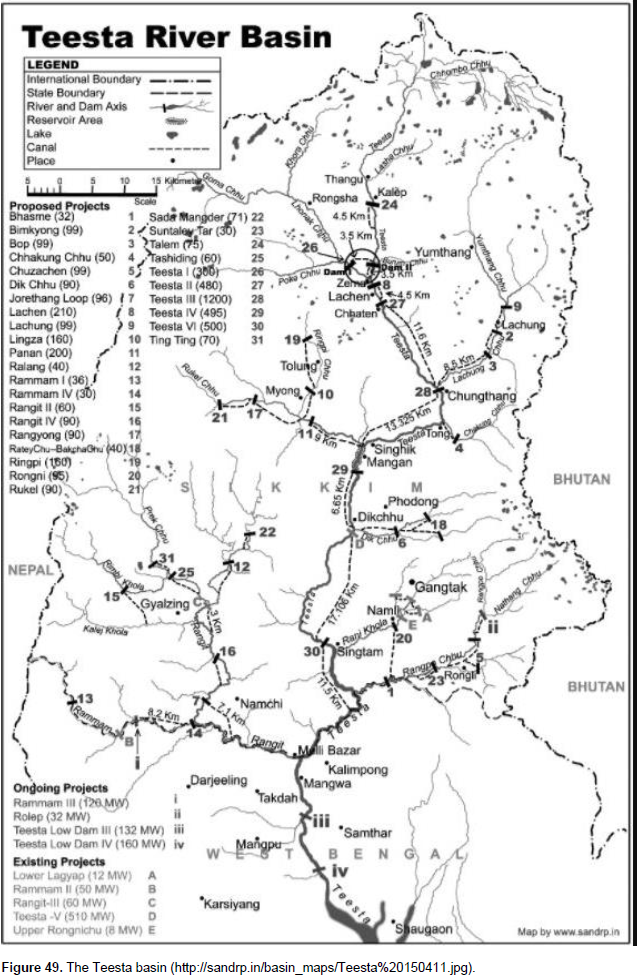
The multiplicity function as a function of UA will have a sharp peak
Width of the peak = UTotal/√(3N/2) (38)
Assuming N is very large, in the equilibrium condition of the system, only a tiny fraction of the macrostate has a reasonable probability of occurring. If any exchange of volume through expansion of one gas and contraction of the other occurs on top of exchange of energy, the multiplicity plotted as a function of VA will have a sharp peak of width. Width of the peak = Vtotal/√N (39) Figure 48 shows ΩTotal is plotted as a function of UA and VA. If there is exchange of molecule, for finding the equilibrium macrostate, the nature of ΩTotal has to be studied as a function of NA and UA. It would turn out to be a complicated analysis. In weather phenomena, the mixture of N, V, and U occurs. It is thought that some macrostate multiplicity may have satisfied the critical conditions for the production of extreme events.

Remediation
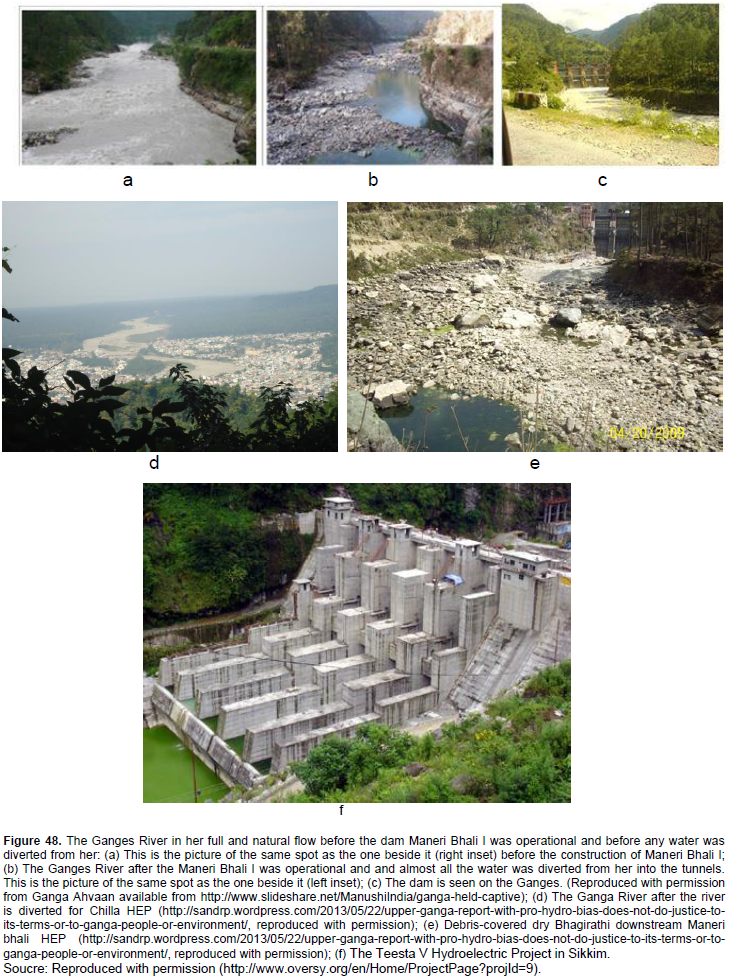
Dammed rivers become degraded. When the naturalstrength of the current is reduced, many unwanted stuffs accumulate on the water bodies. Figure 48 illustrates this scenario. Figure 48a shows the condition of the Ganges when the Maneri Valley-I was not constructed. The middle one, Figure 48b shows when the dam was operational. The right side one, Figure 48c shows the dam across the Ganges. The reporter took the pictures at the same place and at the same time. The middle, Figure 48b shows the extent of the damage (
http://www.slideshare.net/ManushiIndia/ganga-held-captive). Jhunjhunwala (2009) analyzed the costs and benefits of a typical river dam holistically. He hardly found that benefits outweigh costs. He states that the costs he shows are ignored by the supporters of hydropower.
Rivers need to be dredged regularly in its upper and lower courses. The silted river beds, if dredged, can hold several times more water than in the silted condition. Also, there has to be an infrastructure built-in place to facilitate drainage in case of heavy downpours. Cities get water-logged quickly because of poor drainage facility and poor water infiltration underground because of concrete structures. These two hindrances have to be overcome in urban areas. River dredging and river dyke construction can offset the flooding in the rural areas. NASA has plans to protect the planet from stray asteroid hits by diverting their courses of motion (http://whnt.com/2017/07/01/nasa-announces-plan-to-re-direct-asteroid-coming-near-earth/). NASA can work on such a plan to diminish rainfalls when there is the possibility of having a heavy downpour.
Jhunjhunwala (2009) suggested ROR (run of the river) dams to have the minimum impact on the rivers. Figure 48b, d, and shows the deplorable conditions of rivers having ROR dams. Although it is said that ROR does not require a reservoir or a little reservoir, in practice it is different. In the Himalayan Region, the large ROR dams fragment the river forcing water through tunnels to hydel plants before reuniting them into the river. Riverways between the dams and the power plant that are bypassed are quite long, and up to 90% of the wintertime river discharges are forced to follow the bypass paths. In the 510-MW Teesta V project in Sikkim (Figure 48f), the” head race tunnel” is 18.5 km long and the river bypassesa stretch of 23 km. Contrary to ROR-advocates’ arguments, the daily fluctuation in river discharges risks the riverine ecology. Also, a series of dams in river virtually makes the river flow through tunnels. Further, the wider the surface of a watercourse the more the evaporation, aiding to climate change (Adel et al., 2014). From the basin discharge expression (Asumadu-Sarkodie et al., 2015b).
Qp= 0.278× Cs×C×i×A (40)
with Qp= run-off rate (m3 /s), C=run-off co-efficient (0.7 - 0.95 for urban areas), Cs= storage coefficient, i= rainfall intensity (mm/h) and A= area of drainage (km2), and the observation of the dilapidated conditions of dammed channels after the rainfall in the basin, it is obvious that all of Cs, C, i, and A are drastically changed impacting Qp. In this hilly river-origins and river-abundant state with sloping river valleys, it is the anthropogenic activities of dams and barrage constructions that is the prime artificial fator of flooding, given that the causes of rainfalls are beyond human control although their creation of reserviors in the basin favors rainfalls.
Facts and figures: India’s water encroachment in the Teesta Basin
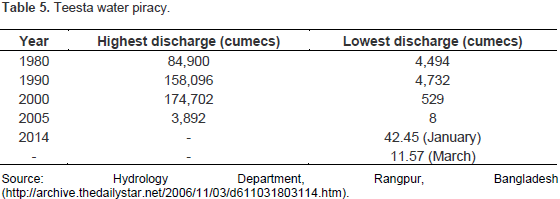
The Teesta Basin is illustrated in Figure 49. The Teesta water piracy is shown in Table 5.
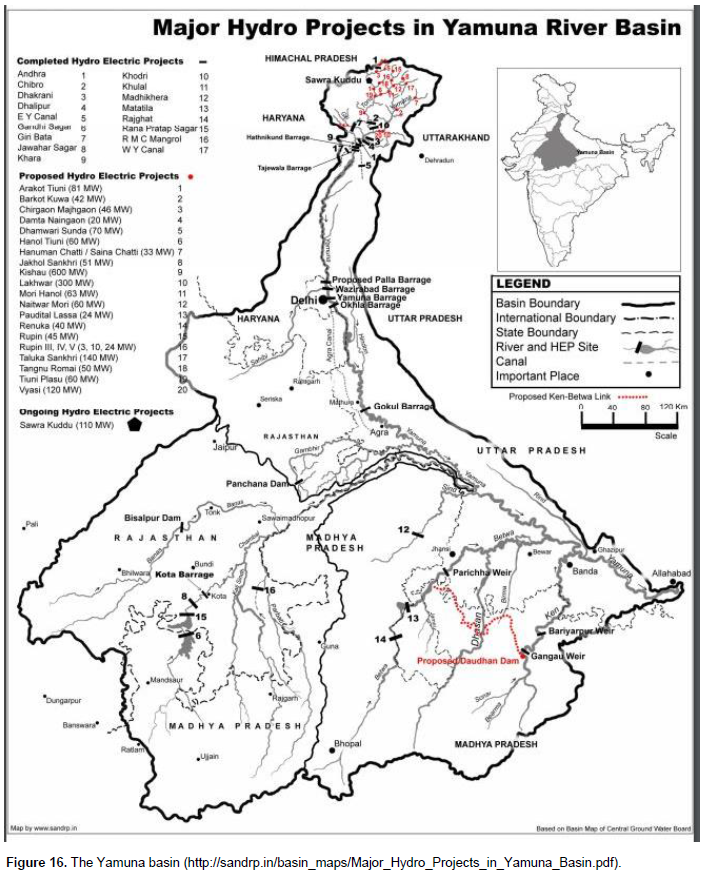
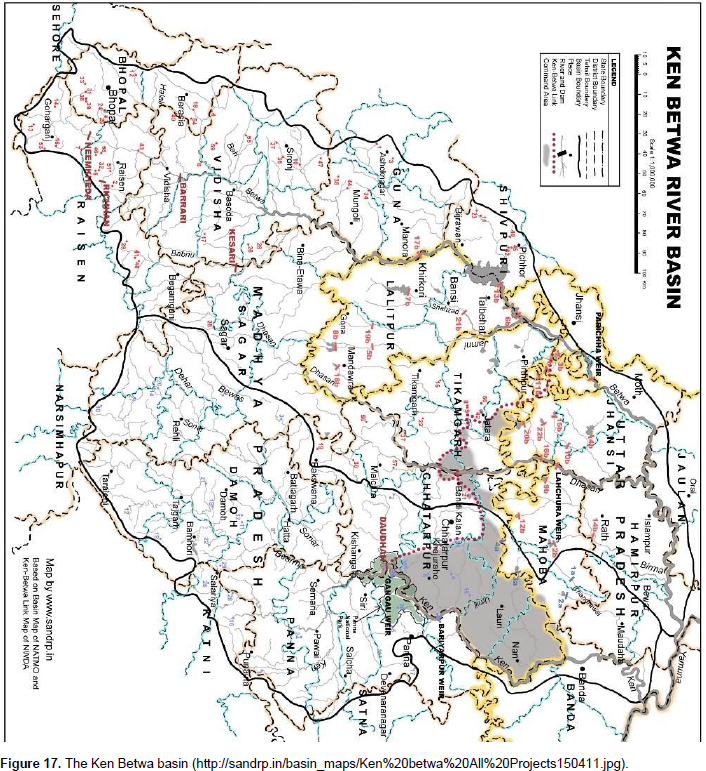
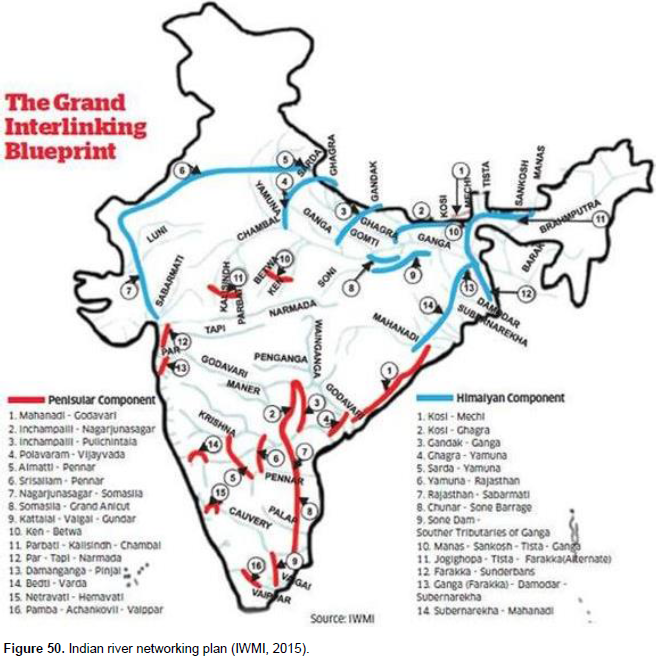
Facts and figures: River networking
India has taken a grand plan to interconnect her rivers (Figure 50). The project has three components: the Himalayan component in the north, the Peninsular component in the south, and an intrastate component (Adel, 2013). Contrary to Indian government’s preaching, India plans to keep all the river waters within herself. She already changed the course of the world’s 8th largest river the Ganges that flowed through neighboring Bangladesh under the pretext of a so-called Ganges Treaty that Bangladesh government was forced to sign following a marathon number of meetings between the two parties and intermittent deprival of water to Bangladesh. The current Indian Government threatened Pakistan not to have Indian water flow in that neighboring country (Dawn.com, 2016), a sheer breach of the Indus Water Treaty brokered by the World Bank. In the light of the aforementioned discussion, it is expected that there will be more climatic changes and severe climate-related effects in India.

Potential threats
Confining all water within the Indian land can trigger macrostate multiplicities. It is not known out of the numerous states that would be generated, which one can have disastrous effects and how often that can happen. Indian government should think twice following the two disasters and the 2017 flood to arrest all waters within India and not let any water flow to the arch enemy Pakistan and the bosom friend Bangladesh camouflaged with sweet words.


