Full Length Research Paper

ABSTRACT
Declining quantity and quality of irrigation water coupled with increasing water demand are serious challenges facing paddy rice production in the world. Reuse of agricultural waste water is increasingly popular in paddy systems but few studies have been done with regards to its quality and effects on soil productivity and environmental risks. The aim of this study was to assess the suitability of effluents from the Mwea Irrigation scheme in Kenya for recycling within the scheme and for reuse in new areas downstream. Water was sampled from River Thiba intake (point 1, control) and waste water from farmers plots, Kiruara drain (point 2) and Thiba main drain (point 3). Corresponding adjacent soils were sampled and analyzed for important physico-chemical quality parameters. Results showed that the EC, TDS, TSS, Ca2+, Mg2+, K+, Na+, HCO3-, NO3- and SO42- significantly (p<0.05) increased in wastewater as point 1< point 2< point 3. Whereas, 88.3% of Mwea rice farmers experienced water shortage during peak demand, 51.5% of them recycled wastewater from paddy fields. The soil total N and available P from the wastewater reuse sites increased by 48.4 and 400% respectively to amounts that could save fertilizer P application once every 3 seasons. The wastewater NO3- concentrations increased above 8 mg/L likely to cause damage to N sensitive plants and eutrophication in the receiving water masses. The fresh water and wastewater in the Mwea scheme were suitable for irrigated rice production since all the nutrient parameters were within critical limits as recommended by FAO standards.
Key words: Irrigation, recycling, rice production, wastewater, effluent, physico-chemical, Water quality, precision agriculture.
INTRODUCTION
Rice is one of the most important staple foods in the world ranking third after wheat and maize in terms of production and consumption (Akinbile et al., 2011). However, Kenya faces a huge production deficit relative to demand, a gap that is filled through imports. Current rice production, estimated at 180,000 tons only meets about 20% of total demand which is estimated at 949,000 tonnes (IRRI, 2018), against the production target of 1.29 million tons by 2030 (National Rice Development Strategy-2, 2019-2030). Increasing rice production and productivity is critical and must address the immediate challenges of poor yields through increased use of hybrid rice, availability and quality of irrigation water, inefficient land and water use management, and low technology outlay (Atera et al., 2018).
Water scarcity is a major threat to irrigation development and the achievement of sustainable development goals, particularly in sub Saharan Africa. However, about 75% of total world rice output is produced under irrigation and this puts pressure on available freshwater resources (FAO, 2017). The major causes of global water scarcity include climate change; rapid population and economic growth; increased demands for irrigation water; increased demands for urban water; trans-boundary conflicts; and competitions between sectors such as agriculture, industry and energy and, matters relating to environmental protection (Bigas (Ed.), (2012) and Rogers (2004)). In 2012, UNEP identified Kenya to be among the countries likely to run short of water in the next 25 years (UNEP, 2012). Rice cultivation is one of the main crops feeding the global population and requires plenty of water for its effective growth.
According to Kuria (2004), the worst problem facing Mwea rice farmers was competition for and unavailability of irrigation water cited by 72.1% of farmer respondents. Nevertheless, wastewater has been extensively used in agriculture in many parts of the world to bridge the shortfall of freshwater for irrigation. Several such sources including surface and subsurface agriculture drainage water, storm runoff, sewage effluent and industrial wastewater recycling have been widely studied and used (Hettiarachchi and Ardakanian, 2016).
Wastewater arising from irrigation schemes vary in quality from effluent derived from domestic sources or industrial wastewater arising from urban areas. Whereas much work has been done on the latter around the world, very little research has been conducted on agricultural wastewater reuse particularly in water-scarce developing countries like Kenya. Work by Zulu et al. (1996) observed that agricultural water reuse supplemented the paddy water supply, and supplied up to 15% of the total irrigation water supply. Apart from meeting the water needs at peak demand periods, water reuse is a quick-response water supply solution during dry spells, increasing both the water reliability and crop security. However, research on the quality of wastewater and suitability for reuse on the paddy systems, rice land ecosystem and crop performance are conflicting and site specific, affected by the level of management and inputs applied and therefore inconclusive. For example, while Dong and Watanabe (2017), Ortega et al. (2001), Yoon et al. (2001), Hussain et al. (2002), Thu (2001) and Singh and Agrawal (2012) found that wastewater irrigation mainly increased rice yield by 10-50% with less amount of fertilizers due to nutrients, and improved soil structure by organic matters in wastewater, WHO (2006) and Nyomora (2015) did not observe such soil and yield increases and in contrast, found that wastewater irrigation applied with N?P?K fertilizer depressed the yield potential to 3.2 times of that obtained without its application and that high salt contents in wastewater was a potential hazard and eroded the soil structure resulting in less productivity. Furthermore, under wastewater irrigation, proper agronomic and water management practices were required to improve crop yields, safeguard the environment against pollution and increase value of fertilizer saved (Singh and Agrawal, 2012), and to reduce potential of contamination with microbes, heavy metals and organic toxic compounds in wastewater (Dong and Wanatabe, 2017).
The Mwea irrigation scheme is the largest in Kenya producing approximately 80% of paddy rice, on 26000 acres under irrigation and with a potential to increase this scheme by a further 10,000 acres. However, this is constrained by lack of sufficient water (NIA, 2020; Kuria 2004) where approximately 88.3% of the farmers experience water shortages during rice cultivation (Onderi, 2016). In spite of strong research evidence that agricultural effluent irrigation can make a significant contribution in reducing water demand, especially during peak demand periods, improving soil condition and crop yields, and reducing the amount of pollutant discharged into our waterways to protect the environment and public health, the quality of effluent from Mwea irrigation scheme is not known despite a majority of the smallholder farmers already using it. Hence there is need to assess its suitability for irrigation. The authors hypothesized that physico-chemical parameters of irrigation water change with intensity of water reuse affecting its quality, and that reuse of the Mwea irrigation scheme effluent affects soil quality and potential for sustainable rice farming. Therefore, our objective was to assess farmers’ awareness on the effects of the quality of irrigation water on rice production, to determine the physico-chemical properties of Mwea irrigation scheme’s water at source (River Thiba) and its irrigation effluents (Kiruara Drain and Thiba Main Drain), to investigate the effect of wastewater reuse on the quality of Mwea soils and rice yields and to assess suitability of the Mwea irrigation scheme effluents for reuse in irrigation in relation to FAO recommendations.
MATERIALS AND METHODS
Study area
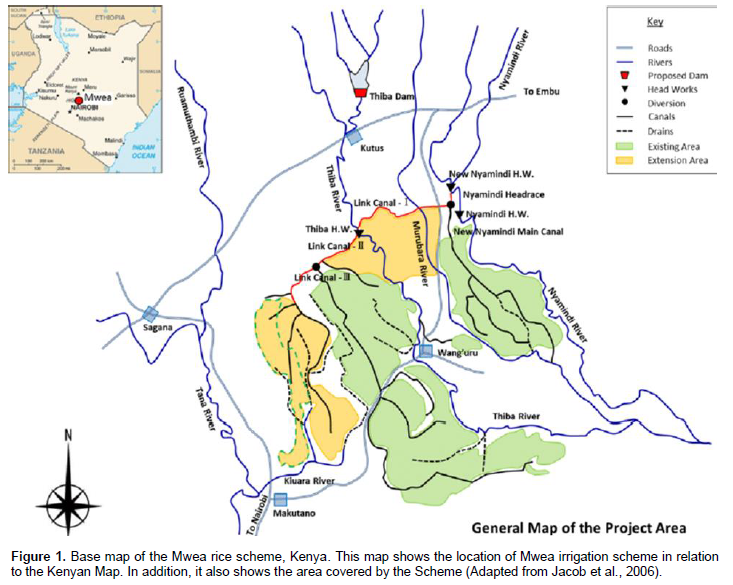
This study was carried out in the Mwea Irrigation Scheme, Kirinyaga County, Kenya (Figure 1). The scheme was started in 1956 and has a total potential area of 30,350 acres, of which 26,000 acres have been developed for paddy rice, producing 86% of the total rice grown in Kenya (Muhunyu, 2012). Besides the nucleus region of the scheme, another 5,000 acres of rice are under cultivation in the out-grower region of the scheme bringing the total acreage under rice to 21000 acres.
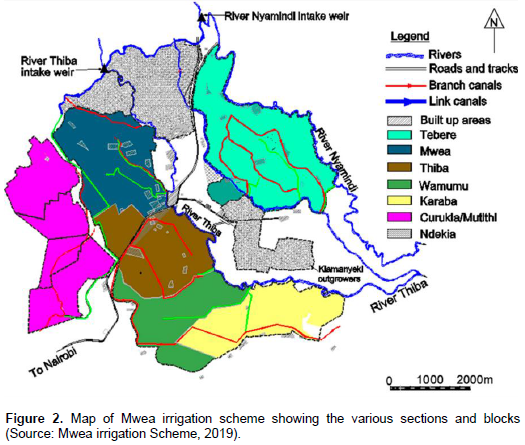
The nuclear scheme is divided into 5 sections, namely Tebere (T), Mwea (M), Thiba (H), Wamumu (W) and Karaba (K) while the out grower region include areas of Kianugu, Ndekia, Curukia and Kiamanyeki (Figure 2). The sections are further divided into 70 blocks also known as water management units (WMU) to ease management.
The scheme is served by two main rivers viz: - River Thiba and River Nyamindi which irrigate 80% and 20% of the scheme, respectively (Wendot, 2019 pers com). Irrigation water is drawn from the rivers with the help of fixed-intake weirs by gravity and then conveyed and distributed via open unlined channels irrigating various blocks in turns depending on the irrigation schedules and quantities of water available.
Research design
The study employed the comparison of exposed and control site research approach. The control site was taken at the main inlet point of river Thiba (referred to here as point 1), the upper reach of the river which supplies the scheme with fresh irrigation. In contrast, exposed sites were taken in the lower two re-use points namely; Kiruara Drain and at Thiba Main Drain (referred to as points 2 and 3). This experimental approach involved fresh input water (at point 1), wastewater and soil sampling from the three different sites in the scheme followed by laboratory analysis. Non-experimental (Survey) design was also used to determine the existing farm-hold conditions at Mwea irrigation scheme and structured questionnaires administered to collect important information about the farmer population. Transverse walk and field visits were also undertaken to make any necessary observations such as whether farmers were actually re-using wastewater from paddy fields to accomplish the study.
Water sampling and analyses
Nine water and wastewater samples were collected, three from each of the 3 sites, that is, at the main inlet point of river Thiba (fresh river water, control point 1 treatment), and at two irrigation drainage re-use points namely; Kiruara Drain (treatment, point 2) and at Thiba Main Drain- (treatment, point 3). River Thiba main inlet (point 1) served as the control point since irrigation water was sourced from the river, assumed to be clean and free from contamination while Kiruara Drain and Thiba Main Drain were the first and second re-use points bearing effluents /wastewater from the rice fields.
Sampling was carried out according to APHA et al. (2005)’s recommendations, that is, filtering and use of sterilized bottles which were obtained from the laboratory. Sampling was done once every month, at planting, during the rice vegetative stage (34 days after transplanting) and at the reproductive stage (75 days after transplanting, 2018). Before sampling, the bottles and containers were rinsed thrice with water from the sampling site. .Then three samples of equal volumes were taken from the two edges and at the middle of the canal and mixed to produce a composite sample from which a 500mls representative sample was drawn into labeled containers for subsequent analysis. Immediately after sampling, pH was determined using a portable pH meter; EC and TDS was measured by a portable waterproof multi-range conductivity/TDS meter (Model No: H1-9635) manufactured by Precision Scientific Instruments Corporation, India Mart. The samples were then carried in a cooler box which kept them as cool as possible without freezing to minimize the potential for volatilization or bio-degradation (Jayalakshmi et al., 2011), and immediately taken to the Government chemist laboratory in Nairobi within 3 hours. In the lab, the samples were acidified with nitric acid to a pH below 2.0 to minimize precipitation and adsorption of certain cations to container walls. Whenever immediate analysis was not possible, the samples were stored at 4oC according to Jayalakshmi et al. (2011). Each sample was analyzed in triplicate giving each parameter 27 sets of results whose mean and standard errors were determined at 95% confidence limit.
The water and wastewater parameters measured for overall water quality assessment included:- pH, Electrolytic conductivity (EC), Total Dissolved Solids (TDS), Total Suspended Solids (TSS), Calcium, Magnesium, Sodium, Potassium, Bicarbonates, sulphates and Nitrates. These parameters were determined using standard procedures as described by ALPHA (1998). The results were used to compute sodium adsorption ration (SAR) and further compared with FAO irrigation water quality standards.
SAR was calculated using the formula, Equation 1 below:

Source: Ayers and Westcott (1985)
Where: SAR – is the sodium adsorption ratio, a measure of the amount of sodium (Na) relative to calcium (Ca) and magnesium (Mg) in the water extract from saturated soil paste.
Soil sampling and pre-treatment
Soil samples were drawn from 3 sites adjacent and corresponding to the water sampling points described above. The soil sampling sites were: at the Mwea irrigation agricultural development (MIAD) farm (point 1) which receives water directly from river Thiba intake and is the first field to be irrigated; point 2 was at Curukia block - the first farm which receives its irrigation water from Kiruara Drain, and site 3 was at Mwea GK Prison farm which basically utilizes water which has passed through several fields before exiting back to river Thiba. Soil samples were taken at the end of the rice growing season for analysis of soil pH, Electrical conductivity, and total organic carbon, Total Nitrogen, Phosphorous, Calcium, Sodium and Magnesium.
From each of the 3 sites, 8 samples were obtained from 0-20 cm depth (as recommended by Carter and Gregorich (2006) for annual vegetation) by the zigzag method using a soil auger to ensure homogeneity. These were then thoroughly mixed and a composite sample of 1kg obtained, labeled, recorded in the field note book and immediately delivered to the MIAD laboratory in Mwea within 1 h for analysis. In the lab, soil samples were air-dried to minimize changes in soil physical and chemical properties, ground and sieved through a 2.0 mm sieve and stored in sample bags for subsequent analysis as outlined by Okalebo et al. (2002).
Soil analysis
The soil pH (1:2.5, soil:H2O) was measured potentiometrically in the supernatant suspension using a pH meter (Carter and Gregorich, 2006). Electrical conductivity (EC) of the soil was determined by using an electro-conductivity meter. Organic carbon was determined by Walkley - Black method (Schumacher, 2002) and calculated using the formula, equation 2 below.

Where: B=volume (ml) of ferrous sulphate used for the blank titration; T=volume of ferrous sulphate used for the titration of soil sample.
Actual organic carbon (%) = organic carbon estimated × 1.3
Organic matter (%) =Actual carbon % ×1.724. (1.724 is called the Van Bemmeler factor which is used because organic matter contains 58% carbon). Total nitrogen was determined by the Kjeldahl method (Carter and Gregorich, 2006). The digest solution was used for the potassium, sodium, calcium, magnesium and phosphorous determination using atomic absorption spectrophotometer (AAS) machine.
Statistical analysis
The physico-chemical laboratory results were analyzed using SAS software programme version 9.1 whereby the mean concentrations of the parameters were tested for significant variations (P<0.05) by a two-way analysis of variance (ANOVA) and further separated using Tukey’s test. The means from point 2 and point 3 were then compared with FAO irrigation water quality standards.
Household survey
A structured questionnaire was developed, pre-tested by staff from KALRO Mwea and MOA Mwea East Sub-county and administered to 163 farmers. The interviews were conducted with the help of eight officers from MIS water users association.
Sample size
The sample size was estimated using the equation used by Valedes and Bamberger (1994) as:
d=n-1/2(c2pq)1/2 (3)
Where: d is the precision of an estimate for a particular confidence interval with high values indicating low precision and low values indicating high precision. c is the Z-score for the selected level of confidence (in this case 95%). n is the sample size. p is the probability at which the event being measured is likely to occur and
q is the probability that the event will not occur (q=1-p). Note: Though the desired precision of the estimate is half the width of the desired confidence interval (Webster, 1995) a higher value in this case was adopted because the scheme irrigators have a strong homogeneity in terms of farm and canal design characteristics; water distribution schedules; crop type; production programme and agronomic practices a case which exhibits strong internal similarity (Owilla, 2010: Webster, 1995).
The scheme has 4189 registered farmers. Using a confidence level of 95% (x=0.05), which corresponds to Z score of 1.96 and setting the d value at 0.786 and p at 0.5 (results in the highest precision) the sample size was found by substituting the values of d, c, p and q into the equation:-
0.786=n-1/2(1.96)2(0.5) (0.5)1/2 = 163 (4)
Where n is the sample size.
Sampling frame
The scheme manager provided a list of all farmers in the scheme which comprises seven (7) sections and seventy (70) blocks. Then, systematic random sampling method was used whereby the sections were randomly numbered from one to seven. The first member listed in each block in each odd numbered section was interviewed and thereafter the 31st, 61st, 91st etc. members. Then the second member listed in each block in each even numbered section was interviewed as was the 32nd, 62nd, 92nd etc. members. The farmers’ responses were categorized and tabulated. The overall sample size of 163 was apportioned to the sections of the scheme using nth value = 30 criteria as shown in Table 1. Data on rice production and irrigation water used for 2015/2016 season were collected from both original scheme tenants and farmers in the out-grower sections of the scheme.

RESULTS AND DISCUSSION
Mwea farmers’ practices
Smallholder rice farmers’ household survey found out that 88.3% of the Mwea Irrigation Scheme farmers experience water shortages during rice growing period (2016 to 17) thus indicating a slight increase from 85% reported by Muhunyu (2012).The study also found that the scheme had developed an irrigation water rationing schedule whereby only 59.5% of the smallholder farmers received irrigation water and only once per week. The rationing was due to water shortages during peak periods of rice irrigation. Despite advocating for the System of Rice Intensification (SRI) by the scheme management that could drastically reduce the quantity of irrigation water (Ndiiri et al., 2012) used by farmers, it was found that most farmers in the scheme used the conventional way of flooding paddy fields which uses a lot of water for rice growing. This is in agreement with previous findings that rice is the largest consumer of water in the agricultural sector (Ndiiri et al., 2012; Thakur et al., 2011). As a result, farmers predominantly use substitute water sources such as drainage canals, small rivers and ponds, in agreement with Rice MAPP (2016).
This study further found that 51.5% of the farmers in the Mwea Irrigation Scheme used wastewater from the paddy fields normally derived from overflows from neighbors’ fields. This source is recycled via irrigation canals or through direct pumping from drainage canals. About 50.6% of the farmers who did not use the wastewater said it was not available due to the position and distance of their farms from the drainage canals. Since 68.7% of the farmers have grown paddy rice for over 10 years, it is evident that they recognize the positive role of wastewater reuse in rice production. The 48% of those who did not use wastewater had a negative feeling about it and this is supported by Githuku (2009) and USEPA (2012), who observed that “waste water re-use has not been fully accepted”.
All farmers in the study area use different types of inorganic fertilizers to grow rice (Figure 3). For planting 52.1% used Diammonium phosphate (DAP), 2.5% used Muriate of potash (MOP) and 31.9% used Triple superphosphate (TSP) as shown in Figure 3. However, 85.3% of the farmers applied Sulphate of Ammonia (SA) during topdressing which has potential of acidifying soils and which causes heavy calcium ion losses in the form of calcium nitrate and calcium sulphate in irrigation effluent (Afullo, 2009). This study found significantly higher usage of pesticides (herbicides 87.1%; and insecticides and fungicides at 98.8%) comparable to previous studies by Muhunyu, (2012). This has a likelihood of negatively changing the composition of water leading to increased contamination on the environment, mainly water, river and underground water masses and soils. Muhunyu (2012) further observed that the use of herbicides is not encouraged by the Public Health officers because the contaminated water drains back to the canals and rivers and is used downstream thus posing an environmental and human health hazard in Mwea area. Therefore, there is need to use available alternatives to chemical pest control such as varietal resistance and integrated pest management (IPM) technologies in Mwea, Kenya.

The average paddy rice yield reported by farmers (Figure 4) was highest in the Karaba (K) section at 5.62 ton/ha (27.9 bags/acre; 1 standard bag equivalent to 80kg), followed by Wamumu farmers (W) at 5.46 tonnes (equivalent to 27.1 bags); Thiba (H) at 5.28 tonnes (or 26.2 bags/ acre); Curokia at 5.18 tonnes (or 25.7 bags); Mwea (M) at 5.06 (or 25.1bags); Tebere (T) at 4.90 tonnes (or 24.3 bags) and was least in Kiamanyeki at 3.19 tonnes (or 15.8 bags) of paddy rice.
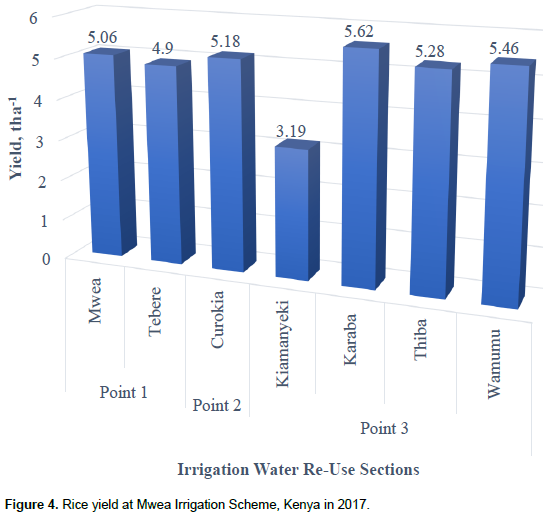
The highest rice yield was 5.62 ton/ha obtained at the second wastewater re-use point 3 at Karaba section (Figure 4). This was followed by Wamumu (5.46 ton/ha) and Thiba (5.28ton/ha) sections while the least rice yield was 3.19 ton/ha obtained from Kiamanyeki in the same block using second wastewater at point 3. The second highest rice yield (5.18 ton/ha) was obtained from Curokia section (point 2 block) which was irrigated with first waste water drained from point 1 block sections of Mwea. Except for Kiamenyeki, the lowest yields were obtained from point 1 block which include Mwea (5.06 ton/ha) and Tebere (4.90 ton/ha). The highest yields obtained from point 3 sections (except for Kiamanyeki) could be explained by its location, which is at the tail end of the scheme thus utilizing irrigation water mixed with second stage wastewater, richer in nutrients drained from paddy fields irrigated with first drainage waste water. The pattern of yields increase followed the order point 3 > point 2 > point 1, corresponding to nutrients concentration increases in wastewater (Table 2) and soils (Table 4) thus suggesting that increasing concentrations of Ca, N, K and Mg nutrients in drainage wastewater (Table 2) and from associated higher soil N, P, Ca and Mg contents (Table 4) improved rice nutrition and observed high grain yields. Despite having inadequate and unreliable water supply, farmers at the Curokia out-grower section reported higher rice yields compared with those from the Mwea section, confirming that water mixed with first drainage effluents contained higher nutrient cations than fresh irrigation water directly from river Thiba inlet. Least rice yields obtained at the Kiamanyeki section can be explained by inadequate water received in this section due to its far-off position in relation to the main irrigation infrastructure. These results compare well with the optimum yield of aromatic rice varieties of 5.5 ton/ha (27.8 bags of 80kgs/acre) as given by Muhunyu (2012) for the Karaba section.
The physico-chemical parameters
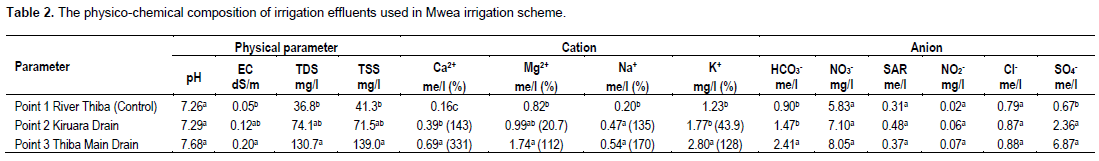
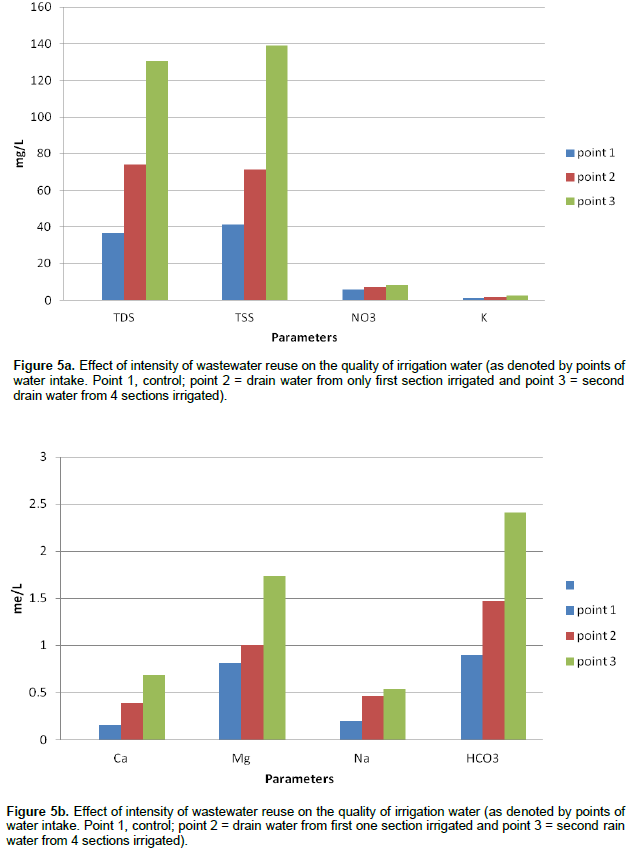
The results of the present study show that irrigation water pH, EC and TDS values increased from point 1 control < point 2 < point 3 (Table 2), indicating higher concentration in wastewater compared to fresh river water which served as the control. Water pH was alkaline but increase was not significant (p=0.05) indicating that the N fertilizers in residual water draining from point 2 and 3 did not alter the water pH. Values in columns followed by the same lower case letters are not significantly different (p=0.05). Point 1 represents the first drain wastewater. Point 2 was the second drain wastewater and the parenthesis show percent of the control.
The study findings indicate that salinity increased down the irrigation canals. Though these values fall within FAOrecommended standards (Table 3), irrigation water should contain a minimum EC of at least 0.2dS/m or its TDS exceeding 200mg/L to prevent surface dispersion. This means that River Thiba (point 1) and Kiruara drain (point 2) waters are corrosive and tend to deplete the surface soils of their soluble salts and exchangeable cations (Onderi, 2016) and Ca is amenable to this washing (Afullo, 2009) making the effluent at Thiba Main Drain (point 3) better for use compared to River Thiba waters. This study revealed that TDS correlates positively with EC as found out by Jayalakshmi et al. (2011). Also noted was a progressive increase in the values of TSS from point 1 (41.3 mg/L) to 3 (139 mg/L) and this depended on the high number of paddy fields irrigation water sweeps through before it is discharged back to the river.
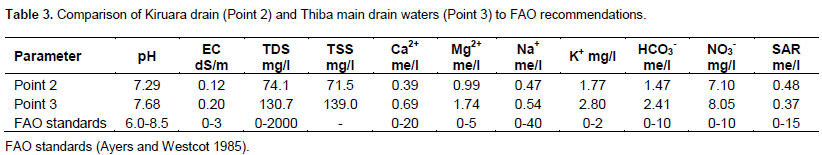
Similarly, cations and the anions concentrations followed the same trend and increased in the order of point 1 (fresh water, control) < point 2 < point 3 (Table 2). compared with the control, Ca2+, Mg2+,Na+ and K+ increased by 143%, 20.7%, 135%, and 43.9% respectively in the first drainage wastewater and by 331, 112%, 170 and 128% respectively in second drainage wastewater. Increase in TDS and EC was associated with increasing alkalinity (high PH) of the irrigation water as well as Calcium concentrations in water. Higher cations and anions in wastewater could be explained by continued heavy applications of inorganic fertilizers, DAP, SA and MOP for rice production. Observations during field visits revealed that farmers used manure on their rice fields increasing soil organic matter content which is the key modifier and buffer of soil quality. In addition, continuous topdressing with sulphate of ammonia (SA) fertilizer has been shown to increase Ca losses in form of calcium nitrate and calcium sulphate in drainage water (Afullo, 2009). Moreover, in contrast, the use of organic manure observed during field visits might have buffered Ca from being lost. This finding is supported by Fenton and Conyers’ (2002) who reported that very low organic matter causes calcium deficiency. Also the high pH values in the water and wastewater may have favoured calcium availability. Likewise, Analysis of variance (p=0.0947 between points 1 and 2, p=0.0278 between points 1 and 3 and, p=0.0402 between points 2 and 3) indicated gradual significant increments in magnesium from point 1 (0.82 me/L) through point 3 (1.74 me/L) again re-affirming that the agro inputs used by Mwea Irrigation Scheme farmers did contribute to the substantial changes in magnesium levels. Although analysis of variance show significant differences (p=0.0096) in Na levels between River Thiba intake (point 1) and Kiruara drain (point 2), with no difference between Kiruara drain (point 2) and Thiba main drain (point 3), the overall low sodium concentrations of below 3me/L in the drainage irrigation water sources indicated that none of the sources pose toxicity to sodium sensitive crops (Ayers and Westcot, 1994). Unlike the other cations, K+ concentration in drainage wastewater at point 3 was higher than FAO recommended standard values for irrigation water (Table 3) thus indicating that the irrigation water is being enriched as it mixes with wastewater down the irrigation drains. This concur with previous work reported by James et al. (1982) that water direct from mountain sources is too low in K but irrigation water that comes by way of return flow adds considerable K to offset removal (Figure 5a and b).
The values of NO3 in irrigation water showed a progressive increase from the intake at point 1 to point 2 and point 3:- as 5.83 mg/L < 7.10 mg/L < 8.05 mg/L for point 3 respectively. These values are within FAO recommendations and statistical analysis did not show any significant difference between the three points (as p>0.05). Nevertheless, the NO3 levels exiting from the scheme through Kiruara Drain, point 2 and Thiba Main Drain, point 3 need to be disposed off well for purposes of conserving the environment and avoidance of undesirable miscellaneous problems such as excessive vegetation at the expense of produce and, one of the best ways is through recycling.
Bicarbonate values for point 3 (2.41 me/L) was significantly higher compared with the control (0.90 me/L, point 1) and point 2 (1.47 me/L; p=0.0045). Point 1 and point 2 values (p=0.2128) were not statistically different. Observed bicarbonate differences could be explained by the intensity of wastewater reuse whereby irrigation water swept through many paddy fields (farms in approx. four sections) between point 1 and point 3 compared to only a few rice fields between point 1 and point 2. These values are within FAO recommended standards (Table 3) but from previous studies, a high bicarbonate water (>2me/L) as in point 3 (2.41me/L) in the water used for flooding and growing paddy rice is reported to cause severe zinc deficiency (Mikkelson, 1983). Also high presence of bicarbonates will precipitate Ca when the soil is dry leading to an increase in Na relative to Ca causing development of thin surface crusts which impedes water infiltration and accelerates runoff. The effluent parameters were compared with FAO recommended standards as shown on Table 3.
This research found out that the quality of effluents from Mwea Irrigation Scheme fall within the FAO recommendations for irrigation water save for potassium at point 3 thus suitable for reuse in paddy rice production. Though Nitrates fall within the FAO recommendations of 0-10mg/L, Pierzynski et al. (1994), reported that the threshold for eutrophication in freshwater environments is 0.5-1.0 mg N L-1. Therefore wastewater from Mwea Irrigation Scheme has a potential of contaminating receiving masses downstream and recycling of these wastewater will solve the problem.
Soil quality changes as affected by wastewater irrigation
Results obtained from soil analysis at varying intensity of wastewater reuse indicate contrasting recharge and depletion effects on micronutrient and major macronutrient cations on the smallholder farms (Table 4). Whereas soil N and available P significantly accumulated in soil upon reuse of wastewater, in contrast, potassium and zinc particularly depleted in soils to a deficiency range, with increasing intensity of cultivation.
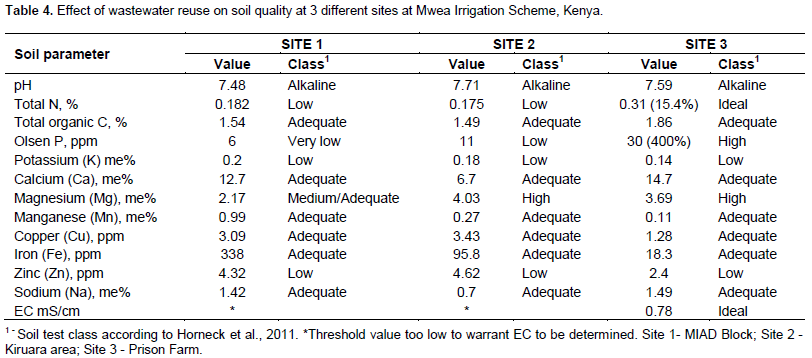
The results further show that although all major cations accumulated, all the micronutrients tested declined in soils (Table 4). Nevertheless, these results have serious implications on rice nutrition because except for potassium and zinc, all the chemical parameters tested were in adequate range for rice nutrition at site 3 soil, which was cultivated using second recycled drainage water.
The soil pH remained fairly alkaline from 7.48 to 7.59 and did not decrease as expected owing to continuous application of ammonium fertilizers in soil. This was probably due to high Ca concentration in wastewater used for irrigation, coupled with the frequent use of organic manure observed during field visits that might have buffered soil pH.
Soil total N increased from 0.182 to 0.31% at point 3, the latter being sufficient for adequate N availability in soil. Likewise, available P in soil progressively and significantly increased from 6 ppm at the control point 1 soil to 11 ppm at point 2 and finally to 30 ppm P at point 3, an increase of 400% compared with the control.
Therefore the soil N and P increased from a deficiency to sufficiency range in soils after irrigation with second category wastewater suggesting nutrient deposition and potential for fertilizer savings and economic benefits for the smallholder farmers because fertilizer inputs are expensive. Further, the increased nutrient concentrations in soil may explain the observed higher rice yields obtained by farmers in block 3 fields. With P values of 30ppm, rice farmers can do a season without application of P fertilizers hence a saving on production costs. On average, farmers apply 80kg of basal fertilizer @ Ksh. 64 per kg retail price for DAP/ TSP meaning a saving of about Ksh. 5000/- per acre can be achieved in that one season. This study results correspond with the findings of Singh and Agrawal (2012), who reported that organic carbon, total nitrogen, available phosphorous, electrical conductivity, nitrate nitrogen and ammonium nitrogen were higher in wastewater irrigated soils compared to soils irrigated using clean water.
The finding of depletion of soil K at point 3 (from 0.2 to 0.14 me%) was surprising due to farmers’ regular application of muriate of potash (KCl) fertilizers for rice production. However, this observation of a negative K balance could be reinforced by a positive N and P balance found in this study and supported by the work of Magen (2008) that K deficiency normally occurs in intensively cropped areas with high levels of N and P application. Unbalanced N-P-K nutrition amongst Mwea rice farmers has been reported in this study, whereby only 2.5% of the farmer respondents reported using muriate of potash (KCl, MOP) for planting rice while another 10.4% used it in combination with other fertilizer types. (sic N and P fertilizers). This coupled with high drainage and leaching losses due to high solubility of K (Table 2) caused the negative K balance, decreased K soil fertility, and could decrease rice productivity. K fertilizer needs to be applied in adequate amounts in most irrigated rice fields. Further, reasons for a negative K balance stem mostly from farmers’ lack of knowledge and socioeconomic factors (Magen, 2008).
The soil micronutrient elements decreased with cultivation at point 3, implying attendant danger of micronutrient depletion with continuous rice growing. Soil Mn, Cu, Fe and Zn all decreased at point 3 in response to increasing uptake and leaching. However, the lowest zinc values at site 3 could be explained by the high bicarbonate content in waste waters at the tail end of the scheme. This agrees with Mikkelson and Brandon (1879), that high bicarbonate water (> 2 me/l) in water used for flooding and growing paddy rice is reported to cause severe Zinc deficiency. Concentration of Iron (Fe) in soil decreased from 338 to 18.3 ppm at point 3 but this was still adequate for rice nutrition. However, in alkaline soils like in this study, Fe concentrations is low and according to Masuda et al. (2019), plants encounter Fe deficiency when grown in calcareous soil with low Fe availability.
CONCLUSION
This study established that farmers in Mwea irrigation scheme are aware of the effects of the quality of irrigation water on rice production and that 51.5% of farmers used irrigation effluents while 50.6% of those who did not use it were located far from the drainage canals, and said the waste/drain water is recycled until it gets finished before reaching them. So they only depended on irrigation water which is often rationed or difficult to reach through irrigation canals resulting in water conflicts during times of shortages and low production of paddy rice. We found that wastewater reuse increased water availability and reduced peak period water scarcity amongst farmers. The farmers in Karaba section (point 3) had highest paddy rice production at 5.62 ton/ha which they attributed to the availability and use of irrigation water mixed with effluents draining from other sections of the scheme mainly Mwea, Thiba and Wamumu sections.
The physico-chemical quality of Mwea irrigation scheme effluents were higher than the fresh water source of river Thiba waters in EC,TDS, TSS, Ca2+, Mg2+, Na+, K+ and HCO3-,SO42-. Generally, there was a progressive increase of all parameters from Thiba intake (point 1) < Kiruara drain (point 2) < Thiba main drain (Point 3) including pH, nitrates, nitrites, chlorides and SAR but these were not statistically different . This study also found out that waste waters (effluents) from the two drainage sites of Kiruara drain and Thiba main drain are suitable for reuse in paddy rice production. The physico-chemical properties of MIS effluents obtained from the two effluent drain sites fell within FAO irrigation water quality recommendations therefore reusing the effluents would increase the quantity of water available for growing rice.
It was also found that soils of site 3 which utilizes water mixed with waste water/effluents draining from other paddy fields recorded ideal soil nitrogen and phosphorous contents and higher electrical conductivity compared to other sites hence the waste water has a positive effect on the soil fertility and productivity. Therefore, accumulation of N and P in soils at site 3 implies that wastewater from point 3 can be used without or with reduced fertilization thus lowering the cost of producing rice.
RECOMMENDATIONS
The authors recommend that waste water should be reused on paddy rice production in Mwea to increase available water for irrigation, and to reduce inorganic N and P fertilizer use. Reused water should be monitored, season to season, to keep track of chemicals build-up in water. The scheme management and WUA should put up measures to harness any little waste water draining from Thiba main drain for use at the lower part of the scheme. Finally, continuous soil testing on farmers’ fields irrigated with wastewater should be carried out to ascertain that there is no risk of accumulation of heavy metals.
CONFLICT OF INTERESTS
The authors have not declared any conflicts of interests.
ACKNOWLEDGEMENT
The authors would like to thank the staff of Ministry of agriculture, Mwea East sub-county, KALRO Mwea and NIB Mwea who generously provided useful information required for the study. They are grateful to Kenyatta University department staff and the Laboratory staff of the Government Chemist, Nairobi; MIAD, Mwea; and, NARL, Nairobi for their assistance in analyzing the experimental samples and MIS farmers and water users’ association staff for assisting with household survey. We also thank the AU for partial funding of the research.
REFERENCES
|
Afullo OA (2009). Irrigation Suitability Assessment of Effluents from West Kano Rice Irrigation Scheme. Ethiopian Journal of Environmental Studies and Management 2(2). |
|
|
Akinbile CO, Abd El-latif KM, Abdullah R, Yusoff MS (2011). Rice Production and Water use Efficiency for Self-sufficiency in Malaysia: A Review. Trends in Applied Sciences Research 6(10):1127-1140. |
|
|
APHA AWWA WEF (2005). Standard methods for the examination of water and wastewater. American Public Health Association (APHA), American Water Works Association (AWWA) and Water Environment Federation (WEF). P 1368. Supplement to the 21st Edition, Alexandria, USA. |
|
|
Atera AE, Onyancha FN, Majiwa EBO (2018). Production and marketing of rice in Kenya: Challenges and opportunities. Journal of Development and Agricultural Economics 10(3):64-70. |
|
|
Ayers RS, Westcott DW (1985). Water Quality for agriculture, Food and Agricultural Organisation of the United Nations, FAO Irrigation and Drainage, Paper 29, Rome, Italy. |
|
|
Ayers RS, Westcott DW (1994). Water Quality for agriculture, Food and Agricultural Organisation of the United Nations, FAO Irrigation and Drainage, Paper 29, Rome, Italy. |
|
|
Bigas H (Ed.), (2012). The Global Water Crisis: Addressing an urgent security issue. Paper for the InterAction council, 2011-2012. Hamilton, Canada: UNU-INWEH. |
|
|
Carter MR, Gregorich EG. (2006). Soil Sampling and Methods of Analysis. Taylor & Francis Group, LLC. Canada. |
|
|
Dong DP, Watanabe T (2017). Municipal Wastewater Irrigation for Rice Cultivation. In Current Perspective on Irrigation and Drainage. IntechOpen. |
|
|
Food and Agriculture Organization (FAO) (2017). Water for Sustainable Food and Agriculture A report produced for the G20 Presidency of Germany Water for Sustainable Food and Agriculture A report produced for the G20 Presidency of Germany Food and Agriculture Organization of the United Nations Rome, 2017. |
|
|
Fenton G, Conyers M (2002). Interpreting Soil Tests for Calcium, Magnesium and Ca:Mg Ratios. New South Wales Department of Agriculture, Wagga Wagga Agric. Institute, NSW. Leaflet 7, September, 2002. |
|
|
Githuku C (2009). Assessment of the Environmental Risks of Wastewater reuse in Urban and Peri-urban Agriculture in Nairobi. MSc Thesis, JKUAT. |
|
|
Hettiarachchi H, Ardakanian R (2016). Safe Use Of Wastewater In Agriculture: Good Practice Examples. UNU-FLORES. |
|
|
Hussain I, Raschid L, Hanjra MA, Marikar F, van der Hoek W (2002). Wastewater use in agriculture: Review of impacts and methodological issues in valuing impacts. (With an extended list of bibliographical references). Working Paper 37. Colombo, Sri Lanka: International Water Management Institute. |
|
|
International Rice Research Institute (2018). IRRI in Kenya. Legal notice @IRRI, 2018. |
|
|
Jacob BG, Shililu J, Muturi EJ, Mwangangi JM, Muriu S, Funes J, Githure J, Regens JL, Novak RJ (2006). Spatially targeting Culex quinquefasciatus aquatic habitats on modified land cover for implementing an Integrated Vector Management (IVM) program in three villages within the Mwea Rice Scheme, Kenya. International Journal of Health Geographics 5(18). |
|
|
James DW; Hanks RJ, Jurinak JJ (1982). Modern Irrigated Soils, Department of Soil Science and Biometeorology Utah State University. A Wiley-Interscience Publication. |
|
|
Jayalakshmi V, Lakshmi N, Charya MS, (2011). Assessment of Physico-Chemical Parameters of Water and Waste Waters in and Around Vijayawada. International Journal of Research in Pharmaceutical and Biomedical Sciences 2(3). |
|
|
Kuria JNG (2004). An economic analysis of rice Production in mwea irrigation scheme. MSc Thesis, University of NAIROBI Library. |
|
|
Magen H (2008). Balanced Crop Nutrition: Fertilizing for Crop and Food Quality. Turkish Journal of Agriculture and Forestry 32(3):183-193. |
|
|
Masuda H, Aung MS, Kobayashi T, Hamada T, .Nishizawa NK (2019). Enhancement of Iron Acquisition in Rice by the Mugineic Acid Synthase Gene With Ferric Iron Reductase Gene and OsIRO2 Confers Tolerance in Submerged and Non submerged Calcareous Soils Front. Plant Science. |
|
|
Mikkelson DS, Brandon DM (1879). Diagnosis of zinc deficiency in rice. In: Soil and Plant Tissue Testing, University of California, Division of Agricultural Science Bull. |
|
|
Muhunyu JG (2012). Is doubling rice production in Kenya by 2018 achievable? Journal of Development in Sustainable Agriculture 7(1):46-54. |
|
|
National Rice Development Strategy (2008-2018) (2014). National Rice Development Strategy-2, 2019-2030. GoK, State Department of Crops, Ministry Agriculture, Livestock, Fisheries and Cooperatives. Nairobi, Kenya SRI. |
|
|
Ndiiri JA, Mati BM, Home PG, Odongo B, Uphoff N (2012). Comparison of water savings of paddy rice under System of Rice Intensification () growing rice in Mwea, Kenya. International Journal of Current Research and Review 4(6):63-73. |
|
|
National Irrigation Authority (NIA) (2020). National Irrigation Authority newsletter, Mwea Irrigation Scheme, Kenya. |
|
|
Nyomora AM (2015). Effect of treated domestic wastewater as source of irrigation water and nutrients on rice performance in Morogoro, Tanzania. Journal of Environment and Waste Management 2(2):47-55. |
|
|
Okalebo JR, Gathua KW, Woomer PC (2002). Laboratory methods of soil and plant analysis: A working manual. TSBF Programme, Nairobi pp. 36-37. |
|
|
Onderi JN (2016). Suitability assessment of effluents from mwea irrigation scheme for reuse in irrigation for rice production, Kirinyaga County, Kenya. Msc Thesis, Kenyatta University. |
|
|
Ortega?Larroceaa MP, Siebe C, Bécard G, Méndez I, Webster R (2001). Impact of a century of wastewater irrigation on the abundance of arbuscular mycorrhizal spores in the soil of the Mezquital Valley of Mexico. Applied Soil Ecology 16(2):149-157. |
|
|
Owilla BPO (2010). Analysis of Economic Efficiency of Irrigation- Water Use in Mwea Irrigation Scheme, Unpublished MSc Thesis, Kenyatta University. |
|
|
Pierzynski GM, Sims JT, Vance GF (1994). Soils and environmental quality. Lewis Publ., Boca Raton, FL. |
|
|
Rice MAPP (2016). Rice-based and Market-oriented Agriculture Promotion Project, Mwea Irrigation Scheme, MoA, Kenya. |
|
|
Rogers P (2004). Is there a Global Water Crisis? Harvard University, Tufts University Graduate programme in Water Issues December 3, 2004. |
|
|
Schumacher BA (2002). Methods for Determination of Total Organic Carbon (TOC) in Soils and Sediments. United States Protection Agency, Las Vegas, US. |
|
|
Singh A, Agrawal M (2012). Effects of Waste Water Irrigation on Physical and Biochemical Characteristics of Soil and Metal Partitioning in Beta vulgaris L. Agricultural Research 1(4):379-391. |
|
|
Thakur KA, Rath S, Patil DU (2011). Effects on rice plant morphology and physiology of water and associated management practices of the system of rice intensification and their implications for crop performance. Paddy and Water Environment 9(1):13-24. |
|
|
United Nations Environment Programme (UNEP) (2012). Vital Water Graphics An Overview of the State of the World's Fresh and Marine Waters. |
|
|
United States Environmental Protection Agency (USEPA) (2012). Guidelines for Water Reuse. (EPA/600/R-12/618) United States Environmental Protection Agency, Washington, DC, USA. |
|
|
Webster AL (1995). Applied statistics for business and economics. Second edition. McGraw-Hill companies, Incorporated, USA. |
|
|
World Health Organization (WHO) (2006). Guidelines for the Safe Use of Wastewater, Excreta and Grey Water use in Agriculture. Geneva, Switzerland. |
|
|
Yoon CG, Kwun SK, Ham JH (2001). Effects of treated sewage irrigation on paddy rice culture and its soil. Irrigation and Drainage 50(3):227-236. |
|
|
Zulu G, Masaru TM, Misawa S (1996). Characteristics of water reuse and its effects on paddy irrigation system water balance and the riceland ecosystem. Agricultural Water Management 31(3):269-283. |
|
Copyright © 2024 Author(s) retain the copyright of this article.
This article is published under the terms of the Creative Commons Attribution License 4.0


