Full Length Research Paper

ABSTRACT
Over the years, there is a direct linkage of township drains and streams to the Opa reservoir, Obafemi Awolowo University, Nigeria. Hence the spatial and temporal variations of the reservoir’s water quality were studied between November 2012 and October 2013 to investigate the effect of these discharges on these. Physical, chemical as well as the oxygen parameters of the water were investigated using standard techniques. The parameters determined revealed considerable temporal variations with the rainy season averaged concentration of COD, TOC, OM, TSS, TS, turbidity, apparent colour, true colour, sodium, and phosphate significantly higher (p<0.05) than those of the dry season. Spatially, DO, TSS, TS, organic matter and TOC decreased significantly (p<0.05) from riverine to the lacustrine (dam site). However, calcium, sulphate, and electrical conductivity showed significant increases (p<0.05) from the riverine zone section towards the dam site. Vertically, sulphate, bicarbonate, COD, TOC, chloride, TSS, TS, turbidity, apparent colour, true colour and sodium ion values increased significantly (p<0.05) from the surface down to the bottom. Conversely, magnesium, total hardness, nitrate, BOD, DO, electrical conductivity, acidity, carbonate, alkalinity, TDS and pH values decreased (p<0.05) from water surface to the bottom of the reservoir. Therefore, the discharges from the catchment area of Opa reservoir could pose a level of risk to the aquatic ecosystem as well as the community if not well treated before being supplied.
Key words: Spatial, temporal, water quality, zones, risk level, source.
INTRODUCTION
Management of river and dam water quality has become increasingly important due to declines in water quality caused by human activities or run off. Concern, over massive anthropogenic change in the hydrological cycle of rivers, lakes and groundwater affecting their quality and potential as water resources has increased since the last century (Engelking, 2001). Successful implementation of efficient management strategies requires the monitoring of water quality changes (Cooke et al., 1993). A monitoring program and reliable estimation of the quality of the surface waters are necessary, as the chemical, physical and biological composition of surface water are the prime factors on which the suitability of the water for drinking, domestic, industrial or agricultural purposes depends. The abundance, distribution and diversity of fish species in a community are also associated with water quality parameters that are modified by land uses (Deacon and Mize, 1997). Likewise, Wynn (1999) also attributed natural variability in fish communities to differences in land-surface elevation, water temperature, water chemistry, food resources and physical habitat.
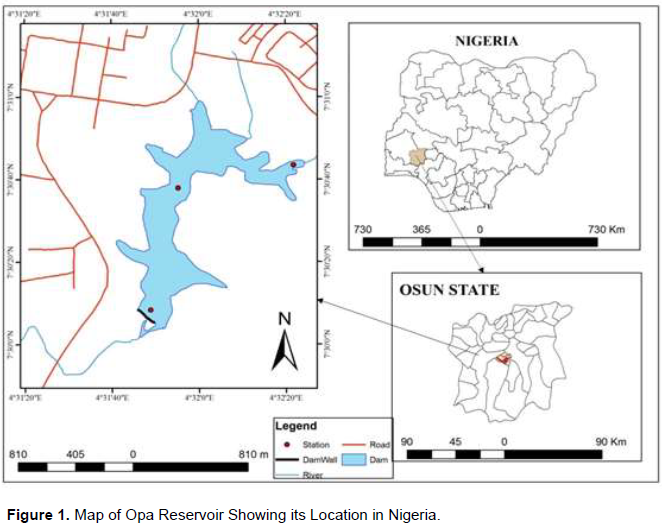
Opa reservoir was created in 1978 for the water supply scheme in the University community with a length and width of 2.5 and 0.8km respectively. The reservoir catchment area is about 110km comprising of the University Research farm, Residential Quarters, central campus, Ile Ife and rural communities (Ekenyong, 1982; Farotimi, 1985; Olaleye, 1985). Over the years, there has been a direct linkage of township drains and streams to the reservoir which consequently promoted sediment deposition in the reservoir. Moreover, as result of July 2011 flooding, Osun State Government cleared, widened and dredged the channels of the Ogbe-Esimirin River (one of the main tributaries of the Opa River) up to the University boundary which facilitated siltation and impeded the flow of the Opa River, just at the inflow.
In order to solve this problem, the University in October 2011, cleared this weed infested reach, creating a direct linkage between the sediment-laden urban runoff and the reservoir. Therefore, all manner of detritus is being delivered into the reservoir persistently. Hence the study seeks to provide information on the effect of this eroded detritus and runoff on the water quality of Opa reservoir.
MATERIALS AND METHODS
Study area and sampling sites
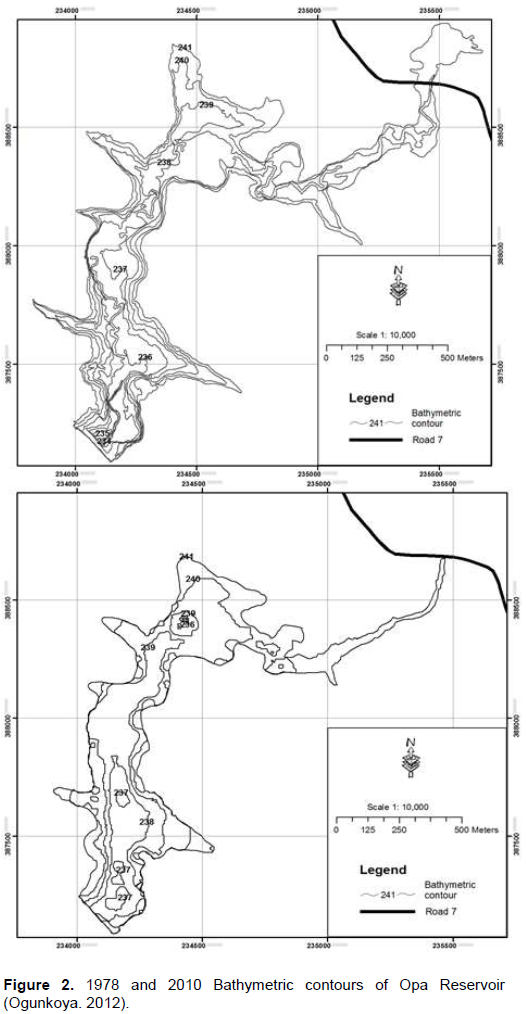
Opa reservoir, the investigated water body is located within the Obafemi Awolowo University, Ile-Ife, Ife Central Local Government Area, Osun State, Nigeria. According to Akinbuwa and Adeniyi (1996), Opa reservoir (Figure 1) was established in 1978 by the impoundment of the Opa River which has its source in Oke-Opa, a series of hills on the eastern side of the Ife-Ilesha road. A number of streams unite to form the Opa River, the major one being the Rivers Amuta, Obudu and Esinmirin. The surface area of the reservoir is about 0.95 km2 while the maximum capacity is about 675,000m3. The minimum depth is 1.01m while the maximum depth is 4.99 m, at this level live storage is about 389,000 m3. Ogunkoya (2012) reported 41.4% change in the reservoir’s total volume between 1978 and 2010 based on changes in successive bathymetric contours of the waterbody (Figure 2).
The reservoir was primarily created to supply potable water to the University community hence fishing activities are permitted only for recreational and research purposes. It has a catchment area about 116 sq.km extending in width from longitude 004Ëš31 to 004Ëš 39´E, and in length from latitude 07Ëš21 to 7Ëš35´N. Three Sampling stations were established along the length of the Reservoir namely the Lacustrine, Transition and Riverine zones. Water samples were collected from surface and bottom portion of these three sampling stations monthly, for a period of one year (November 2012 to October 2013) to study changes in the water quality. The annual cycle covers dry season of about five months (November to March) and rainy season of about seven months (April to October) which is typical of moist monsoon equatorial climate.
Sample collection
Water samples (36) from both surface and bottom portion of the reservoir were collected in 2 litre capacity plastic bottles. Before sampling, each bottle was washed with detergent followed by tap water and finally rinsed several times with distilled water. The surface water at each sampling station was allowed to overflow for some time. Then the bottles were rinsed thrice with this water, thereafter 2 litres of water was taken. While the bottom water sample was taken using an improvised closing bottle sampler. The samples were properly tagged, air tightened and stored in a refrigerator till the complete analyses were carried out.
Water analysis
Water temperature was measured in situ with a mercury-in-glass bulb thermometer while pH, conductivity, Total suspended solids and Total Dissolved Solids were also measured in-situ using a conductivity meter, a TDS and pH meter (PCE-PHD Version 1.1 Model Q656697). Water transparency was likewise measured in situ using a graduated Secchi disc. The samples for the determination of dissolved oxygen (DO) were collected in a 250/125ml capacity glass reagent bottles, fixed in the field using Winkler’s reagents and brought to the laboratory for further processing. Samples for (Biochemical oxygen demand) BOD5 determination were equally collected in glass reagent bottle but were not fixed. BOD water samples were kept in a dark cupboard at room temperature (25°C) for five days after which its oxygen content was determined by the Winkler method.
Water samples (36 samples) collected in 2 L polyethylene jerry cans were used for the determination of other chemical parameters. The samples were analysed for apparent colour and turbidity by a colorimetric method (Mackereth et al., 1978) and TSS was determined gravimetrically. Chemical analysis of the water samples was in accordance with standard methods of Golterman et al. (1978), Mackereth et al. (1978), APHA et al. (1995) and Ademoroti (1996) as applicable. The chemical parameters analyzed included major ions (Ca2+, Mg2+, Na+, K+, Cl-, SO42-, HCO3-), salinity parameters (Conductivity, Total Dissolved Solids), plant nutrients(Organic matter, nitrate, PO43-) and oxygen parameters (DO, BOD5,COD).
Statistical analysis
Data were subjected to appropriate statistical methods including descriptive statistics, regression analysis and correlation analysis and analysis of variance (ANOVA) to test the spatial and seasonal variation effects on Opa Reservoir water quality using SPSS package (Version 21; SPSS Inc. 2012). Inter-relationship among /between physico - chemical factors and sampling stations was determined using PAST (Paleontological Statistics) Statistical software version 2.12.
RESULTS
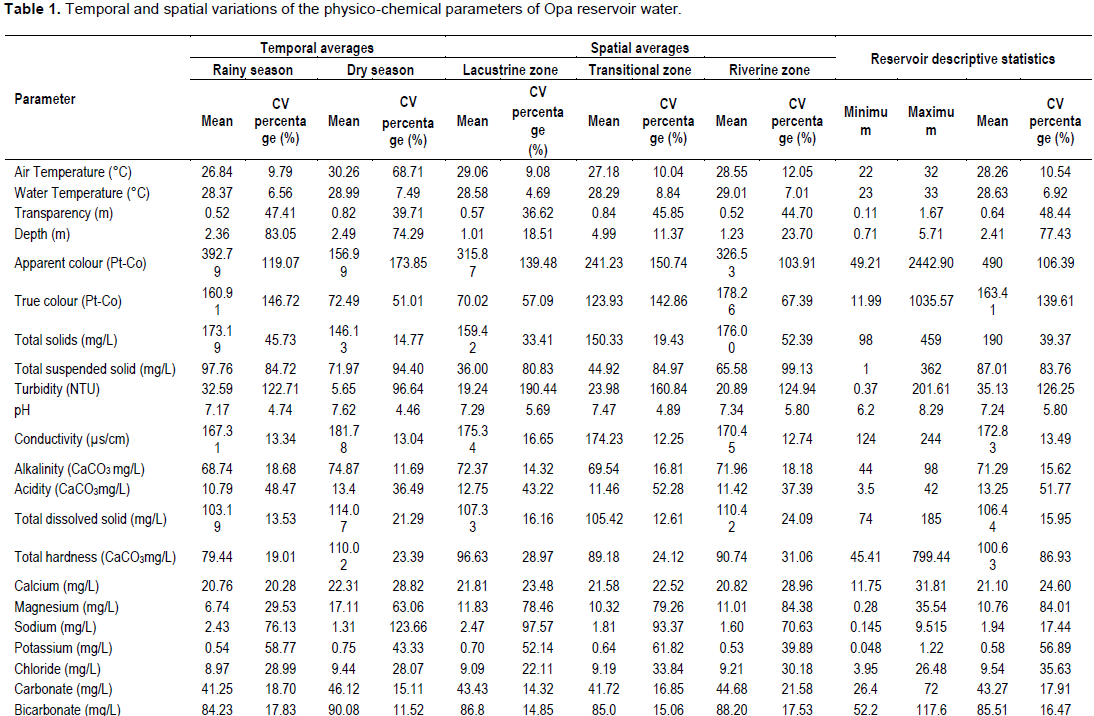
A summary of the descriptive statistics of the different water quality parameters recorded along with spatial and temporal changes are shown in Table 1. The overall water temperature mean recorded from Opa reservoir was 28.63°C, with CV value of 6.92%, which varied widely with minimum and maximum recorded temperatures of 23.0°C and 33.0°C in April and July 2013 respectively (Table 1). While the air temperature overall mean was found to be 28.26°C with CV of 10.54%, ranging from 22.0°C to 32.0°C (Table1). In general, maximum air and water temperature was recorded from the lacustrine zone of the reservoir (Table 2). Temporally, the maximum mean air and water temperature recorded occurred during the dry season with no significant (p>0.05) and highly significant (p<0.001) seasonal differences respectively (Table 3). Water transparency in the reservoir as measured by Secchi disc had an overall mean of 0.64m (CV of 48.44%) with wide range values and spatially significant difference (p<0.05) horizontally (Table 2). Temporally, the highest maximum transparency mean was recorded in the dry season among highly significant (p<0.001) seasonal variation as presented in Table 3. The water depth showed a wide shift through the reservoir zones. The overall mean water depth of the reservoir was found to be 2.41m with CV of 77.43%. The maximum mean value was recorded in the transition zone (4.99 m) with CV of 11.37% (Table 1) while the minimum was found lacustrine zone amid highly significant spatial difference (p<0.001) along the horizontal axis (Table 2). The seasonal variations in water depth was more pronounced during the rainy season than dry season, however the difference was insignificant (p>0.05).
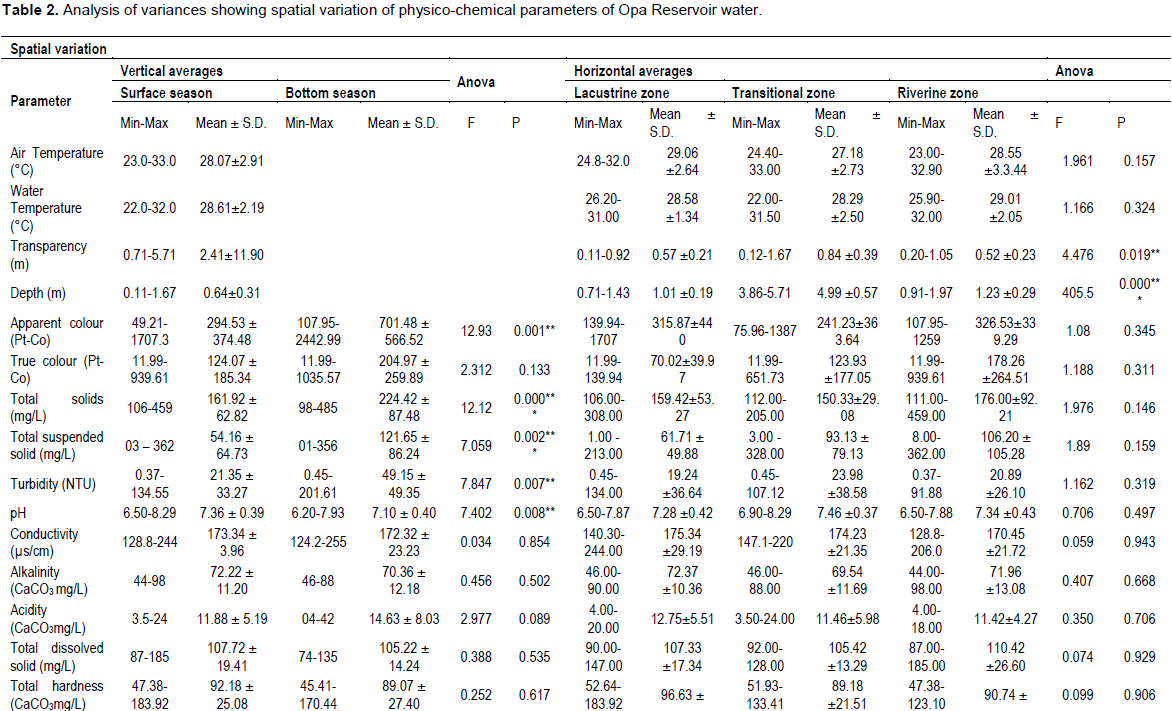
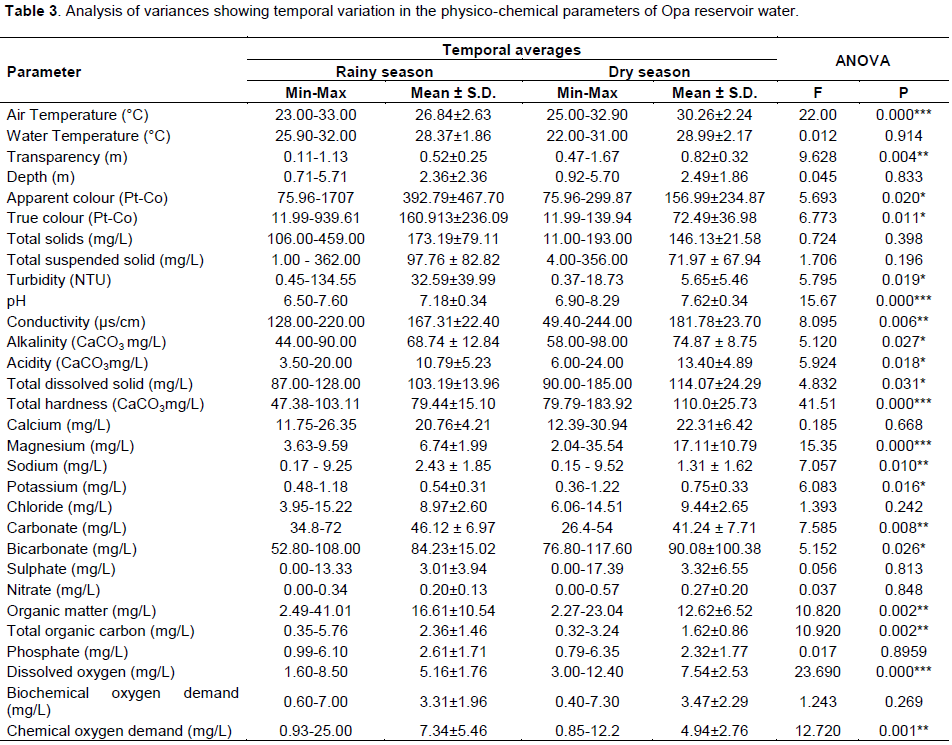
Horizontally, the lowest mean apparent colour recorded for the reservoir was 241.23 Pt.Co units in the transition zone while the highest mean observed was 326.53 Pt.Co units in the riverine zone. Vertically, the maximum apparent colour was recorded in the bottom portion with highly significant (p<0.001) variation along the axis (Table 2). While the overall true colour mean was found to be 163.41 Pt.Co units (CV - 139.61%) with insignificant differences along the horizontal axis. True and Apparent colour were higher during the rainy season compared to dry season with high significant (p<0.001) and no significant (p>0.05) seasonal differences respectively (Table 3). The maximum total solid and turbidity were recorded in the riverine zone and the minimum occurred in the lacustrine zone along the horizontal axis while along the vertical axis, the highest value was recorded in the bottom water with highly significant differences (p<0.001) (Table 2). Temporally, the highest value was recorded in the rainy season for both TS and turbidity with no significant (p>0.05) and significant (p<0.05) seasonal differences correspondingly (Table 3). PH measurements were more or less similar in all the zones along the horizontal axis while vertically, there was a significant variation in pH (p<0.05), the maximum value of 7.36 was recorded from the surface water. The electrical conductivity values varied between 124.4 and 244 µS/cm having slight variation along the horizontal and vertical axis of the reservoir. There occurred a highly significant (p<0.001) temporal variation in pH and electrical conductivity with the highest mean values recorded during the dry season (Table 3). Likewise, acidity seasonal variation showed higher concentrations during the dry season compared to the rainy season with a significant difference (p<0.05).
However, the highest mean concentration ofalkalinity was recorded in the rainy season with significant seasonal difference (p<0.05). While spatially the overall mean of alkalinity was, 71.24 CaCO3 mg/L with a CV of 15.62% with no significant difference in the mean concentrations along the, horizontal and vertical axis of the reservoir (Table 1). The TDS and total hardness values varied insignificantly along the horizontal and vertical axis of the reservoir (Table 2). The highest mean values of TDS and total hardness were observed in the dry season with significant (p<0.05) and highly significant (p < 0.001) seasonal differences (Table 3).
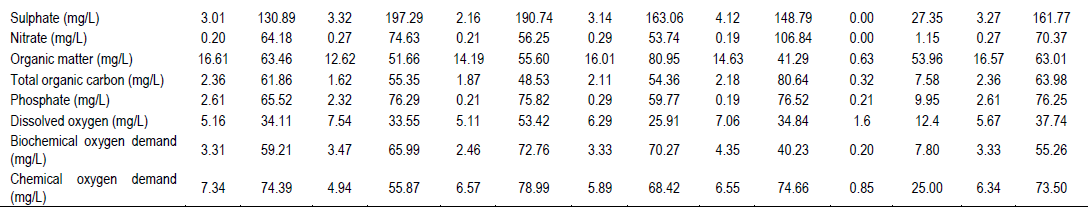
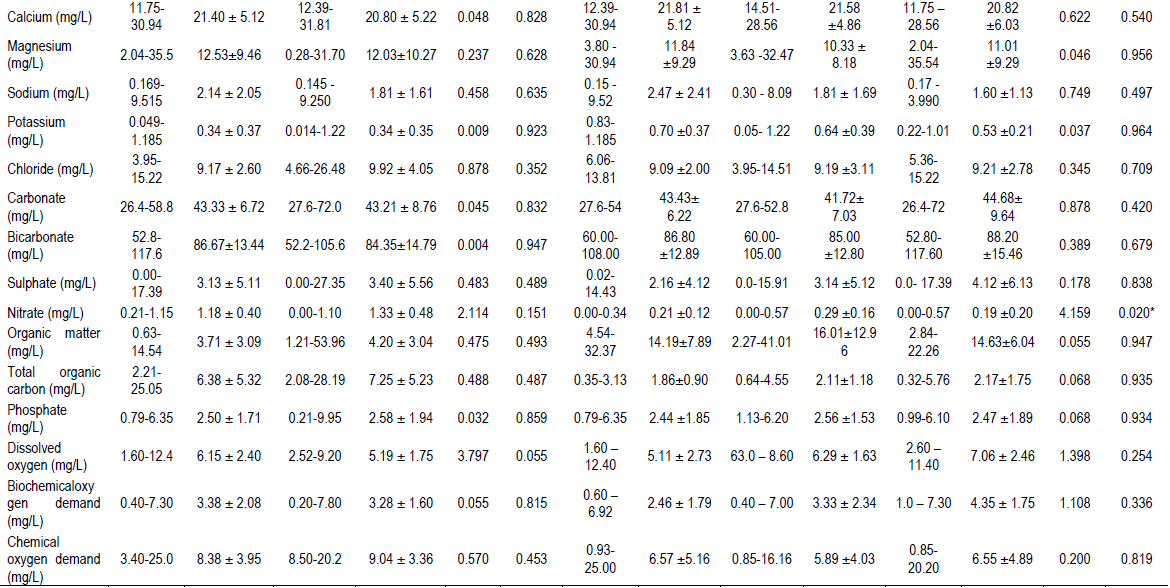
The concentration of major ions investigated varied widely spatially and temporally (Tables 1, 2 and 3). On the whole, mean values of calcium, sodium, chloride, sulphate and nitrate were 21.10, 23.79, 9.54, 3.27 and 0.27mg/L respectively. Most of these ions did not follow a definite pattern spatially and varied significantly seasonally. Spatially, insignificant variation was observed for magnesium and potassium ions with mean values of 12.28 and 0.34mg/L respectively (Table 1). However, these ions showed significant seasonal variations with higher means during dry and rainy seasons respectively (Table 3). Temporally, higher carbonate and bicarbonate were recorded during the dry season with significant seasonal (p<0.05) variations (Table 3). The overall mean concentrations of organic matter and total organic carbon were 16.57 and 2.36mg/L. The concentration of organic matter and total organic matter showed insignificant difference spatially and a highly significant temporal variation (p<0.001) (Table 3).
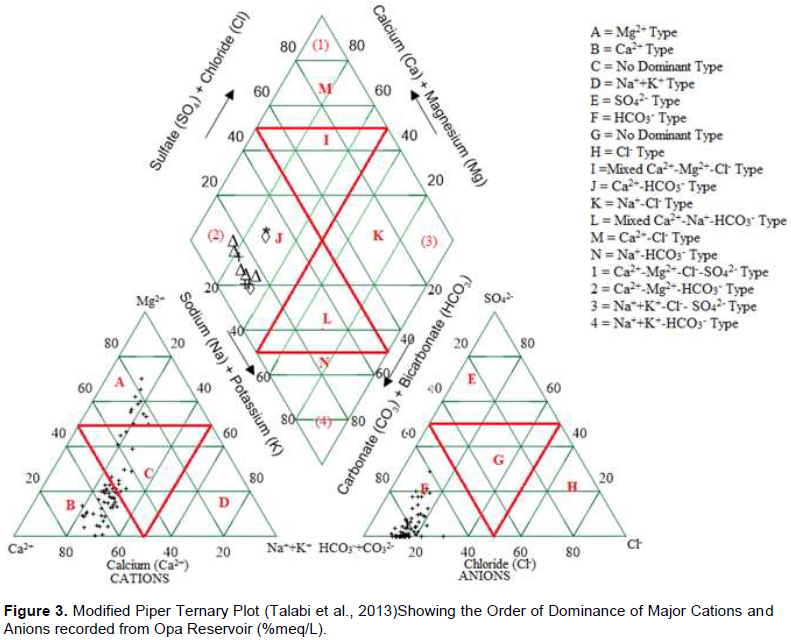
Dissolved oxygen varied from 1.60 to 12.40 mg/L with a mean of 5.67 mg/L. Seasonally, the dissolved oxygen maximum value was observed during the dry season with a significant variation (p < 0.001). The BOD concentration showed significant fluctuations both the spatially and temporally, varying from 0.20 to 7.80 mg/L. COD varied between 0.85 and 25.0 mg/L with a mean of 6.34 mg/L and CV of 73.50% (Table 1). The maximum mean concentration was recorded in the riverine zone along the horizontal axis as well as in the bottom water along the vertical axis. Air temperature, water temperature, pH, conductivity, alkalinity, acidity, TDS, calcium, magnesium, chloride, carbonate, bicarbonate, nitrate, phosphate, DO and BOD were all higher in dry season compared with the rainy season while depth, apparent colour, true colour, TS, TSS, turbidity, sodium, potassium, sulphate, organic matter, total organic matter and chemical oxygen demand were all higher in the rainy season. The order of dominance of major ions in Opa reservoir was found to be Ca2+ > Mg2+ > Na+ > K+ and HCO3- >Cl- > SO42- > NO3- for cationic and anionic order respectively. This is further shown by the ternary plots which show the dominance of calcium and magnesium ions among the cations as well as bicarbonate among the anions (Figure 3). Figure 4 compared previous records of physico-chemical properties of Opa reservoir with the present findings showing the increment or decrement. The effect of hydrological alterations over the years was seen in a significant increase in water temperature, total suspended solids, pH, dissolved oxygen, calcium, magnesium and phosphate. While chloride concentration showed a slight increase overall its concentration at different zones overlapped with the previous records. Drastic reduction in concentration of potassium, sodium and sulphate was observed in the present study.
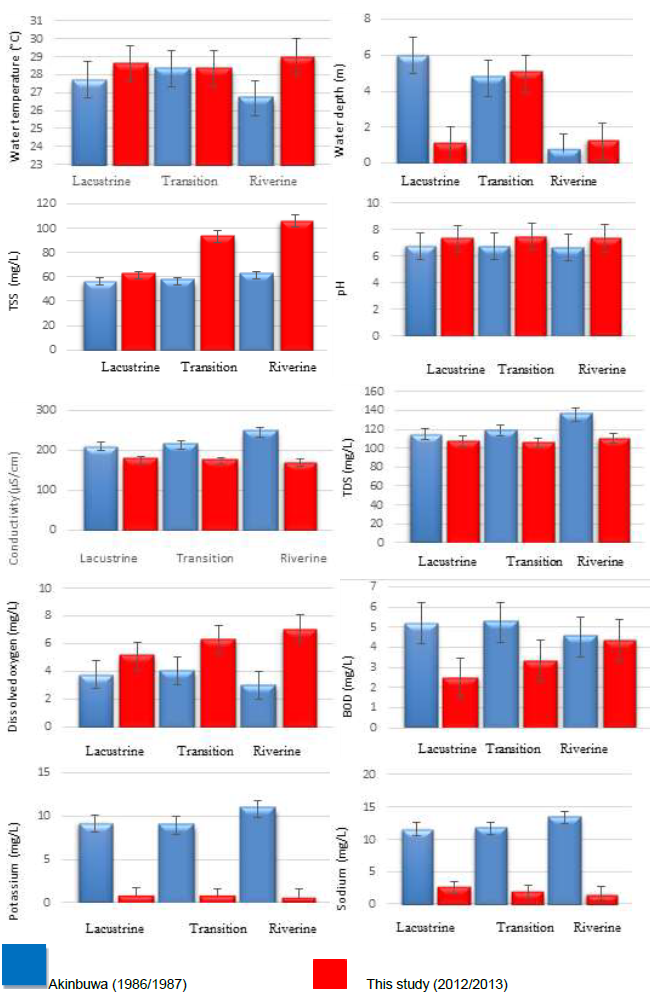
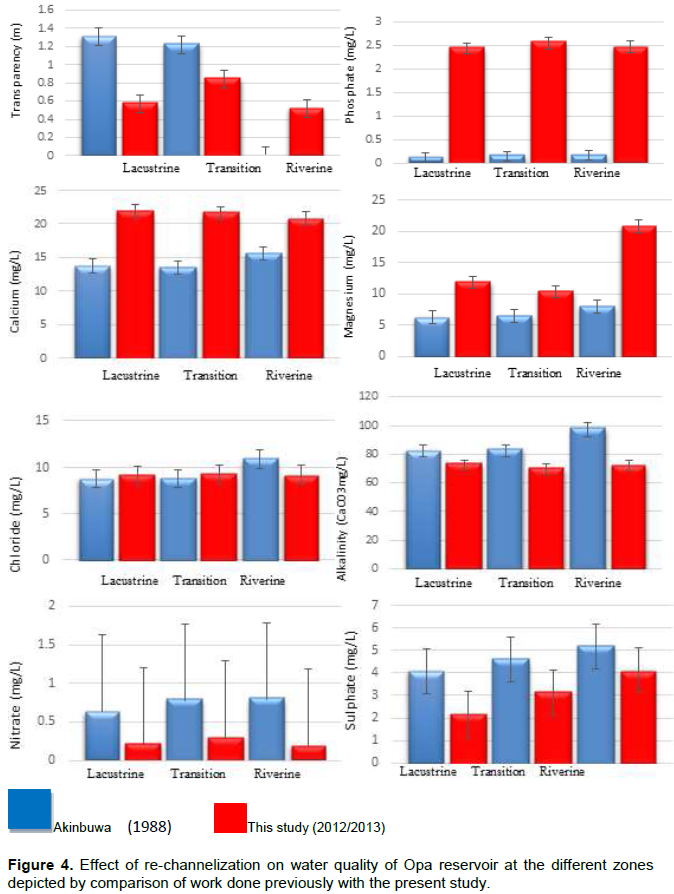
Moreover, a decrease in conductivity, transparency, total dissolved solids, BOD, alkalinity and nitrate was also observed. Principal components analysis was used to find out the probable contributing source of the investigated physicochemical water quality parameters, both temporally and spatially (Table 4). The contributory variance of the first component for the rainy season (RPC1) was 33.1% with strong loadings for calcium, chloride, bicarbonate, pH, hardness and water temperature; and with moderate loadings for magnesium, conductivity, air temperature and transparency. It also showed weak loadings for dissolved oxygen, sulphate and TDS. The first component of the dry season analysis accounted for 26.57% of the total variance, and showed strong loadings for chloride and moderate loadings for magnesium, bicarbonate, conductivity, total dissolved solid, acidity, water temperature and turbidity. The dry season second component also had moderate loadings for magnesium, phosphate and total suspended solid.
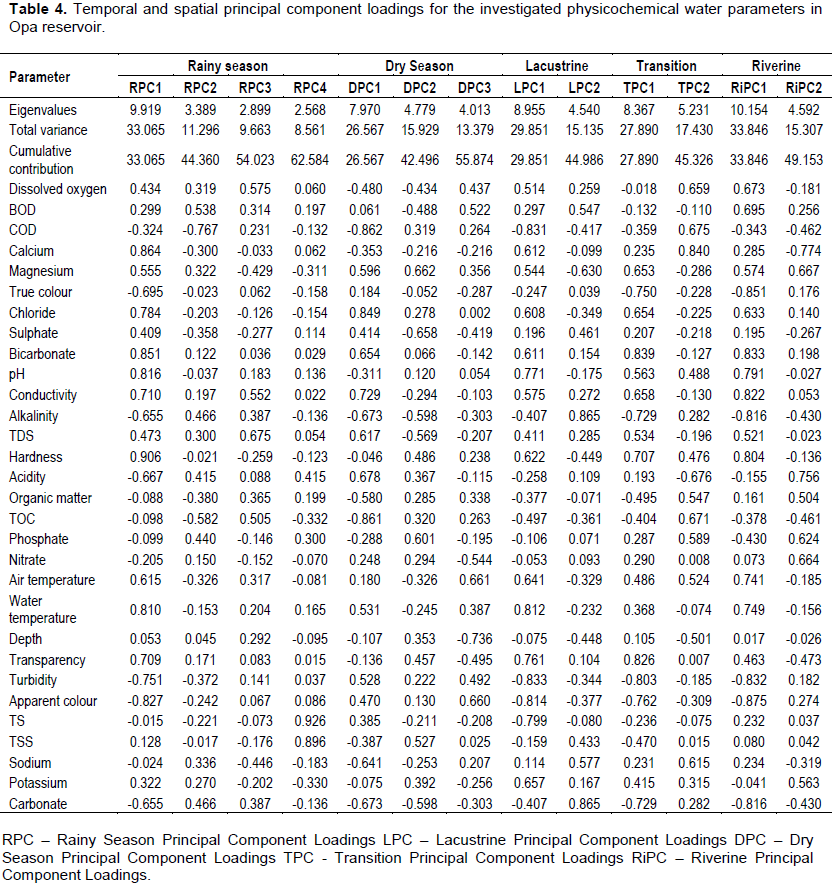
Spatially, the first component from the riverine and lacustrine zone (LPC1 and RiPC1) which accounted for 29.85 and 33.85% respectively showed strong loadings for pH and water temperature. Likewise, strong loadings were observed for bicarbonate at TPC1 and RiPC1 but moderate loading at LPC1. Conductivity and hardness had moderate loading at LPC1 and TPC1 and strong loading at RiPC1. Strong loading was also obtained for transparency at LPC1 and TPC1. Carbonate and sulphate also had strong loadings at LPC2 and RPC4 which accounted for 15.13 and 12.24% of the total variance for each zone respectively. While the third component of the transition zone (12.29% total variance) showed elevated loadings for total solid and total suspended solid.
DISCUSSION
The research findings clearly show that the observed mean temperature is in agreement with WHO’s recommendation for drinking water (WHO, 1999; WHO, 2006) of 27 to 28ËšC. The mean temperature (28.63± 31.99oC) was also in agreement with the report of Otobo (1995) who reported surface water temperature of rivers or lakes in Nigeria to be between 26 and 31ËšC. Higher water temperatures during the dry season could probably be attributed to high atmospheric temperature and solarradiation, low relative humidity and reduction in the amount of suspended particles, that is, high water transparency and heat from sunlight increasing the temperature of the surface water.
Similarly, the drop in water temperature in the wet season could be ascribed to a lowering of temperature associated with the rainy season in Southern Nigeria (Bieluonwu, 2005). Temperature is an important characteristic that can vary widely and is influenced by a number of variables including geographic location, shading, water body size and depth, time of year and time of day (Atobatele and Ugwumba, 2008).
Low water transparency observed in the wet season has been linked to the heavy rains, accompanied by increased water velocity and sediment load from surface runoff (Lucinda and Martin, 1999). Ekeh and Sikoki (2003) also suggested that input of particulate organic matter, debris and fine silt from the riparian zone, surface runoff water and increased amount of municipal and industrial waste discharge as probable causes. The higher dry season water transparency values, as compared to the rainy season, is likely to be due to the absence of floodwater, surface run-off and the settling effect of suspended materials that follows the cessation of rainfall. The effect of runoff was also seen on turbidity values which were higher during the rainy season than the dry season, probably due to solid waste material and soil particles transported from urban activities into the river and then the reservoir. According to Welcome (1985), acceleration of flow causes rivers to pick up sediments hence, waters in the rising flood are heavily charged with silt load. The resultant effect of this is a reduction in sunlight penetration which could affect fish and aquatic life (Park, 2009). The range of pH values (6.20 to 8.29) observed in the study area was within the range reported for some Nigerian rivers such as the River Asa (6.8 to 8.9) (Adeniji, 1990) and the River Kaduna (6.4 to 7.2) (Samuel et al., 2015). Similarly, the observed pH values fell within the range of Class II (Acceptable Quality) as classified by Prati et al. (1971). The pH values were alkaline during the dry season and slightly acidic during the rainy season. This variation in pH in the reservoir can be explainable in terms of vegetation decay and higher influx into the basin (Ikhile, 2004) which also explains the higher apparent and true colour recorded in the rainy season. This has also been reported by some authors such as Adebisi, 1981 (Upper Ogun river); Tyokumbur et al., 2002 (Awba stream and Reservoir); Ikomi et al., 2003 (River Adofi) as well as Okogwu and Ugwumba, 2006 (Ologe Lagoon). Higher pH during the dry season could be due to, an increase in photosynthetic activity during this period hence increasing primary productivity and the uptake of carbon dioxide (Hammer, 1971; Ekubo and Abowei, 2011). However, the few lower pH values obtained in the study area could be linked to the predominant soil type in the area (Adeniji, 1978) or possibly to the built-up of organic material from runoff. As organic substances decay, carbon dioxide is released and combines with water to produce weak acid “carbonic” acid.
Although, the pH mean obtained in this study is within the acceptable level 6.5 to 8.0 recommended for drinking water (WHO, FEPA). However, some fish would not be able to tolerate the low pH as observed during the course of the study because low pH would result in high concentration of free CO2 thus limiting the capacity of fish blood to carry oxygen by lowering blood pH at the gill (Wurts and Durborow, 1992). Moreover, low pH has synergistic effects on heavy metal toxicity. The pH of water is equally important because many biological activities can occur only within a narrow range. Thus, any variation beyond the acceptable range could be fatal to some particular organism. The mean pH of 7.03 reported previously by Ogunfowokan et al., (2010) as compared to recorded, 7.23 revealed that the waterbody is close to neutral (safe for most organisms) and well buffered as a result of re-channelization.
The electrical conductivity values obtained in this reservoir are very much below the WHO (2007) level of 500 mg/L. The higher values observed during the dry season could be as a result of the influence of low precipitation, higher atmospheric temperature and increased evaporation (Ideriah et al., 2010). The reduction in conductivity during the rainy season that occurred with rising floods in the study area could be attributed to the dilution effect of the increased water volume within the reservoir. According to Welcome (1985), conductivity could also be affected by local conditions such as washing out of nutrient rich grounds during rains. The conductivity result was also a reflection of TDS which was significantly higher in the dry season as compared to the rainy season. Nevertheless, the TDS values for both seasons were within the permissible limit (500mg/L) recommended for drinking water. The relatively high TDS values observed during the dry season could be attributed to low level of water and impact of decomposing waste materials deposited during the rainy season. The higher total dissolved solids (TDS) values in the dry season compared to the wet season are in agreement with the observations of Otobo (1995) from Nun River and Taylor Creek in the Niger Delta. Sikoki and Veen (2004) also acknowledged seasonal and daily changes in the concentration of substances present in a water body. According to Otobo (1995), the concentration and relative abundance of ions in river waters (that is, its chemical composition) is highly variable and depends mainly on the nature of the bedrock, precipitation and evaporation–crystallization processes.
Total hardness fell within the maximum permissible limit for drinking water of 500 mg/L (WHO, 2007), thus the water will not precipitate soap, deposit scale and crust accumulation in containers will be highly minimized. The higher water hardness observed during the dry season could be as a result of low water levels and the concentration of ions, while the lower rainy season values could be due to dilution. This agrees with the results of Kolo and Oladimeji (2004) from Shiroro Lake and Ufodike et al. (2001) from the Dokowa mine lake. The mean alkalinity agreed with the range documented by Moyle (1996) and Boyd (1981) for natural water. The alkalinity is higher in the dry season and lower in the rainy season, when the reservoir had high water levels. This could be due to low water levels with its attendant concentration of salts and the lower value in the rainy season could be due to dilution (Ufodike et al., 2001). The level of alkalinity of the water samples were within the stipulated limit of 100mg/L for portable water (WHO, 2007), despite the temporal and spatial variations of the values. The low level of the alkalinity indicates that the catchment geology as well as anthropogenic runoff are the main source of natural alkalinity, and probably contains low carbonate, bicarbonate, and hydroxide (Dhameja, 2012).
The high dry season phosphate mean could result from concentration effects because of reduced water volume. It could also result from lower water hardness, and thus less co-precipitation of phosphate with calcium carbonate, a phenomenon that has often been reported to occur in many freshwater lakes (House, 1990; Heleen et al., 1995). Nitrate concentration’s seasonal variation agrees with the observations of Ideriah et al., (2010) from Amadi Creek, which they attributed to the reduction of water volume in the dry season, and to the dilution effect in the rainy season. The implication of river water having high NO3- concentrations is the stimulation of the growth of plankton and water weeds that provide food for fish. If algae grow excessively, oxygen levels can be reduced and fish can die. Park (2009) noted that the guideline value for nitrate in drinking water is solely to prevent metamoglobinemia, which depends upon the conversion of nitrate to nitrite.
The general concentrations of SO42- from this study were within the 200 mg/L limit for surface water projected for drinking water (EU, 1989). However, in comparison with data from previous studies in Southern Nigeria, the present findings showed some variations. These variations could be a reflection of the type of land use activities in the study areas. Chloride mean concentration was generally below the permissible limit 250mg/L, for surface water to be used for drinking water (EU, 1989), for both dry and rainy seasons. Although there were inputs of pollutants from municipal wastes into the river, the level was not high enough to significantly increase chloride concentrations above the limit.
The levels of Ca2+ and Mg2+ in the dry season were significantly (P=0.05) higher than the concentrations of rainy season samples. However, all the values were within stipulated limit of 75mg/L for Ca2+ and 30mg/L for mg2+ for drinking water (BIS 2012). Based on the values of the BOD reported in the transition and riverine zones of the reservoir, these areas can be classified as polluted, because the oxygen demand probably exceeded the available oxygen. The demand for oxygen is directly proportional to the amount of oxygen needed by waste materials that are to be broken down (Dhameja, 2005).
The dissolved oxygen (DO) varied between sampling locations and seasons. The transition zone’s DO which was above the limit of 5 mg/L for drinking water (WHO, 2002) and had the least variance could be an indication of less organic waste accumulation at this point. The lacustrine zone, however, had relatively lower DO (with highest CV) which could be attributed to the impact of municipal wastes dumped directly into the Opa river the main tributary of the reservoir or through runoff that is then washed further down the reservoir from the riverine zone as a result of the force of water entering the reservoir. In addition, microbial breakdown of the organic material could also lead to higher DO utilization and DO reduction at these zones of the reservoir. The higher dissolved oxygen concentrations for the dry season coincide with periods of lowest turbidity. In comparison, the cool wind which increases wave action, decreased surface water temperatures as well as increased turbidity may contribute to the decrease in dissolved oxygen concentrations observed during rainy season. The amount of dissolved oxygen in the water has been reported to fluctuate depending on temperature, depth, and wind pattern, and the biological activities going on within water bodies such as degradation (Adeniji, 1973; Ibe, 1993).
The strong and moderate positive PCA loadings recorded for calcium, magnesium, total suspended solid, dissolved oxygen and phosphate during the rainy season as well as the increase observed in comparison with a previous study (Akinbuwa, 1988) reveal the effect of discharges from the catchment area. This was indicated by the strong PCA loadings the riverine zone of the reservoir had for pH, bicarbonate conductivity, and hardness as well as the elevated loadings recorded for total solids and total suspended solids in the transition zone due to influx of run-off. These effects could be linked to the anthropogenic activities in the catchment such as agricultural activities, municipal and industrial waste generation. However, the strong PCA loadings recorded for chloride, magnesium, bicarbonate, and conductivity during dry season reflected their natural background level, hence these are probably derived from natural sources such as weathering of rocks or from the catchment geology. This could also be attributed to low water levels characterized of this season.
In conclusion, the effect of discharges was reflected in 19 out of 29 physico-chemical parameters that showed statistically significant differences seasonally. Moreover, the decrease in the recorded concentrations of DO, TSS, TS, organic matter and TOC from the riverine zone towards the lacustrine zone also revealed the effect of influxes from the catchment upstream. Although most of the ionic concentrations as well as the TDS were higher during the dry season,
It is unfounded to conclude that these ions were fromnatural sources due to the fact that the dry season is known for a reduction in water level and hence the increase in the concentrations of these ions by evaporation. The higher concentrations of TOC, phosphate and COD recorded during the rainy season could be linked to direct discharge of untreated municipal/industrial waste as well as run off from agricultural areas into the reservoir. Therefore, the discharges from the catchment area of the Opa reservoir could pose a level of risk to the aquatic ecosystem as well as the community if the water is not well treated before being supplied for consumptive uses.
CONFLICT OF INTERESTS
The authors have not declared any conflict of interests.
REFERENCES
|
Adebisi AA (1981). The physico-chemical hydrology of a tropical seasonal river- Upper Ogun River. Hydrobiol. 79:159-165. |
|
|
Adeniji HA (1978). Diurnal vertical distribution of zooplankton during stratification in Kainji lake Nigeria. Vern. Internal. Verom. Limnol. 20:1677-1683. |
|
|
Adeniji HA (1990). Preliminary Study of the Fisheries Limnology of Bakolori Lake Nigeria. Report Presented to Sokoto Rima River Basin Dev. Authority. |
|
|
Akinbuwa O (1988). The study of the physico-chemical factors and rotifer fauna of Opa Reservoir, Ile Ife, Nigeria. M.Sc. Thesis, University of Ife, Ile-Ife, Nigeria. Pp. 261. |
|
|
Akinbuwa O, Adeniyi IF (1996). Seasonal variation, distribution and interrelationships of rotifers in Opa Reservoir, Nigeria. Afr. J. Ecol. 34:351-263. |
|
|
APHA, AWWA, WEF (1995). Standard methods for the examination of water and waste water. American Public Health Association, American Water Works Association and Water Environment Federation, Washington, D.C. |
|
|
Atobatele OE, Ugwumba OA (2008). Seasonal Variation in the physicochemistry of a small tropical reservoir (Aiba Reservoir, Iwo, Osun, Nigeria). Afr. J. Biotechnol. 7(12): 1962-1971. |
|
|
Bieluonwu AU (2005). Physico-Chemical profile study of a portion of Ulasi River from Ezinifite to Ogwu-Aniocha in Anambra State, Nigeria. Glob. J. Pure Appl. Sci. 11(4):517-521. |
|
|
BIS (2012). Bureau of Indian Standards. Specification for drinking water. ISI 10500: 2012, New Delhi, India. |
|
|
Boyd CE (1979). Water Quality in Warm Water Fish Ponds. Auburn University Press. Alabama. 359. |
|
|
Dhameja SK (2012). Environmental Engineering and Management S.K. Kataria and Sons Pub, pp. 51-218. |
|
|
Ekubo AA, Abowei JFN (2011). Review of some water quality management principles in culture fisheries. Res. J. Appl. Sci. Engr. Tech. 3(12):1342-1357. |
|
|
Ekeh IB, Sikoki FD (2003). The state and seasonal variability of some physico-chemical parameters in the New Calabar River, Nigeria. Supp. ad Acta Hydrobiol. 5:45-60. |
|
|
Ekenyong E (1982). The physico-chemical quality of water in relation to primary production of fish ponds in Ile-Ife, Oyo state, Nigeria. M.Sc. Thesis, University of Ife. |
|
|
Engelking P (2001). Pollution Microsoft Encarta Online Encyclopedia. |
|
|
EU (1989). European Communities (Quality of surface water intended for abstraction of Drinking water) Regulations. S.I. No. 249/1989. |
|
|
Farotimi OO (1985). The distribution of cichlid fish species in Opa Reservoir, University of Ife, Ile-Ife, Nigeria. M.Sc. Thesis, University of Ife, pp. 6-10. |
|
|
Hammer UI (1971). Limnological Studies of the Lakes and Streams of the Upper Qu' Appelle River System, Saskatchewan, Canada. Hydrobiol. 37:437-507. |
|
|
Ideriah TJ, Amachree O, Stanley HO (2010). Assessment of Water Quality along Amadi Creek in Port- Harcourt, Nigeria. Scientia Afric. 9(1):150-162 |
|
|
Ikhile CI (2004). Water Chemistry of Some Streams in Tropical Rainforest Area of Edo State, Nigeria, in Ibitoye, A. (eds), Scientific and Environmental Issues in Population, Environment and Sustainable Development in Nigeria, Department of Geography & Regional Planning, University of Ado-Ekiti Research Group. |
|
|
Ikomi RB, Iloba KI, Ekure MA (2003). The Physical and Chemical Hydrology of River Adofi at Utagba-Uno, Delta State, Nigeria. Zool. 2(2):84-95. |
|
|
Lawson, E. O. 2011. Physical-Chemical Parameters and Heavy Metal Contents of water from the mangrove swamps of Lagos lagoon, Nigeria. Adv. Biol. Res. 5(1):08-21. |
|
|
Lucinda C, Martin N (1999). Oxford English Mini-Dictionary. Oxford Univ. Press. Inc. New York pp. 200-535. |
|
|
Ogunkoya OO (2012). All Rivers run into the sea; yet the sea is not full. Inaugural lecture Series 256, Obafemi Awolowo University, Ile Ife Nigeria. |
|
|
Okogwu OI, Ugwumba OA (2006). The Zooplankton and Environmental characteristics of Ologe Lagoon, South West, Nigeria. Zool. 4:86-92. |
|
|
Olaleye VF (1985). Proximate analysis of the muscle of Sarotherdon galilaeus (Syn. Tilapia galilaeus) from Opa Reservoir, University of Ife, Ile-Ife, Nigeria. M.Sc. Thesis, University of Ife, pp. 10-13. |
|
|
Otobo AJT (1995). The Ecology and Fishery of the Pygmy Herring Sierratherissa leonensis (Thys van Dan Audenaerde, 1969) (Clupeidae) in the Nun River and Taylor Creek of the Niger Delta. Ph.D Thesis University of Port Harcourt 221 p. |
|
|
Park K (2009). Park's Textbook of Preventive and Social Medicine. India, M/S Banarsidas Bhanot Pub. pp. 659-661. |
|
|
Prati L, Pavanello R, Pesarin F. (1971). Assessment of Surface Water Quality by a Single Index of Pollution‖, Water Res. 5:741. |
|
|
Samuel PO, Adakole JA, Suleiman B (2015). Temporal spatial physico-chemical parameters of River Galma, Zaria, Kaduna state, Nigeria. Res. Environ. 5(4):110-123 |
|
|
Sikoki FD, Veen JV (2004). Aspects of water quality and the potential for fish production of Shiroro reservoir, Nigeria. Liv. Sys. Sustain. Dev. 2: 7 |
|
|
Talabi AO, Afolagboye OL, Tijani MN, Aladejana JA, and Ogundana AK (2013). Hydrogeochemical Assessment of Surface Water in the Central Part of Ekiti-State, Southwestern Nigeria." Am. J. Water Res. 1(4):56-65. |
|
|
Tyokumbur ET, Okorie TG, Ugumba OA (2002). Limnological assessment of the effects of effluents on macroinvertebrate fauna in Awba Stream and Reservoir, Ibadan, Nigeria. Zool. 1(2):59-69. |
|
|
Ufodike EBC, Kwanasie AS, ChudeLA (2001). On-set of rain and its destabilizing effect on aquatic physico-chemical parameters. J. Aquat. Sci. 16(2):91-94. |
|
|
Welcome RL (1985). Rivers Fisheries FAO Fish. Tech. Pap. (262): 330P. |
|
|
WHO (1999). Guidelines for Drinking water quality regulation. 2nd edition Recommendation. World Health Organization, Geneva. 1:30-113. |
|
|
WHO (2002). The guideline for drinking water quality recommendations; World Health Organization; Geneva. |
|
|
WHO (2006). Guidelines for Drinking-water Quality, Vol. 1, 3rd edition incorporating 1st and 2nd Addenda. ISBN 92-4 154696-4. |
|
|
WHO (2007). Guidelines for drinking water quality, Health criteria and other support information. Vol.1 (2nd ed.) World Health Organization, Geneva. |
|
|
Wynn KH (1999). Fish Community Assessment in Gore Creek, Colorado 1998. USGS Water Resource of Colorado. Fact sheet 189-199. |
|
Copyright © 2024 Author(s) retain the copyright of this article.
This article is published under the terms of the Creative Commons Attribution License 4.0


