ABSTRACT
Industrial effluents are generally discharged into receiving water bodies or disposed on land. These effluents are often used by the communities around for domestic activities like farming. Sometimes effluents gain access into wells or streams within the community. Analyses aimed to determine the strength of effluents of three different industries in Jos metropolis: industry A (a food industry), industry B (a pharmaceutical outfit) and Industry C (a water treatment plant) using parameters such as physicochemical, chemical and microbiological tests. Analyses revealed that National Environmental Standards and Regulations Enforcement Agency (NESREA) limits for pH, chloride, oil and grease, zinc, copper and sodium were met by the industries. Industries A and B passed the test for BOD5 but industry C failed. Only industry C passed the test for COD. All the industries failed the tests for sulphide, iron and lead while only Industry A failed the test for free chlorine and nitrates. The most probable number per 100 mL maximum limit was met by industry C alone. High concentrations of microbiological, chemical and physicochemical pollutants being discharged into the environment can be checked by continual monitoring and surveillance by regulatory authorities and education of communities to ensure a healthy environment.
Key words: Chemical, microbiological and physicochemical tests, industrial effluents, NESREA limits.
Industrial effluents referred to as wastewaters are dis-charges from industries. Wastewaters generally comprise of a mixture of domestic sewage (wastes from household toilets, sinks and washing machines), industrial effluents, occasional run-off of surface water and ground water infiltrated into sewers. Wastewater is estimated to be made up of greater than 95% water, with a small amount of dissolved or suspended solid matter (USEPA, 2006). Effluents describe discharge of pollutants partially or completely treated or in its natural stage into the environment.
Generally the term is used with reference to discharges into waters (Kent, 1992). Sewage may drain directly into major watersheds with minimal or no treatment. When untreated, sewage can have serious impacts on the quality of an environment and on the health of people. Pathogens can cause a variety of illnesses. Some chemicals pose risks even at very low concentrations and can remain a threat for long periods of time because of bioaccumulation in animal or human tissue (Ritter et al., 1995). Pipes and Zmuda (1997) noted that the presence of microorganisms in wastewaters makes it unsuiure for discharge to receiving water. They also noted that the absence of pathogens which can cause waterborne disease is an important measure of the effectiveness of wastewater treatment.
The quality of wastewater has been proven to be responsible for the degradation of the receiving water bodies. Parameters of concern are their physicochemical properties such as nitrates and sulphide along with BOD, COD, TSS, presence of metals etc. Eutrophication of water sources may result in the proliferation of toxin producing cyanobacteria (Akpor and Muchie, 2011). Diseases caused by bacteria, viruses and protozoa are the most common health hazards frequently reported.
Industrial pollution stands out as a major problem facing the Nigerian society. Several efforts are being put in place by regulating bodies such as the National Environmental Standards and Regulations Enforcement Agency (NESREA) in Nigeria to ensure that industries all around the country comply with the standards set up by World Health Organization (WHO). These efforts are geared towards having a disease-free environment and the improvement of health standards for the populace. Effluents generated by industries remains a major source of industrial pollution. It has been reported that contaminated air, soil and water by effluents from industries are associated with heavy disease burden and this may be a significant reason for the shorter life expectancy in the country when compared to what is obtainable in the developed world (WHO, 2002; WHO, 2003; Yusuf and Sonibare, 2004).
Sample collection
Samples were collected using different types of sterile containers depending on the nature of the test to be carried out. Sterile conical flasks and bottles were used for most tests while 250 mL glass bottles with glass stoppers were used for dissolved oxygen and biochemical oxygen demand. All samples were collected with the containers turned against the flow of the effluent.
Physical tests
The temperature, conductivity and pH of the samples were obtained using the thermometer, H12300 microprocessor conductivity meter and H183099 cod and multiparameter photometer respectively. The temperature and pH of the samples were determined at the site of collection by dipping the thermometer and the glass electrode of the pH meter into the sample collected while the conductivity was measured after the standard was used to adjust the conductivity meter and then the value of the sample read after it was placed in the cuvette. The total suspended solids (TSS) was determined using membrane filters of 0.45 µm that were dried at 103°C for one hour after which they were weighed and placed in a desiccator until they were ready for use. Samples were collected in sterile containers and mixed thoroughly by inverting the bottles several times to obtain a uniform mix. 100 mL of sample was poured into the membrane filter assembly holding the previously weighed membrane filter and attached to a suction pump and then filtered. This was repeated for all the samples. The filter papers were then dried at 103°C and re-weighed. Total suspended solids (TSS) in mg/L were determined appropriately.
Chemical tests
Dissolved oxygen (DO) was determined by using the azide method 973.45 AOAC (2000). The incubation method 973.44 AOAC (2000) was adopted for the determination of biochemical oxygen demand (BOD). The titrimetric method 973.46 AOAC (2000) was adopted for the determination of chemical oxygen demand (COD).
Determination of metal ion content
The atomic absorption spectrophotometer (AAS) (Shimadzu Jenway Spectrophotometer 6400) was used to determine the quantities of some metals present in the effluent samples. Standard stock solutions for this determination were prepared using soluble salts of the highest purity and analytical grade of individual elements. Other concentrations were prepared using distilled water. These solutions were then used to prepare calibration standards for the determination of the various cations.
Physicochemical tests
Reactive phosphorus, free chorine, chloride, nitrate, oil and grease and sulphide were all determined using Standard Methods for the Examination of Water and Wastewater 18th edition (APHA, 2012).
Determination of total plate count
Nutrient agar plates were prepared appropriately after sterilization. One mL of an appropriately diluted sample from each of the effluents was plated into the nutrient agar. One plate was left uninoculated and served as the control. Each plate was appropriately labelled and then incubated at 37°C for 24 h. After incubation, the numbers of colony forming units per mL (cfu/mL) were determined for each sample.
Determination of presumptive coliform count
At least 100 mL samples were collected in sterile containers. Sample containers were not filled completely. An air space of at least one-fourth of the total volume was maintained. Samples that were not immediately analysed were stored on ice and analysed within six hours. Sterile sample containers were filled below the surface of water using a sweeping motion with the open end of the container in the direction of the sweep. Five 10 mL double strength (DS) and ten 5 ml single strength (SS) MacConkey broth were prepared in tubes according to manufacturer’s specifications for each sample. Each tube had an inverted Durham tube. Ten mL of the sample was added into the DS medium while 1 ml and 0.1 mL were added into five SS broth each. These were then incubated at 37°C and observed after 24 ± 2 h. Tubes that produced gas and acid as indicated by a change of colour from purple to yellow were recorded as positive.
Physical properties
The industries investigated had effluents with pH values within the range of 6-9 specified by NESREA (Table 1). The details of the physical properties of effluent samples
from the various industries are shown in Table 2.
Chemical properties
The chemical properties of all the industries were generally within the acceptable limits set by NESREA (Table 1) although the standards for total suspended solids were exceeded by all the industries. The summary of the results of the chemical properties are shown in Table 3.
.png)
.png)
.png)
Physicochemical properties and elemental analysis
The physicochemical properties of the industries evaluated were also generally found to be within limits although they failed in some of the parameters. Most of the elements evaluated were found to be present in the industries except for industry C in which sodium was not detected. The details of these physicochemical properties and the elemental analysis are shown in Table 4.
Microbiological properties
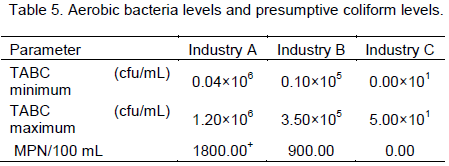
The microbiological results of total aerobic bacteria count and presumptive coliform counts are shown in Table 5. The values ranged from 0.00 to 1.20×10⁶ cfu/mL for total aerobic bacterial count and 0.00 to 1800.00+ for the presumptive count.
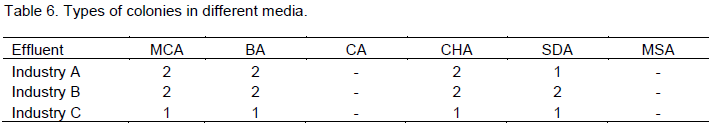
Table 6 indicates that the industries had one or more microorganisms present in all the agar plates used except in cetrimide agar and mannitol salt agar.
MCA, Maconkey agar; BA, blood agar; CA, cetrimide agar; CHA, chocolate agar; SDA, Sabouraud dextrose agar; MSA, mannitol salt agar.
TABC, Total aerobic bacterial count; cfu/mL, colony forming units per milliliter (aerobic bacterial count); MPN/100 mL, most probable number of coliforms in 100 mL (presumptive coliform levels); minimum - minimum value obtained during sampling; maximum - maximum value obtained during sampling.
With regards to the strength of the effluents, it was observed that the effluents met certain standards but failed in others. Chemical oxygen demand was noted to be less than the maximum permissible limits for industry C but industry A had higher levels which implied that the effluents being discharged into the environment had chemical properties that would have minimal effect on the oxygen level of the environment into which they are being discharged in the case of Industry C. These chemical properties are majorly that of organic matter that can be oxidized by the oxidizing agent utilized (Sharma, 2004). The DO levels were also observed to be low which indicates that oxidation may have been used during the treatment process or living organisms are present in the effluent which led to the decline of the dissolved oxygen levels (USEPA, 2012). The BOD5 of the effluents which were derived from the DO values were below the permissible limits for Industry A and B but higher for industry C. These results reveal that the organic matter in the effluents of industries A and B had minimal demand for oxygen. It also signified that bacteria could thrive within the effluents because aerobic bacteria must take up energy from the process of decomposing organic matter in the presence of oxygen (Sharma, 2004). The BOD5 value (Table 3) also showed that when the results were compared with the official limits, the pollution potential of each of these effluents was not very high (Dara, 2004).
The TSS values of the effluents were above the maximum permissible limits for the three industries evaluated. TSS serves as an indicator of the turbidity of the waste water. These high values revealed that the treatment of these wastewaters did not effectively take care of these suspended solids. High concentrations of suspended solids may settle out onto a streambed or lake bottom and cover aquatic organisms, eggs, or macro-invertebrate larva. This coating can prevent sufficient oxygen transfer and result in the death of buried organisms. Many organic and inorganic pollutants sorb (take up and hold by either adsorption or absorption) to soils, so that the pollutant concentrations on the solids are high. Thus, sorbed pollutants (and solids) can be transported elsewhere in river and lake systems, resulting in the exposure of organisms to pollutants away from the point source (Whitman, 2014).
The results obtained agree with that of Kanu et al. (2011) and Kumara et al. (2010) who also reported high levels of BOD, COD and TSS being discharged into receiving waters. Kumara et al. (2010) also reported low levels of DO which agrees with what was observed in this evaluation. The microbiological state was assessed using the presumptive coliform count (MPN/100 mL) and total aerobic bacterial count (cfu/mL) which revealed excessive levels of microbial contamination. These microbial contaminants were also observed to be varied in nature indicating the presence of more than one type of organism. Since most of the tests done pointed towards the presence of Enterobacteriaceae family, it is important to state that these effluents can be a source of infection to the communities into which they are channeled where they may seep into water bodies like streams and wells or where residents collect such waters and use them for laundry and irrigation farming (Akpor and Muchie, 2011; Adewoye et al., 2010).
The elemental and physicochemical properties of the effluents evaluated showed the presence of excessive free chlorine and nitrate in one of the samples- Industry A- which poses a source of concern. One of the disadvantages of water chlorination process is the disinfection by-products formation, the most prominent of which are trihalomethanes (?H?): chloroform, dichloro-brommethane, dibromochlormethane and bromoform. The trihalomethanes are formed from variety of organic precursors in chlorination-disinfection process. The THM formation reactions are some of the slowest reactions. The THM formation occurs over several hours, and the amount increases after 24 h. The kinetics of THM formation depends on many factors such as pH and residual chlorine concentration. Therefore, the application of sodium or calcium hypochlorite for water disinfection as alternative to molecular chlorine does not reduce but considerably increases probability of THM formation. The most rational way for reduction of chlorination by-products formation is the reduction of precursor’s concentration prior to disinfection stage (Bakhir, 2014). THM are environmental pollutants and many are considered to be carcinogenic. Nitrates play a major role in the promotion of growth of aquatic plants and algae. Nitrates may also cause methemoglobinemia if ingested from vegetables or contaminated water (Addiscott and Benjamin, 2004). The sulphide level was observed to have exceeded the maximum permissible limits in all the effluents analysed. Sulphides are known to have similar poisonous effect when inhaled which are similar to that of cynanide and carbon monoxide which prevent the taking up of oxygen (Simonton and Spears, 2007). Oil and grease (OG) levels were exceeded by Industry C. OG in water can cause surface films and shoreline deposits leading to environmental degradation, and can induce human health risks when discharged in surface or ground waters. Additionally, OG may interfere with aerobic and anaerobic biological processes (Pisal, 2009). The elemental analysis revealed that only lead and iron exceeded their maximum limits. This result does not agree with that of Ghafoor et al. (1994) who noted that levels of iron, and lead were well below the maximum limits but agrees with the low levels of copper and zinc observed in this evaluation. Such differences may have occurred as a result of the treatment method used by the industries or the nature of their effluents since they produced different products. Persons with blood lead level below 5 µg/dL can lead to decreased academic achievement, decreased IQ, and decreases in specific cognitive measures, increased incidence of attention-related behaviours and problem behaviours in children and decreased kidney function. Maternal blood lead is associated with reduced fetal growth in adults while blood lead levels below 10 µg/dL can bring about delayed puberty, reduced postnatal growth, decreased IQ and decreased hearing in children and increased blood pressure, increased risk of hypertension, and increased incidence of essential tremor in adults. Chronic lead exposure in adults can result in increased blood pressure, decreased fertility, cataracts, nerve disorders, muscle and joint pain and memory or concentration problems. Children under the age of six years old are at an increased risk for lead exposure, due to their rapid rate of growth and their tendency to place toys and other objects in their mouths that could contain lead or leaded dust. This is particularly true of children living below the poverty line in older housing (Cohen et al., 1981). Iron typically damages cells in the heart, liver and elsewhere, which can cause significant adverse effects, including coma, metabolic acidosis, shock, liver failure, coagulopathy, adult respiratory distress syndrome, long-term organ damage, and even death (Cheney et al., 1995). Humans experience iron toxicity above 20 milligrams of iron for every kilogram of mass, and 60 milligrams per kilogram is considered a lethal dose (Spanierman, 2013).
In terms of compliance to standards, it was observed that though some of the industries met up with the required standards for some of the parameters such as BOD, COD and pH, they all failed in meeting others such as sulphide, iron and lead. These findings are pointers to the fact that environmental protection agencies need to improve on their monitoring and evaluation strategies and enforce compliance to the already laid down standards.
Such adherence will result in the protection of the environment and enhance the living conditions of humans, animals and plants within such communities.
With these in mind, communities must rise up to take charge of their environment rather than await government alone to do this. Advocacy cries should be raised by promoting health education which would encompass health promotion and disease prevention to improve the health of the populace through the improvement of their environment.
The discharge of wastewater or industrial effluents into the receiving environment invariably results in high concentrations of microbiological, chemical and physico-chemical pollutants. This was observed with the presence of high numbers of most probable number per 100 mL in Industry A and B, high COD and BOD levels found in Industry A, and high levels of TSS, sulphide, iron and lead observed in all the industries. These pollutants also have negative impact on these environments where they may harm crops, animals and humans in various ways. It is therefore recommended that industries should take it up as a responsibility to ensure they do not dispose their wastes indiscriminately that is without adequate treatment. Regulatory bodies should also ensure that standards are adhered to by continual monitoring and surveillance. More so communities should take their health in their hands and ensure healthy environments.
The authors did not declare any conflict of interest.
REFERENCES
Addiscott TM, Benjamin N (2004). Nitrate and human health. Soil Use and Manage. 20(2):98-104.
Crossref |
|
|
|
Adewoye AO, Okunade DA and Adekalu KO (2010). Assessing the Yields and Nutrient Uptake of Okra Abelmoschus Esculentu Using Diluted Stabilized Wastewater for Irrigation in South-Western Nigeria. J. Waste Water Treatment Analysis.1:104. |
|
|
|
Akpor OB, Muchie M (2011). Environmental and public health implications of wastewater quality. Afr. J. Biotechnol. 10(13):2379-2387. |
|
|
|
APHA (American Public Health Association) (1992). Standard Methods for the Examination of Water and Wastewater. In: Franson, 22nd edition. Washington, USA. |
|
|
|
Association of Analytical Chemists (AOAC) (2000) Official methods of analysis. |
|
|
|
Bakhir VM (2014). Disinfection of drinking water: problems and solutions. |
|
|
Cheney K, Gumbiner C, Benson B, Tenenbein M (1995). Survival after a severe iron poisoning treated with intermittent infusions of deferoxamine. J. Toxicol. Clin. Toxicol. 33(1):61-66.
Crossref |
|
|
|
Cohen AR, Trotzky MS, Pincus D (1981). Reassessment of the Microcytic Anemia of Lead Poisoning. Pediatrics. 67 (6): 904–906. |
|
|
|
Dara SS (1984). Textbook on Experiments and Calculations. In: Engineering Chemistry. Pp 45-50. |
|
|
|
Ghafoor A, Raur A, Arif M, Muzaffar W (1994). Chemical Composition of Effluents from Different Industries of the Faisalabad City Pakistan. J. Agric. Sci. 31(4):367-370. |
|
|
|
Kanu I, Jeoma P and Achi OK (2011). Industrial effluents and their impact on water quality of receiving rivers in Nigeria. J. Appl. Technol. Environ. Sanit., 1 (1):75-86. |
|
|
Kent JA (1992). Riegel's handbook of Industrial Chemistry, Ninth edition, Edited by J.A. Kent.
Crossref |
|
|
|
Kumara P, Kumar S, Agarwal A (2010). Impact of industrial effluents on water quality of Behgul River at Bareilly. Adv. Biores. 1(2):127-130. |
|
|
|
Pipes WO and Zmuda JT (1997). Assessing the efficiency of wastewater treatment. In: C.J. Hurst, G.R. Knudsen, M.J. McInerney, L.D. Stetzenbach, M.V. Walter (eds), Manual of environmental microbiology. Washington, D.C.: ASM Press, pp. 231-242. |
|
|
|
Pisal A (2009). Determination of Oil and Grease in Water with a Mid-Infrared Spectrometer. Available at: |
|
|
|
Sharma BK (2004). Sewage and sewage treatment. In: Industrial Chemistry including Chemical Engineering, 14th edition, 161-165. |
|
|
|
Simonton S, Spears M (2007). Human Health Effects from Exposure to Low-Level Concentrations of Hydrogen Sulfide in OHS (Occupational Health and Safety). |
|
|
|
Spanierman, CS (2013) Iron Toxicity. Drugs and Diseases. Medscape WebMD. |
|
|
|
USEPA (2006). United States Environmental Protection Agency "Terms of Environment Beginning With "E"". Assessed June 9, 2010. |
|
|
|
USEPA (2012) United States Environmental Protection Agency. Water: Monitoring and Assesment. 5.2 Dissolved Oxygen and Biochemical Oxygen Demand. |
|
|
|
Whitman (2014) Total Suspended Solids in water samples by Whitman College. |
|
|
|
WHO (2002). Water pollutants: Biological agents, Dissolved Chemicals, Non-dissolved Chemicals, Sediments, Heat, WHO CEHA, Amman, Jordan. |
|
|
|
WHO (2003). The World Health Report 2003: Shaping the Future, World Health Organisation, 1211 Geneva 27, Switzerland. |
|
|
|
Yusuf RO, Sonibare JA (2004). Characterization of Textile Industries' effluents in Kaduna, Nigeria and Pollution implications. In: Global Nest: the International, pp. 212-221. |

.png)
.png)
.png)
.png)