African Journal of
Environmental Science and Technology

  • Abbreviation: Afr. J. Environ. Sci. Technol.
  • Language: English
  • ISSN: 1996-0786
  • DOI: 10.5897/AJEST
  • Start Year: 2007
  • Published Articles: 1129

Full Length Research Paper

Projected climate risks for rice crops in Casamance, Southern Senegal

Samo DIATTA
  • Samo DIATTA
  • Laboratoire d’Océanographie des Sciences de l’Environnement et du Climat, Department of Physics, Assane Seck University of Ziguinchor, Senegal.
  • Google Scholar
Adama THIANDOUM
  • Adama THIANDOUM
  • Laboratoire d’Océanographie des Sciences de l’Environnement et du Climat, Department of Physics, Assane Seck University of Ziguinchor, Senegal.
  • Google Scholar
Mamadou Lamine MBAYE
  • Mamadou Lamine MBAYE
  • Laboratoire d’Océanographie des Sciences de l’Environnement et du Climat, Department of Physics, Assane Seck University of Ziguinchor, Senegal.
  • Google Scholar
Alioune Badara SARR
  • Alioune Badara SARR
  • Laboratoire d’Océanographie des Sciences de l’Environnement et du Climat, Department of Physics, Assane Seck University of Ziguinchor, Senegal.
  • Google Scholar
Moctar CAMARA
  • Moctar CAMARA
  • Laboratoire d’Océanographie des Sciences de l’Environnement et du Climat, Department of Physics, Assane Seck University of Ziguinchor, Senegal.
  • Google Scholar


  •  Received: 04 December 2020
  •  Accepted: 03 February 2021
  •  Published: 28 February 2021

 ABSTRACT

The climate risk concept is crucial for agricultural production in vulnerable regions. In this work the climate conditions that influence the climate risk for rice crop in Casamance are presented. The future occurrence of drought and extreme precipitation conditions in the most critical phases of the rice plant evolution has been evaluated. Regional climate models (RCMs) outputs projections from CORDEX under two scenarios emissions (RCP4.5 and RCP8.5) in the mid of the twenty-first century were used to highlight the change in four extreme climate indices in the germination (JJ) and the flowering (Oct) stages of the rice plant in the Casamance region. The results suggest a potential risk in rice crop yield losses in the germination phase due to persistent drought conditions in the mid-twenty-first century namely in the low Casamance and the Middle Casamance; also increasing future occurrence of heavy rainfall may cause juvenile rice plant submersion that could contribute to rice production reduction. The flowering stage will present less climate risk situation in the future; the distribution of drought conditions seems to follow the normal north-south distribution; however hazardous extreme conditions could be expected in the future. There is a need to better plan agronomic and water management policies.
 
Key words: Regional climate model, future projection, extreme precipitation, climate risk, rice crop, Casamance.


 INTRODUCTION

The West African Sub-Saharan is a region where populations are still confronted with high climate variability, and is particularly vulnerable to climate change due to a combination of climate variability, high reliance on rain-fed agriculture and limited economic and institutional capacity to cope with and to adapt to climate variability and change (Sultan and Gaetani, 2016; Challinor et al., 2007; Müller et al., 2010; Roudier et al., 2011). Extreme weather events are increasing and their intensity also tends to increase, along with the social and economic impacts and many parts of West Africa (Niger, Burkina Faso, Guinea, Mauritania, Mali, northern Nigeria, Senegal and Sierra Leone) have already felt and will continue to feel the effects of extreme weather events (Busby et al., 2014). The populations that live in these regions are vulnerable to enormous risk from flooding, soil erosion, desertification, droughts, and crop failure (Odoulami and Akinsanola, 2017; Sylla et al., 2016; Panthou et al., 2014). Several factors contribute to increasing the vulnerability of African populations (economic and social context, governance, resource management, etc.), and sectors that are essential for development as agriculture, water resources, and health are the first to be exposed to the effects of these changes. To face these situations, West African countries have adopted several agricultural policies and the most relevant are the Regional Agricultural Policy for West Africa in 2005 (Aboudou et al., 2015), the West African Agricultural Productivity Program in 2007 (Aboudou et al., 2015; ECOWAS,2017), and more recently the West African Alliance for Climate Smart Agriculture in 2015 (ECOWAS, 2017). These policies have been implemented to increase crop productivity, and to assess the relationship between climate change, land-use and crop growth.
 
Since the beginning of the 1970s, the Casamance region as most of west African countries (Janicot et al., 1996; Giannini et al., 2003; Rodriguez-Fonseca et al., 2009) has undergone strong climatic variabilities with often disastrous environmental and socio-economic consequences. For example, rice production systems of the region have become increasingly threatened by a decrease in precipitation, rise in temperature, prolonged droughts and soil degradation due to salinization, acidification and silting up (Sane et al., 2010; Fiorollo et al., 2020) causing a decline in lowland cultivation and productions. Mendez del Villar (2019) estimated that in Casamance, local rice production covers only between 30 and 40% of household consumption whereas in the 1950s, local rice covered totally the household consumption. As agriculture in the Casamance region is mainly dependent on rainfall which remains the most variable parameter both in monthly or year to year variability and also from spatial variability; the primary cause of crop success or failure is therefore rainfall variability. The relationship between climate and agriculture is obvious. Bacci (2017) has quantified the trends of climate risk for rice crop in the Casamance region by using the return period of extremes like droughts or wet conditions during the vulnerable phases of the rice crop. Given the climatic disturbances experienced in this area, efforts to mitigate the impacts of climate change will involve reducing vulnerability in this area by taking into account future climate change emission scenarios.
 
The objective of this study is to evaluate the future potential risks of climate change on rice crops in the Casamance region, using selected climate extreme indices derived from regional climate models (RCMs) of CORDEX. Two types of greenhouse gas emission scenarios (RCP4.5 and RCP8.5.) have been taken into account and change in medium-term in Casamance is evaluated. The paper is organized as follows, a description of the study area, the data and methodology used are described in data and methods. The results section is dedicated to the analysis and interpretation of the results. Summary and Conclusions are reserved for the last part of the paper.


 MATERIALS AND METHODS
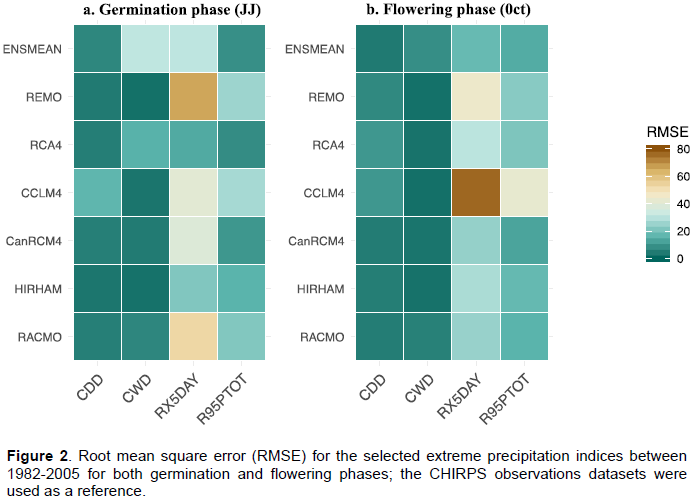
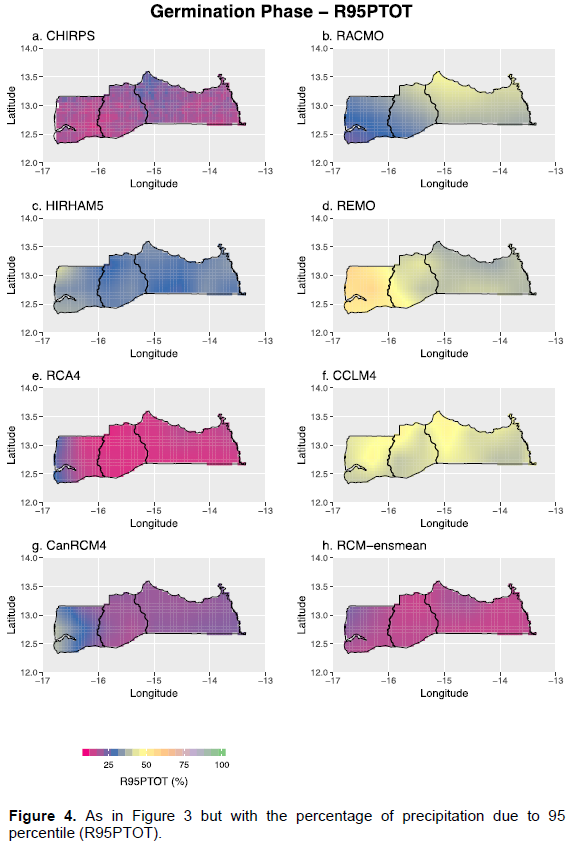
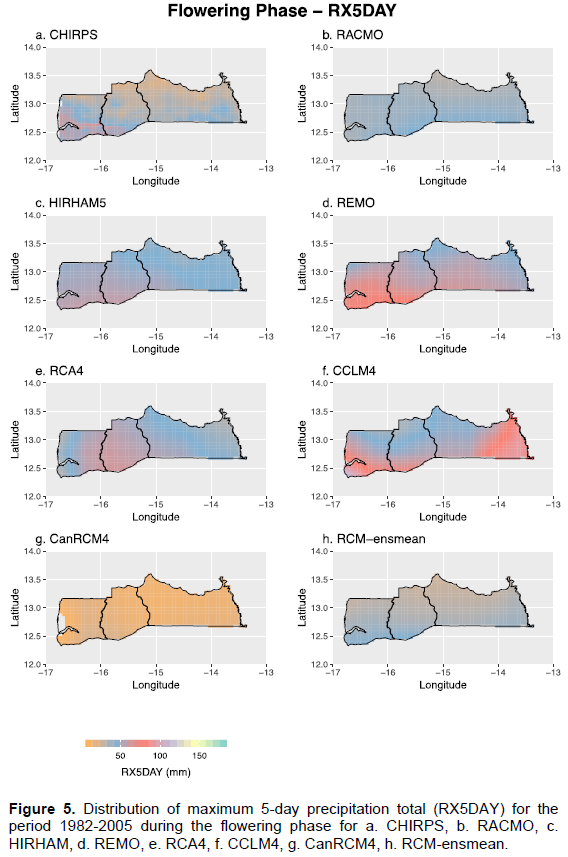
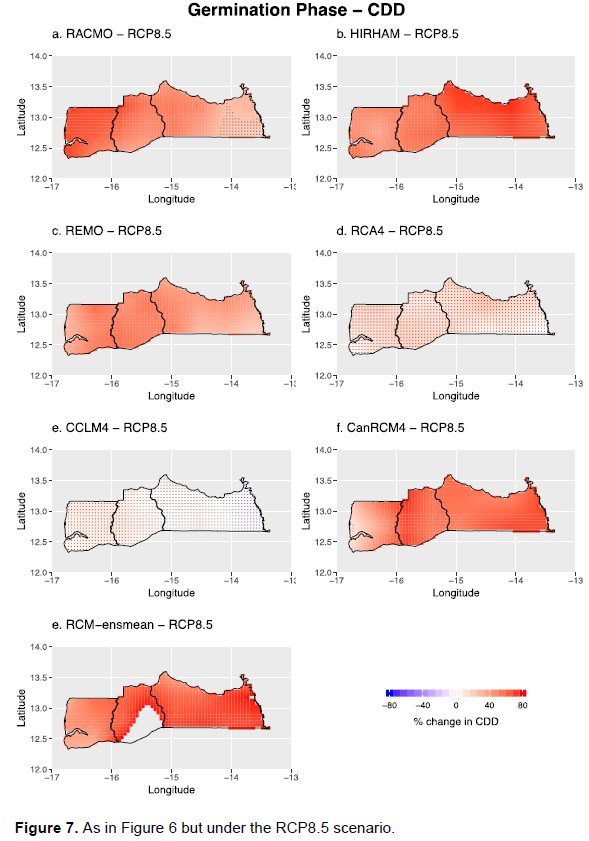
Site description
 
Senegal is a country in Western Sahel bordered by the North Atlantic Ocean; it goes from 12°30N and 16°30N in latitude and from 11°30W and 17°30W in longitude. The Casamance region is located to the south of Senegal (Figure 1) and has experienced the highest rainfall amounts and then is the wettest region in Senegal (Thiam and Singh, 1997; Ndong, 1995; Sané et al., 2008). The Casamance region (Portuguese: Casamansa) is a historic and natural region that bordered the Casamance River. It stretches from east to west, on either side of the river that gave it its name. It is bounded to the west by the Atlantic Ocean, to the east by the Koulountou (a tributary of the Gambia River), the north by the Republic of Gambia, the south by the Republic of Guinea Bissau, and the south-east by the Republic of Guinea (Sané et al., 2010). The Casamance region is divided into three distinct geographical areas: the lower Casamance (LC) in the west, the mid-Casamance (MC), and the upper Casamance (UC) in the east. The LC is the wettest and is characterized by two distinct plant formations: the forest with tall and powerful species on the plateau and the mangrove on the bank of the Casamance River and backwater. The MC is located between the LC and the UC and is quite humid with a semi-dry forest limited only to the edges of rivers. The UC, current administrative region of Kolda, receives lesser water than the LC and the MC and is characterized by open forests pierced by grassy expanses (Sané et al., 2008, 2010).
 
 
The Casamance region has a Sudano-Guinean tropical climate and is often hot and humid with an average annual temperature of 27°C. Temperatures are always quite high during the day and drop rarely below 20°C at night; the months of December and January are the coolest. The climate is characterized by an alternation between a dry season from November to May and a wet season which lasts almost five months, from June to October. The contributions of May and November are almost negligible in the annual average total which is defined by rainfall greater than 1000 mm in the region (Thiam and Singh, 1997, 2002; Malou, 1992). With a flat and low relief overall, the Casamance has a diverse range of soils and a dense hydrographic network suitable for rice production namely in the LC and MC (Fiorillo et al., 2020). In general, there are tropical ferruginous and sandy or clayey-sandy soils on plateaus and terraces,   mainly used for rainfed crops (peanuts, cowpeas, rice cultivation); slope soil characterized by good suitability for arboriculture and market gardening; hydro-morphic soils conducive to the development of off-season crops and rice growing, and finally acidified or salty soils (tannes), unsuitable for agriculture generally located on the lower parts of the Casamance River (Sané et al., 2010; CSE, 2011). These rich and varied soils, on the whole, are nested in a landscape of plateaus that descend towards the coast dotted by an increasingly dense hydrographic network of alluvial valleys and permanent backwaters (Sané et al., 2010).
 
Observations
 
Observation products used to evaluate the models' skill in depicting extreme rainfall indices are from the Climate Hazards Group InfraRed Precipitation with Stations data (CHIRPS). The CHIRPS consists of a combination of daily gauge-calibrated and infrared precipitation estimates (Funk et al., 2015). It is widely used for the extreme precipitation calculation in West Africa (Diatta et al., 2020a; Athia et al., 2020 and references therein). The dataset used in this study spans from 1982 to 2016 with a resolution of 0.05° × 0.05 and is only available over land. The CHIRPS data have shown remarkable performance and are suitable for drought monitoring, rainfall variability, and extreme analysis. A general agreement between CHIRPS and other observational data was reached by Maidment et al. (2015) and Bichet and Diedhiou (2018a) on annual trends over Africa. Bichet and Diedhiou (2018b) have also found a very similar statistical distribution for mean precipitation in AMJ and SON seasons between CHIRPS and rain gauge observations from the BAse de DOnnees PLUviometrique (BADOPLU) database; and a comparison of a corresponding time-series between the 2 datasets indicates that the distribution and to  some  extent  the temporal variability agree in both seasons showing a better fit for mean precipitation and number of wet days. They agree on the good confidence of the use of CHIRPS data in this region.
 
Models
 
Dynamically downscaled daily rainfall from six RCMs simulations from the Coordinated Regional Climate Downscaling Experiment (CORDEX, http://www.cordex.org) project has been used in this study, in addition to their ensemble mean (Ensmean) defined here as the average of the RCMs. The CORDEX project is a world climate research program (WCRP) initiative for the assessment and comparison of RCM skills in diverse regions, particularly CORDEX-Africa, a set of state-of-art simulations and projections for the West African climate at high resolution as stated in Nikulin et al. (2012). Table 1 shows the characteristics of the RCM models with the institutions that maintain the RCMs with the corresponding forcing General Circulation Models (GCMs). The projections are forced by the Representative Concentration Pathways (RCPs) as described in Moss et al. (2010) and van Vuuren et al. (2011). They represent the prescribed greenhouse-gas concentration pathways throughout the twenty-first century and correspond to different radiative forcing stabilization levels by 2100. Two RCPs have been used in this study: the RCP4.5 and the RCP8.5 that respectively represent mid- and high- level emission scenarios. In this study, we selected four extreme indices (Table 2) derived from the indices used by Expert Team on Climate Change Detection and Indices (ETCCDI). The ETCCDI indices were widely used and provided a good mixture of daily statistics to assess changes in temperature and precipitation regimes in terms of duration, intensity and occurrence (Frich et al., 2002; Zhang et al., 2011; Sillman et al., 2013; Diatta et al., 2020a). Complementary information regarding the extreme indices can be found on the ETCCDI8.5website, http://etccdi.pacificclimate.org/list_27_indices.shtml. The most critical periods for rice plant are during the germination (June-July) and flowering (October) stages (Bacci, 2017). These periods are the most vulnerable periods of rice crop to rainfall anomalies. Therefore, all the selected indices are calculated for the two periods: June-July and October for both historical and future scenario simulations. The CHIRPS resolution is sufficient to describe dynamics of rainfall in the Casamance region and to describe also phenomena over the entire domain and help to produce risk maps at very local levels. Therefore, the outputs from models have been regridded to the CHIRPS’ resolution using the bilinear interpolation method and then facilitate convenience comparisons. Indeed, the regridding of the model’s outputs do not qualitatively alter much the raw data as the data in the raw grid are splited and even some additional information is added.  The model evaluation analysis is carried out by considering a common period across observations and simulations (1982-2005) and both germination and flowering periods have been investigated, as the CHIRPS dataset is only available from 1982 to present and the historical outputs of models span from 1976 to 2005. The root mean square error (RMSE) is used to assess the models’ performance in depicting extreme precipitation indices during the germination and the flowering phases of the rice crops.  The analysis of projected risk for rice crops is focused on the mid-twenty-first century (2038-2067) relative to the 30-year historical period (1976-2005) under the rcp4.5 and rcp8.5 projection scenarios. The percentage of change (%C) of selected extreme precipitation indices is then calculated for both the germination and the flowering phases using the following formula:
 
 
and the statistical significance of the change is evaluated using a student t-test.


 RESULTS

Evaluation of simulated extreme precipitation indices during the vulnerable phases of rice crops
 
Figure 2 presents the performance of each selected index relative to the CHIRPS observations in the Casamance region using the root mean square error (RMSE). For the CDD index, the models show a relatively low RMSE value and namely for ENSMEAN suggesting a reduction in systematic errors that are seen in almost all individual RCM members. Simulations exhibit large errors for RX5DAY namely with REMO, RACMO, CCLM4, and CanRCM4 in the germination phase, while CCLM4 and REMO show the highest RMSE values during the flowering period (Figure 2b). Except for CCLM4 during the flowering phase, the R95PTOT seems to be simulated with lower uncertainties by the models. A very similar pattern is observed when using the mean absolute error (MAE) as a performance metric for the RCMs; the same large errors are exhibited but the same indices with the same models (Figure 1 in supplement material) Figure 3 presents the spatial distribution of the consecutive dry days (CDD) over the Casamance region for CHIRPS and the models including the Ensmean in the germination phase. The maximum of the CDD is located in the western part of Casamance in the LC in the CHIRPS dataset, while the lowest is observed in the MC and UC. The models except for the CCLM4 realistically reproduce the distribution of CDD in Casamance but the CanRCM4 slightly overestimates it in the western part, whereas the Ensmean does show a little underestimation of the CDD. The CCLM4 overestimates the CDD in all the Casamance region.


The spatial distribution of R95PTOT is presented in Figure 4. CHIRPS observations show values lesser than 25% of R95PTOT in almost all the Casamance region with a little increase (higher than 25%) in the north of UC (Figure 4a). The models show various skills in reproducing the R95PTOT.  RACMO,  HIRHAM,  REMO, and CCLM4 overestimate the R95PTOT over the Casamance region but with different behavior, for example, RACMO presents the highest values in the UC (around 50%) and the lowest in the LC (around 25%) as seen in Figure 4b. The HIRHAM presents almost the same range value of R95PTOT in all Casamance region (Figure 4c), and the same pattern is also observed with REMO and CCLM4 but the signal is more intense (Figure 4d-f). The RCA4, the CanRCM4, and the Ensmean show a realistic reproduction of the distribution of the R95PTOT; however, the CanRCM4 presents a little overestimation of R95PTOT in the western part of the LC (Figure 4g) and the RCA4 in the MC and UC. Diatta et al. (2020b) have shown a relatively good performance of RCA4 in simulating the R95PTOT in the Casamance River Basin. The ensemble mean of the models gives the best representation of the R95PTOT in the Casamance region.
 
The evaluation of extreme precipitation in the flowering phase is emphasized by using the maximum 5-day precipitation total (RX5day). The CHIRPS observations locate the maximum of the RX5day in the south-east of UC; whereas the minimum is observed in the north of all the Casamance region. The RCMs show different behavior   in   representing   the   RX5day;   four   models overestimate the RX5day in the all Casamance even if few of them do capture the signal of the maximum RX5day in the LC (Figure 5c-f). The CanRCM4 underestimates the RX5day in all Casamance region; the RACMO and the Ensmean seem to capture well the pattern of the RX5day minimum located in the northern part of Casamance. However, they fail to represent the maximum observed in the south of the LC.  A similar pattern is observed when considering the CDD’s distribution in the flowering phase (Figure 2S in supplement materials), also four overestimate the CDD in all Casamance region, even if the HIRHAM shows a closer   pattern to   observation.  The RACMO and  the Ensmean (Figure 2S.b, h) reasonably simulate the CDD distribution but they slightly underestimate it namely in the MC. We should note also that a similar pattern is also observed with the R95PTOT in the flowering phase (Figure 3S in   supplement  materials).  The  CWD distribution is overestimated by the Ensmean and the other models except the CCLM4 that seems to reasonably simulate the CWD in the Casamance region (Figure 4S in supplement materials).


The overall pattern of these indices is reasonably well represented in the simulations namely in the ensemble mean of the models. The magnitude varies consistently precipitation and the R95PTOT. These validation results are similar to Akinsanola and Zhou (2008) who validated among the models especially with the maximum 5 day two RCMs simulations in the West Africa with two observation datasets. 
 
Projected change in rice crops during the vulnerable phases
 
In this section, the projected changes in selected extreme indices for the mid of the twenty-first century (2038-2067) during the most vulnerable stages (germination and flowering phases) of the rice crops are presented. The changes are analyzed under the RCP4.5 and the RCP.8.5 emissions scenarios and their significances are tested with a t-test.
 
Germination phase
 
The first critical stage for rice plant development is the germination phase. A prolonged dry condition is critical for rice plants as the roots are weakly developed and are not able to absorb moisture in the deepest ground; and heavy rains can cause prolonged submersion of small plants and soil erosion phenomena (Bacci, 2017). The spatial distribution of the projected future change in CDD during the germination phase over Casamance under the RCP4.5 and RCP8.5 is presented respectively in Figures 6 and 7. All the models except the CCLM4 and to a lesser extent the RCA4 do show an increase of the CDD during the germination phase over the entire Casamance region (Figure 6). The change is significant in all the Casamance region with the RACMO simulations (Figure 6a) with the longer dry spells located in the MC; the  REMO and the Ensmean do show significant increase changes in the LC and a high percentage of change in the UC that are not significant (Figure 6c and e). Contrary to the previous models, the CanRCM4 exhibits an increasing significant change in the middle of the UC but the maximum of the change that is not significant is located in the border of the LC and MC (Figure 6f). Significant decreasing changes of the CDD are depicted by the CCLM4 and the RCA which shows also a low increase in the MC. On average, under the RCP4.5 scenario in the germination phase, an increasing change in the CDD is observed in the Casamance region that is significant in some specific regions. A similar pattern is observed when considering the RCP8.5 scenario (Figure 7); all the models do show a positive percentage of change in CDD that is higher than the RCP4.5 scenario. However, the increasing positive change is not significant except for the RCA4 and the CCLM4 models (Figure 7d-e). We should note that CCLM4 presents a low positive percentage of change in the LC and MC and no change in the UC.  The projected changes in the R95PTOT over   the Casamance region during the germination phase have been also investigated under both the RCP4.5 and the RCP8.5 scenarios (in supplement materials, Figures 5S and 6S). All the models exhibit an increasing percentage of change in the R95PTOT index (see in supplement materials, Figure 5S), suggesting the possibility of having more heavy precipitations in the future that could lay to flooding and submersion of juvenile rice plants. These changes are significant in the UC as observed in almost all the models, whereas in the LC the significance of the changes is depicted in the CCLM4 and the Ensmean (Figsures 5S.e-g), and in the south-west of the LC in the RCA4 and CanRCM4 models (Figure 5S.d-f). Under the RCP8.5 scenario, the changes are also positive and more intense than the previous scenario (Figure 6S), namely in the MC. However, the changes in the R95PTOT are not significant except in a few areas depicted in the CCLM4 and RACMO simulations (Figures 6S.a-e).
 
Similar results have been highlighted by Akinsanola and Zhou (2018) in the summer monsoon period. They found an increasing change in the CDD and the R95PTOT in the western Sahel including our study region. The larger magnitude of the change obtained under the RCP8.5 scenario is consistent with Sun et al. (2016)’s findings; they reported that the magnitude of the index change was generally larger for higher emission scenarios. Our results point out the potential risk for rice crop yield loss in the future in the Casamance region especially in the LC and the MC; all the conditions that contribute to the vulnerability of the rice plant are met. Our findings are in line with the results of Bacci (2017). He has shown using extreme return periods that significant likelihood of a long series of CDD may occur in the Casamance region. He pointed out also that the maximum number of consecutive dry days per year in the region during the germination phase is expected to be from 6 to 10 but may be almost double with a 5% probability of record. Bacci (2017) projects also a return period of the maximum daily amount of rain in the month of July that can reach over 80 mm/day in 1 year every 20 in the MC and UC.


Flowering phase
 
The other vulnerable stage of the rice crop is the flowering phase that normally occurs in October in the Casamance region (Bacci, 2017). As in this stage, the rice plant needs to receive a sufficient amount of rain, and the projected changes in the RX5DAY in the mid-twenty-first century are then analyzed. Figure 8 presents the spatial distribution of the projected future change in the RX5DAY during the flowering stage over Casamance under the RCP4.5. The models show different behaviors in simulating future RX5DAY patterns. The REMO and the CCLM4 models simulate a significant increasing RX5DAY in the future in the LC and some parts of the MC, whereas a significant decrease is observed in the UC (Figures 8.c-e). The RACMO model shows a similar decrease in the RX5DAY in all Casamance region except in the south of LC. An opposite behavior is observed when considering the HIRHAM model, a significant negative (positive) percentage of change is depicted in the LC and the MC and the western part of the UC (The eastern part of the UC) as seen in Figure 8b.  The RAC4 and the CanRCM4 projections exhibit a significant increase of the RX5DAY in the future in all Casamance region (Figure 8.d-f) even if a low to nil decrease is observed in the eastern LC with the CanRCM4. The ensemble average of the models shows the same dipole as seen earlier with a significant increase (decrease) of RX5DAY in the LC and the MC (the LC) as presented in Figure 8g. However, the intensity of the changes is much lower than for the models individually taken.  Under the RCP8.5 scenario, some models show similar patterns in the RX5DAY projection changes as under the RCP4.5 scenario and others present quite different patterns (Figure   9).  The RACMO model simulates the   same significant decreasing projection change in the UC, but in the MC and the LC, it prevents an intense increasing RX5DAY in the  future  that  is  seen  under  the  RCP4.5 (Figure 9a). Both the HIRHAM, REMO, and RCA4 exhibit opposite patterns as previously (Figure 9b-c-d); the changes are significant and the intensities seem to be in the range. Similar behaviors as under the RCP4.5 are simulated by the CCLM4, CanRCM4, and RCMs ensemble mean. The signal changes in the CCLM4 and the CanRCM4 are more intense under the RCP8.5 as seen in Figure 9.e-f. The ensemble mean of the models exhibits a lower intensity of change and is significant in almost all the Casamance region (Figure 9g). So, the averaged model predicts less maximum 5-day precipitation total in the future in the UC that could lay to risk conditions on the rice yield loss; while in the MC and LC the risk is very low and non-existence in the northern part. Drought stress in this phase could also generate yield loss. The projected spatial distributions in the CDD in the flowering phase are also evaluated (not shown, see Figure 7S. in supplement materials). It appears that the change in the CDD is decreasing under the RCP4.5 in the Ensmean but the decrease change is not significant. The models individually taken show low negative change that is significant except for the RACMO in the northern UC. Under the RCP8.5 scenario, the Ensmean and four other models depict a decrease change in the CDD in the LC (Figure 8S, in supplement materials).


Our findings suggest that the risk of losing rice crop yield is not really established in the LC and MC for the mid twenty-first century future. However, the climate conditions remain uncertain as the models show very different behaviors during the flowering phase. Sultan and Gaetani (2016) have concluded that, despite diverging future projections of the monsoonal rainfall, which is essential for rain-fed agriculture, a robust evidence of yield loss is emerging in West Africa. They attribute this yield loss to the increase in mean temperature; while potential wetter or drier conditions as well as elevated CO2 concentrations can be modulated. By analyzing the distribution of dry spells in October in the Casamance region, Bacci (2017) found that the distribution will follow isohyets with a north south gradient from wetter conditions, suggesting almost a normal situation.


 CONCLUSION

The potential risk of climate change on rice crops in the Casamance region is evaluated during the two vulnerable stages of the rice plant: germination and flowering; and future changes either in drought stress occurrences or flooding and wet conditions have been highlighted. First, validation with the CHIRPS observation datasets reveals different patterns in the extreme climate simulations with RCMs.  A reasonable agreement is observed with the CDD and the CWD, whereas the extreme rainfall indices show low agreement with the CHIRPS dataset with REMO and CCLM4 showing the largest disagreement in the germination and flowering phase.
 
In the germination phase, future changes in the CDD index on multi-model projections indicate a statistically increase with the majority of the models in some specific areas and all the Casamance (with two models). Under the RCP4.5, the multi-model ensemble mean projections indicate a potential persistence of drought conditions in the future that constitute a risk for rice yield loss in the germination phase, especially in the LC and in the western part of the MC. This situation is exacerbated under the RCP8.5 scenarios with more intensities. The potential risk of rice yield loss in the LC and the MC is also stated by the future increasing percentage of heavy rain events that could participate in rice plants’ submersion and soil erosion and then reduce the rice productivity. More extreme rainfall during the flowering phases in the LC and the MC as described by RX5DAY is indicated by the majority of the models. The RX5DAY is projected to increase in the LC and the MC (except for two models); the multi-model ensemble mean indicates the same pattern with significantly increase in the LC and MC. A decreasing percentage of rainfalls that could become extreme is indicated in the UC. According to the multi-model’s ensemble mean projections in the mid future under the RCP4.5 scenario, the risk of losing rice crop yields in the LC and the MC is very low and the climate conditions are favorable for the rice crop productivity. In the UC, the future climate conditions present certain risks that could favorite rice crop yields loss with a probable persistence of dry conditions during the flowering phase that could be unfavorable for rice crop production. The climate conditions and patterns of extreme agro-climate indices are more intense under the RCP8.5 scenario due to the different climate sensitivities and feedback mechanisms compared to the RCP4.5. The climate conditions expected in the Casamance region in the future should involve the implementation of adaption strategies and mitigation measures with the introduction of new rice varieties that could resist longer dry spells; but also require the improvement of drainage design and the hydraulic systems and an effective water management strategy. In another line, the impact of 1.5 and 2°C global warming on climate risk in Casamance should be investigated, as it can be a good guide for decision makers to better manage policies in straight line of the Paris initiative.


 CONFLICT OF INTERESTS

The authors have not declared any conflict of interests.


 REFERENCES

Aboudou F, Désir T, Sanni G. & Jenn-Treyer O (2015). Agriculture and Food in West Africa: Trends, Performances and Agricultural Policies. p.138 ECOWAS Commission, Abuja.


Akinsanola AA, Zhou W (2018). Projections of West African summer monsoon rainfall extremes from two CORDEX models. Climate Dynamics 52:2017-2028.
Crossref


Athia WA, Tsidu GM, Amekudzi LK, Yorke C (2020). Trends and interannual variability of extreme rainfall indices over Ghana, West Africa. Theorical and Applied Climatology 140:1393-1407.
Crossref


Bacci M (2017). Characterization of Climate Risks for Rice Crop in Casamance, Senegal. In: Tiepolo M., Pezzoli A., Tarchiani V. (eds) Renewing Local Planning to Face Climate Change in the Tropics. Green Energy and Technology. Springer, Cham, pp. 57-72.
Crossref


Bichet A, Diedhiou A (2018a). West African Sahel has become wetter during the last 30 years, but dry spells are shorter and more frequent. Climate. Research 75:155-162.
Crossref


Bichet A, Diedhiou A (2018b). Less frequent and more intense rainfall along the coast of the Gulf of Guinea in West and Central Africa (1981-2014). Climate. Research 76:191-201.
Crossref


Busby JW, Cook KH, Vizy EK, Smith TG, Bekalo M (2014). Identifying hot spots of security vulnerability associated with climate change in Africa. Climatic Change 124:717-731.
Crossref


Challinor AJ, Watson J, Lobell DB, Howden SM, Smith DR, Chhetri N (2007). A meta- analysis of crop yield under climate change and adaptation. Nature Climate Change 4:287-291.
Crossref


Christensen OB, Drews M, Christensen JH (2006). The DMI-HIRHAM regional climate model version 5, Denmark: DMI Technical Report 06-17.


CSE (2011). Adaptation aux impacts du changement climatique quelles stratégies d'échanges et de partage de l'information scientifique. Technical Report, p. 404.


Dee DP, Uppala SM, Simmons AJ, Berrisford P, Poli P, Kobayashi S, Andrae U, Balmaseda MA, Balsamo G, Bauer P, Bechtold P, Beljaars ACM, van de Berg L, Bidlot J, Bormann N, Delsol C, Dragani R, Fuentes M, Geer AJ, Haimberger L, Healy SB, Hersbach H, Holm EV, Isaksen L, Kallberg P, Kohler M, Matricardi M, McNally AP, Monge-Sanz BM, Morcrette JJ, ParkBK, Peubey C, de Rosnay P, Tavolato C, Thepaut JN, Vitart F (2011). The ERA-Interim reanalysis: configuration and performance of the data assimilation system. Quarterly Journal of Royal Meteorology Society 37(656):553-597.
Crossref


Diatta S, Diedhiou CW, Dione DM, Sambou S (2020a). Spatial Variation and Trend of Extreme Precipitation in West Africa and Teleconnections with Remote Indices. Atmosphere 11: 999.
Crossref


Diatta S, Mbaye M L, Sambou S (2020a). Evaluating hydro-climate extreme indices from a regional climate model: A case study for the present climate in the Casamance river basin, southern Senegal., Scientific African, Vol 10, e00584, ISSN 2468-2276.
Crossref


ECOWAS (2017). 2025 Strategic Policy Framework. ECOWAS Department of Agriculture, Environment and Water Resources, Abuja, Nigeria.


Fiorillo E, Di Giuseppe E, Fontanelli G, Maselli F (2020). Lowland Rice Mapping in Sédhiou Region (Senegal) Using Sentinel 1 and Sentinel 2 Data and Random Forest. Remote Sensing 12:3403
Crossref


Frich P, Alexander LV, Della-Marta P, Gleason B, Haylock M, Tank AMGK, Peterson T (2002). Observed coherent changes in climatic extremes during the second half of the twentieth century. Climate Research 19:193-212.
Crossref


Funk C, Peterson P, Landsfeld M, Pedreros D, Verdin J, Shukla S, Husak G, Rowland J, Harrison L, Hoell A, et al. (2015). The climate hazards infrared precipitation with stations-A new environmental record for monitoring extremes. Scientific Data 2(150066):2-21.
Crossref


Giannini A, Saravanan R, Chang P (2003). Oceanic forcing of Sahel rainfall on interannual to interdecadal time scales. Science 302:1027-1030.
Crossref


Jacob D, Bärring L, Christensen OB, Christensen JH, De Castro M, Deque M, Giorgi F, Hagemann S, Hirschi M, Jones R, Kjellström E (2007). An inter-comparison of regional climate models for Europe: model performance in present-day climate. Climatic Change 81(1):31- 52.
Crossref


Janicot S, Trzaska S, Poccard I (1996). Summer Sahel-ENSO tele- connection and decadal time scale SST variations. Climate Dynamics 18:303-320.
Crossref


Maidment RI, Allan RP, Black E (2015). Recent observed and simulated changes in precipitation over Africa. Geophysical Research Letter 42:8155-8164.
Crossref


Malou R (1992). Etude des aquifères superficiels en basse Casamance : un modèle de bilan hydrique. Dakar : UCAD ORSTOM, 127 p. multigr. Th 3ème cycle : Geol., Université Cheikh Anta Diop de Dakar. 1992/06/26.


Mendez Del Villar E (2019). Rapport de Mission. Le Riz Pluvial en Casamance et Bassin Arachidier. CIRAD, Montpellier, France.


Moss R, Edmonds J, Hibbard K, Manning M, Rose S, van Vuuren D et al (2010). The next generation of scenarios for climate change research and assessment. Nature 463:747-756
Crossref


Müller C, Bondeau A, Popp A, Waha K, Fader M (2010). Climate Change Impacts on Agricultural Yields. Background note to the World Development Report 2010, Potsdam Institute for Climate Impact Research.


Ndong JB (1995). L'évolution de la pluviométrie au Sénégal et les incidences de la sécheresse récente sur l'environnement / The evolution of rainfall in Senegal and the consequences of the recent drought on the environment. Géocarrefour 70(3):193-198.
Crossref


Nikulin G, Jones C, Giorgi F, Asrar G, Büchner M, Cerezo-Mota R, et al. (2012). Precipitation climatology in an ensemble of CORDEX-Africa regional climate simulations. Journal of Climate 25: 6057-6078.
Crossref


Odoulami RC, Akinsanola AA (2017). Recent assessment of West African summer monsoon daily rainfall trends. Weather. 
Crossref


Panthou G, Vischel T, Lebel T (2014). Recent trends in the regime of extreme rainfall in the Central Sahel. International Journal of Climatology 34: 3998-4006.
Crossref


Rodrıguez-Fonseca B, Polo I, Garcia-Serrano J, Losada T, Mohino E, Mechoso CR, Kucharsky F (2009). Are Atlantic Nin ̃os enhancing Pacific ENSO events in recent decades? Geophysical Research Letters 36:L20705.
Crossref


Roudier P, Sultan S, Quirion P, and Berg A (2011). The impact of future climate change on West African crop yields: what does the recent literature say? Global Environmental Change 21:1073-1083.
Crossref


Samuelsson P, Jones CG, Will ́ En U, Ullerstig A, Gollvik S, Hansson UL, Jansson E, Kjellstro ̈ M C, Nikulin G, Wyser K (2011). The Rossby Centre Regional Climate model RCA3: model description and performance. Tellus A: Dynamic Meteorology and Oceanography 63(1):4-23.
Crossref


Sané T, Benga A, Sall O (2010). La Casamance face aux changements climatiques : enjeux et perspectives. Actes du 23ème colloque de l'Association International de Climatologie, Rennes (France). pp. 559-564.


Sané T, Diop M, Sagna P (2008). Étude de la qualité de la saison pluvieuse en Haute-Casamance (Sud Sénégal), Sècheresse 19(1):23-28.


Scinocca JF, Kharin VV, Jiao Y, Qian MW, Lazare M, Solheim L, Flato GM, Biner S, Desgagne M, Dugas B (2016). Coordinated global and regional climate modeling. Journal of Climate 29(1):17-35.
Crossref


Sillman J, Kharin V, Zwiers F, Zhang X, Bronaugh D (2013). Climate extremes indices in the CMIP5 multimodel ensemble: Part 2. Future climate projections. Journal of Geophysical Research and Atmosphere 118:2473-2493.
Crossref


Sultan B, Gaetani M (2016). Agriculture in West Africa in the Twenty-First Century: Climate Change and Impacts Scenarios, and Potential for Adaptation. Frontiers in Plant Science 7:1262.
Crossref


Sun QH, Miao CY, Duan QY (2016). Extreme climate events and agricultural climate indices in China: CMIP5 model evaluation and projections. International Journal Climatology 36:43-61.
Crossref


Sylla MB, Pal JS, Wang GL, Lawrence PJ (2016). Impact of land cover characterization on regional climate modelling over West Africa. Climate Dynamics 46:637-650.
Crossref


Thiam El, Singh VP (2002). Space-time-frequency analysis of rainfall, runoff and temperature in the Casamance River basin, southern Senegal, West Africa. Water SA 28: 3. ISSN 0378-4738.
Crossref


Thiam El, Singh VP (1997). Precipitation, Runoff and Salinity Analysis in the Casamance Watershed Managed by SZWMP. Technical Report WRR, Dept. of Civil and Environ. Eng., Louisiana State University, Baton Rouge, Louisiana.


van Meijgaard E, van UlftL L, van de Berg WJ, Bosveld FC, van den Hurk B, Lenderink G, Siebesma AP (2008). The KNMI regional atmospheric climate model RACMO version 2.1, Technical Report. p.302.


van Vuuren DP, Edmonds J, Kainuma M, Riahi K, Thomson A, Hibbard K, Hurtt GC, Kram T, Krey V, Lamarque JF, Masui T, Meinshausen M, Nakicenovic N, Smith SJ, Rose SK (2011). The representative concentration pathways: an overview. Climatic Change 109(1-2):5-31.
Crossref


Zhang X, Alexander L, Hegerl GC, Jones P, Tank AK, Peterson TC, Trewin B, Zwiers FW (2011). Indices for monitoring changes in extremes based on daily temperature and precipitation data. Wiley Interdisciplinary Reviews Climate Change 2:851-870.
Crossref


          */?>