ABSTRACT
The ever growing saline lake Beseka is located at the northern end of Main Ethiopia Rift; MER. The levels of some selected heavy metals (Pb, Cr, Cd, Fe, As and Mn) were determined in water sample collected from 5 sites of the ever growing Lake Beseka by systematic random sampling methods and analyzed spectrophotometrically for its suitability for drinking, irrigation and other domestic purpose. The results of the heavy metals concentration revealed the following: Pb (0.434-0.916 mg/L), Cd (0.031-0.103 mg/L), As (0.043-0.067 mg/L), Fe (0.163-0.247 mg/L) Cr (BDL) and Mn (0.061-0.092 mg/L). The result obtained revealed that the heavy metals show variation among sampling points. Pb, Cd, As and Fe recorded concentrations above the WHO guideline limits of 0.02, 0.003, 0.01 and 0.04 mg/L, respectively but they are below the ANZECC and ARMCANZ standard guide line limit for irrigation A and Cr were below their respective detection limits. The main causes of deterioration of water quality are disposal of effluent from municipal of MER, agrochemical runoff and effluent discharged from industries without treatment. The results suggest that the use of such waters for drinking and domestic purposes pose a serious threat to the health of the users and calls for the intervention of government agencies.
Key words: Heavy metal, atomic absorption spectrophotometer (AAS), main Ethiopia rift (MER), determination, analysis.
The saline Lake Beseka is found within the volcanically active rift floor of the main Ethiopia rift (MER). Lake Beseka water quality deteriorated due to anthropogenic activities like discharge of effluents from municipals of MER, agrochemical run off, effluents discharged nearby MER factories without treatment and poor sanitation which make community to depend on unsafe and poor water consumption. Beside this, the contaminated lake
water are strongly linked with Awash River that is used for domestic consumption and irrigation. The inflow of Lake Water mixes with ground water of the Awash River affects large number of physical and chemical processes that may have influence on the water quality like change the natural color of the water due to the presence of trace metal (APHA, 1992).
In addition to the anthropogenic activities, the Lake Beseka water quality also deteriorated by the natural processes like precipitation inputs, erosion, weathering of crustal materials (Fernandez and Olalla, 2000), determine the quality of ground water in MER. The main sources of heavy metals pollutions in Main Ethiopia Rift are the industrial influents discharged from various processing industries (Tole and Shitsama, 2001). The impacts of both natural and anthropogenic activities deteriorate the quality of lake water.
In recent times, the saline Lake Beseka is used for the purpose of washing vehicles that discharges heavy metals and disposal of effluents from municipals of MER, garages, agrochemical run off and effluents from nearby industries increases the concentration of heavy metals (Biney, 1994) which deteriorate the quality of the water. In this study, the concentration of As, Pb, Cr, Fe, Mn and Cd in the water of Beseka saline Lake of northern part of (MER) are investigated. The results of this study can be used by authorities for directing environmental monitoring, management, and remediation programs.
Sampling
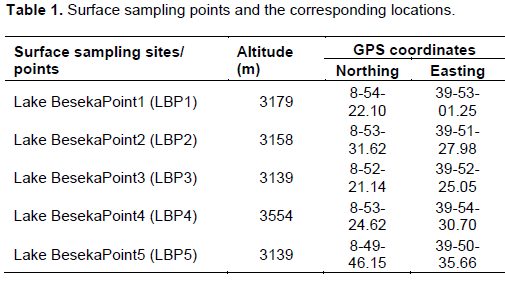
In January 15, 2016, five water samples were collected from saline lake Beseka by systematic random sampling method from the surface of Lake water of different directions in poly ethylene plastic bottle (PEPB) which was washed by grade reagents of 68-72% HNO3, and followed by deionized water and sterilized by autoclave at 121°C for 20 min. The sample was collected from each point on three occasions (day break, afternoon and evening) from lake water in 1 L of PEPB. The water samples were then kept in an icebox before being prepared for analysis. The exact coordinates of the locations of the sampling points were marked with a Global Positioning System (GPS) (Garmin 12 Channel GPS, USA) (Table 1) and the coordinates were exactly overlaid on the map of Lake Beseka by using ArcGIS 9.0 Software
Sample preparation and analysis
Water samples were filtered using a vacuum pump and 0.45 μm pore-size filter papers in order to separate particulate matter. The filtered samples were acidified with HNO3 for target analyte measurement. The samples were kept at 4°C prior to analysis. Heavy metals of lead, cadmium and chromium concentrations were analyzed by FAAS (Buck Scientific model 210VGP, east Norwalk, USA) using APHA (1998) standard methods while iron, manganese and arsenic was analyzed by DR-2800 spectrophotometer using EPA, (1999) standard methods.
Calibration curves
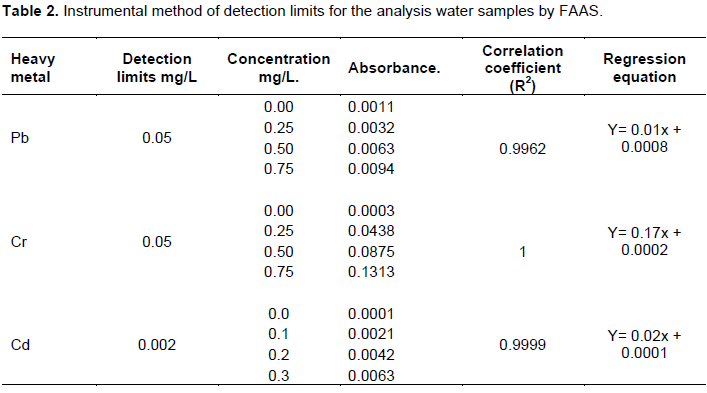
Calibration curve was used to calculate the concentration of the heavy metals known in each water sample. The calibration curves for each metal were drawn by preparing four concentrations of known solution versus its corresponding absorbance measured as shown in Table 2.
The correlation coefficients of all the calibration curves were > 0.99 and these correlation coefficients indicate very good correlation (positive correlation) between concentration of heavy metals and their absorbance.
Recovery test
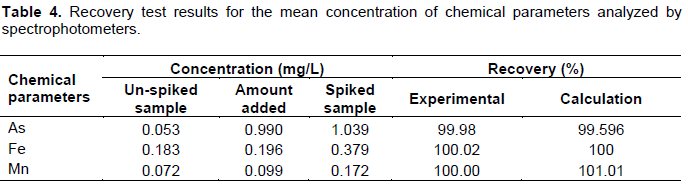
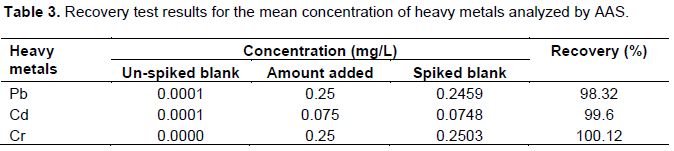
The percentage recovery ranged between 98.32 and 100.12% for AAS as described in Table 3 and 99.55 to 100.1% for spectrophotometer. This implies that, the measured results are within the acceptable range of 75 to 110% and the result also agrees with the findings of Fong et al. (2006). Thus, the digestion of water samples procedure for chemical analysis in the water sample was validating.
The heavy metals data of the water sample collected in the January 15, 2016 are presented in Table 4. The results of the samples vary among the samples because of the anthropogenic factors like disposal of effluent from the municipals, industries, garages, hospitals and natural processes such as precipitation inputs, erosion, weathering of crustal materials, dilutions of rocks by hot ground waters, etc. Naturally, the quality of ground water in MER influenced by complex geological activities which increase the concentration of the chemical constituents in water by transfer of deep ground water in thermal spring (Tamiru, 2005).
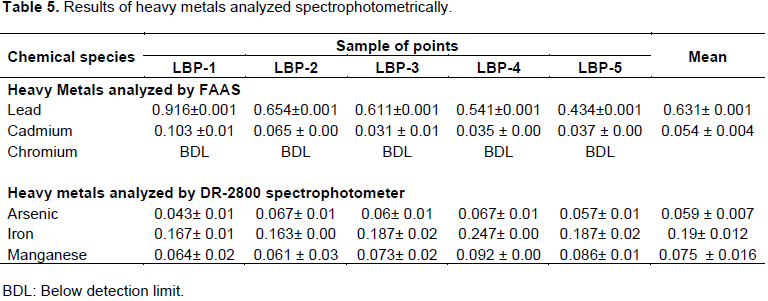
Heavy metals analysis of the lake water sample includes lead, arsenic, manganese, iron, chromium and cadmium from the ever growing lake Beseka is shown in Table 5.
Lead
The average value for lead concentration of lake Beseka ranges between 0.434 and 0.916 mg/L with an average value of 0.631 mg/L, which was above the maximum allowable WHO standards level, that is, 0.01 mg/L for drinking purpose. The increase in the lead concentration levels indicates discharges of effluents such as human and animal excreta, agricultural run-off containing phosphatic fertilizers, effluent discharges from nearby industries of MER, household sewages and mechanic workshops especially battery chargers.
Arsenic
The total amount of arsenic over the surface of the lake water varies between 0.043 and 0.067 mg/L with mean value of 0.059 mg/L. It is usually present in natural waters at concentrations less than 1 to 2 mg/LWHO. The finding indicates that the mean values of arsenic are above the WHO (2008) acceptable limit for drinking water quality. According to WHO, the lake water is toxic and it causes bladder and lung cancer. The high concentration of arsenic due to high temperature water rock interaction was believed to be the main driving force behind the existence of trace metals in the hot springs, rivers and lakes in the main Ethiopian rift valley (Tamiru, 2005).
Iron
The total amount of iron species over the surface of lake water varies between 0.163 and 0.247 mg/L with mean value of 0.19 mg/L. The research finding indicates that the amounts of iron within the lake increase from previous studies. MoWR (1999) has also reported the concentration range of total iron in the Lake Beseka ranging between 0.163 and 0.247 mg/L among a large number of different samples taken from different sampling locations over the surface of the lake. The difference is due to high temperature water rock interaction believed to be the main driving force behind the existence of trace metals in the hot springs, rivers and lakes in the main Ethiopian rift valley (Tamiru, 2005).
Chromium
Laboatory analysis indicates that chromium concentration within the lake Beseka were below the detection limit of the instruments.
Cadmium
The total amount of cadmium over the surface of lake water varies between 0.031 and 0.103 mg/L with arithmetic average of 0.054 mg/L. The important releases of cadmium to the water pollutions is due to natural mobilization of cadmium from the Earth's crust and mantle, such as volcanic activity including hydrothermal vents and weathering of rocks; current anthropogenic releases from the mobilization of cadmium impurities in raw materials such as phosphate minerals, fossil fuels and other extracted, treated and recycled materials - particularly zinc and copper industries in the MER. The arithmetic average concentration of cadmium obtained from lake is 0.054 mg/L which was above the allowable limits of WHO and drafts of Ethiopian standards (0.003 mg/L) for drinking purpose. High concentrations of cadmium are toxic to beans, beets and turnips at concentrations of 0.1 mg/L in nutrient solution. Conservative limits are recommended. The arithmetic average concentration of cadmium was above the allowable limits for long and short term irrigation as well as livestock (Australia and New Zealand, 2011; BIS, 2009) which was 0.01 mg/L.
Manganese
The total amount of manganese over the surface of lake water varies between 0.061 and 0.092 mg/L with arithmetic averages of 0.075 mg/L as indicated in the appendix. The increments in the concentration was due to high temperature water rock interaction believed to be the main driving force behind the existence of trace metals in the hot springs, rivers and lakes in the main Ethiopian rift valley (Tamiru, 2005). This implies the effects of natural and human activities are diluted by hot springs bulk waters (Chapman, 1992). The arithmetic average concentration of manganese obtained from Lake was 0.074 mg/L which is below the allowable limits of WHO and drafts of Ethiopian standards (0.1 mg/L) for drinking purpose. Beyond 0.3 mg/L limit manganese and iron affects taste/appearance of water, has adverse effect on domestic uses and water supply structures. Presence of manganese in water may be toxic to a number of crops at a few-tenths, it’s above allowable limit was 0.2 mg/L for long term irrigation as well as available for livestock (Australia, New Zealand, 2011; BIS, 2009).
The bio-accumulation of heavy metals in the biological system transfers the toxic elements from the producer to consumer level which can be a future health hazard (Aniruddhe, 2000). Heavy metals are important environmental pollutants and their toxicity is a problem of increasing significance for ecological, evolutionary and environmental reasons (Das et al., 2012). The heavy metal load in the reservoir indicates the heavy metal toxicity which varies at different sampling points. Most of the heavy metals, if present beyond permissible limits in water are toxic to children (Das et al., 2012; Elsner et al., 2005; Finley et al., 1999).
According to finding of this study, lead, arsenic, iron and cadmium are present relatively with higher concentrations as compared to their permissible limits set by WHO while manganese is in permissible range and cadmium is BDL. Beseka Lake is also used for fishing, recreation and irrigation purposes, it is quite evident that this heavy metal may enter the food chain, and thus through bio magnifications enter the human body and can cause serious problems to human health, habitats of lake and in the plant growth. Except Mn within permissible range and Cd which is BDL all other target analytes are above the allowable limits for long and short term irrigation (Australia and New Zealand, 2011) as well as for the livestock (BIS, 2009).
The author has not declared any conflict of interests.
REFERENCES
|
APHA (1998). Standard Methods for the Examination of Water and Wastewater. 20th Edition, American Public Health Association, Water Environment Federation, American Water Works Association, Washington, USA.
|
|
|
|
Aniruddhe M (2000). A case study of idol immersion in the context of urban lake management, Jabalpur Municipal Corporation, Jabalpur, Madhya Pradesh, India.
|
|
|
|
|
ANZECC, ARMCANZ (2000). Australian and New Zealand Guidelines for Fresh and Marine Water Quality. National Water Quality Management Strategy Paper no. 4. Australian and New Zealand Environment and Conservation Council / Agriculture and Resource Management Council of Australia and New Zealand.
|
|
|
|
|
Ayenew T (2006). Vulnerability of Selected Ethiopian Lakes to Climatic Variability, Tectonism and Water Use: Global Change System for Analysis, Research and Training (START), 2006. Available online:
View (accessed on 21 December 2015)
|
|
|
|
|
Biney C (1994). Review of heavy metals in the African aquatic environment. Ecotoxicol. Environ.Saf. 28(2):134-159.
Crossref
|
|
|
|
|
Das KK, Panigrahi T, Panda RB (2012). Idol Immersion Activities Cause Heavy Metal Contamination in River Budhabalanga, Balasore, Odisha, India, Int. J. Mod. Eng. Res. 2(6):4540-4542.
|
|
|
|
|
Elsner RJ, Spangler JG (2005). Neurotoxicity of inhaled manganese: Public health danger in the shower? Med. Hypotheses 65(3):607-616.
Crossref
|
|
|
|
|
Fong SS, Kanakaraju D, Ling SC (2006). Evaluation of the acid digestion method with different solvent combination for determination of heavy metal. Malaysia J. Chem. 8:10-15.
|
|
|
|
|
Fernandez LG, Olalla HY (2000). Toxicity and bioaccumulation of lead and cadmium in marine protozoan communities. Ecotoxicol. Environ. Saf. 47:266-276.
Crossref
|
|
|
|
|
Finley JW, Davis CD (1999). Manganese deficiency and toxicity: Are high or low dietary amounts of manganese cause for concern?". BioFactors 10(1):15-24.
Crossref
|
|
|
|
|
MoWR (2002). Watersector development program 2002-2006, main report document. Addis Ababa, Ethiopia.
|
|
|
|
|
Paustenbatch DJ, Finely BL, Mowat FS, Kerger BD (2003). Human health risk and exposure assessment of chromium (VI) in tap water, Chem Risk, Alameda, California, USA.
|
|
|
|
|
Ram SL, Pravin US, Deepali SP (2011). Pollution in Water of Kasardi River Flowing along Taloja Industrial Area of Mumbai, India. World Environ.1(1):6-13.
|
|
|
|
|
Tole MP, Shitsama JM (2001). Concentrations of heavy metals in water, fish, and sediments of the Winam gulf, in Paper presented at LVEMP conference, Kisumu, Kenya.
|
|
|
|
|
Tamiru A (2005). Hydro geochemical and lake level changes in Ethiopia Rift. Elsevier: J. Hydrol. pp. 1-11.
|
|
|
|
|
WHO (2008). Guidelines for drinking water quality. World Health Organization, Geneva, Switzerland.
|
|