Full Length Research Paper

ABSTRACT
Using a 10-year daily data thunderstorm and dry thunder (thunder without precipitation) that spans from 1991-2000, the spatial, seasonal and inter-seasonal variations of thunderstorm frequency have been investigated with results which include the production of seasonal and inter-seasonal maps of dry thunder (thunder without precipitation) and thunderstorm frequencies. Results showed that there exists a latitudinal belt of reduced thunderstorm activity between 8 and 10°N. Also, due to absence of little dry season (LDS) over the south-eastern part of the country, they do not experience double maxima of thunderstorm activity. Hence, the weather over the country has been observed as not following the latitudinal divides. Also, the thunderstorm activities over the country are more prominent over the coast, but gradually decrease towards the inland with anomaly over Ilorin and Yola. Though, several authors have carried out series of researches on the thunderstorm activities but none have been able to look at the seasonal and inter-seasonal variations of thunderstorm frequency over Nigeria. Hence, the need to look into this aspect came as a result of the fact that thunderstorm activities is one of the most contributing systems to total precipitation in Nigeria.
Key words: Thunderstorm, seasonal, frequency, latitude, Nigeria.
INTRODUCTION
Studies have shown that the greatest proportion (with about 70%) of the annual rainfall of West Africa countries comes from deep convective systems (Adelekan, 1998; Omotosho, 1985). This has been discovered to be largely as a result of the occurrence of thunderstorm systems that contribute mostly to the summer rainfall (Byers and
Braham, 1949; Balogun, 1981).
Several definitions have been given about thunder-storm ranging from being merely a storm containing lightning and thunder (Ahrens, 2000) to being a convective storm that is accompanied by lightning, thunder and other variety of weather such as local heavy shower, hails, gusty wind, sudden temperature change and occasionally tornadoes (Alexander and Aloni, 2015).
However, as a weather system, thunderstorm has been observed to usually comprise fluctuating ensemble of “cells” and produces a contagious precipitation area of about ~100 km in horizontal scale in at least one direction (Houze, 1993). Within each of these cells are; updraft flows, precipitation showers and downdraft flows. While the updraft flows arise as a result of the formation of a gust front ahead of a thunderstorm cell, the low-level downdrafts arise from the flow of low theta-e (low θe - which is dry and cold) towards the cumulonimbus cloud, at the level of the African Easterly Jet (AEJ). This air is driven by melting, evaporation and hydrometeor drag (Srivasta, 1985 and Knupp, 1988).
However, further studies (Smull and Houze, 1987; Kingsmill and Wakimoto, 1991; Biggerstaff and Houze, 1993; Smull and Augustine, 1993) have revealed the occurrence of upper-level downdrafts at the sides of the upper portion of updrafts. The economic importance of this system has been documented as a fundamental component of the climate and a key element of the water cycle and a global atmospheric electric circuit (Changnon, 2001b). Also, thunderstorm is one of the major contributors to flooding and soil erosions (Adelekan, 1998), leading to loss of lives and causing great damages to properties worth millions of dollars in Nigeria (IFRC and NEMA, 2012 reports). Enete et al. (2015) showed from their study that thunderstorms accounted for 32% of flight cancellation with 218 occurrences, 0.2% of diversion with 291 occurrences and 24% of delays with 526 occurrences at Port-Harcourt International Airport between 2008 and 2013. In some areas, thunderstorm contributes greater percentage of about 60% to the annual rainfall (Obasi, 1974), while 70% or more of annual rainfall is associated with the moving belt of thunderstorms (Omotosho, 1984). In Nigeria, the greatest of the three rainfall systems is thunderstorm, producing about 45.7% of the total summer rainfall (Orisakwe, 2015).
Researchers have carried out several works on thunderstorm rainfall, perhaps due to the associated phenomena they produce; heavy rainfall, lightning, hail, gusty winds, etc (Changnon, 2001a; Omotosho, 1985; Adelekan, 1998). Others worked on the seasonal distribution of thunderstorm days (Mulero, 1973), the distribution of thunderstorm rainfall (Balogun, 1981) discussed the seasonal and spatial distribution of thunderstorm, while Omotosho (1985) worked on the separate contributions of thunderstorm, squall lines and rainfall to the total rainfall in Nigeria. But more recently are the works of Ologunorisa (1999) and Dai (2001) who made use of data from over 15000 stations throughout the globe to study global precipitation and thunderstorm frequency, and Ologunorisa and Alexander, (2004, 2007) also dwelt on the annual thunderstorm trend and fluctuations and the diurnal variations of thunderstorm activity over Nigeria. As observed, few works have been done on thunderstorm days and frequency with little or none written in the area of seasonal, inter-seasonal and spatial variations of thunderstorm frequency especially over Nigeria.
This is an area where changing climate variables, have the potential of affecting either negatively or positively, by decreasing or increasing the frequency of occurrence of thunderstorm, seasonally, inter-seasonally and spatially. In addition to studying the wet thunderstorm, the characteristics of dry thunder was also studied. Therefore, this study made use of thunderstorm data so as to establish a fact on the seasonal and inter-seasonal variations of both dry thunder and thunderstorm vis-à-vis the amount of rainfall seasonally over Nigeria.
Using the thunderstorm dataset, this work was aimed at presenting a synoptic view of the frequency as well as the spatial distribution of both the dry and wet thunderstorm, in the face of changing climate variables. In order to achieve this, the following objectives were drawn up which include to: a. separate from the entire thunder-storm data the number of occurrence of both the dry and the wet thunderstorms; b. ascertain the trend and inter-seasonal variability of both the dry and wet thunderstorm in the event of changing climate variables; and c. present the spatial display of the frequency of occurrence of thunderstorm and dry thunder over Nigeria.
METHODOLOGY
Daily thunderstorm and the associated rainfall amount data spanning a period of ten (10) years (1991-2000) extracted from the daily record of observation from Nigerian Meteorological Agency, Oshodi, Lagos, constituted the main data.
Nigeria lies between large land surface and water body, and close to the Equator as shown in Figure 1. It is between the latitudes 4 - 14°N and longitudes 3 - 15°E. To the east of Nigeria is Cameroun, on the North is the Republic of Niger, while to the West and south are the republic of Benin and Atlantic Ocean, respectively. Nine (9) Stations within Nigeria were considered with such spread that covers all the climatic zones of the country; the Sahel savannah, Guinea Savannah and the tropical rainforest, with three representative stations as shown in Figure 1. 
In the register of observations, the record of the times of start and end of rainfall events; presented under three columns (0600 to 1800 h, 1800 to 0600 h next day and 0600 to 06 h next day), the rainfall amount and the meteorological system (that is Squall lines, Thunderstorm or Monsoon), responsible for the rain and their times of start and end. It is through the column for the rainfall amount that we were able to ascertain whether or not rain accompanied the occurrence of thunder, while the column for weather, showed us whenever there was the occurrence of thunderstorm, with or without rainfall.
However, there have been different classifications of thunderstorms, ranging from;
i. in situ and slow-moving storms (maximum gusts less than 24 knots) and squall lines with gusts greater than 24 knots (Omotosho, 1985, 1987) using surface data; and
ii. air-mass thunderstorm and severe thunderstorms according to the strength of the wind shear (Ahrens, 2000).
But here, considering the association of rainfall with the occurrence of thunderstorm, we were able to classify thunderstorm into; dry thunder (with trace or no rain at all) and wet thunder (with measurable rain). This was achieved by comparing the column of rainfall amount with that of weather. In an event when a thunderstorm occurred in the evening, as is the case in West Africa (Omotosho, 1987; 2008), but its rainfall extends to the early hours of the following days, the rainfall was added against the day during which the storm occurred, in as much as the rainfall did not last beyond 0600Z. Such a day was not a rainy day, unless another thunderstorm with rain occurred later in the evening/night of the same day.
In order to study the frequency of occurrence of thunderstorm, the total monthly number of thunderstorm followed by the total annual number of thunderstorm were computed. But in order to compare the degree of variation of the frequency of occurrence of thunderstorm, the coefficient of variation was calculated using:

![]()
Where, C.V. is the coefficient of variation,  is the standard deviation, while is the mean of the frequency.
RESULTS AND DISCUSSION
Spatial distribution of thunderstorms with time
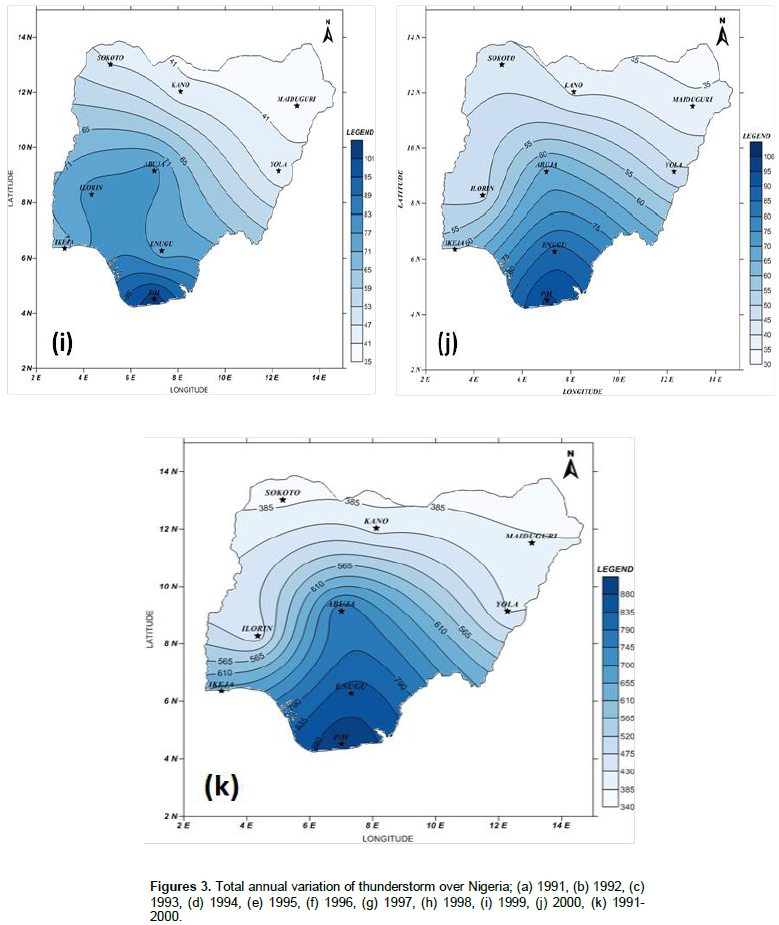
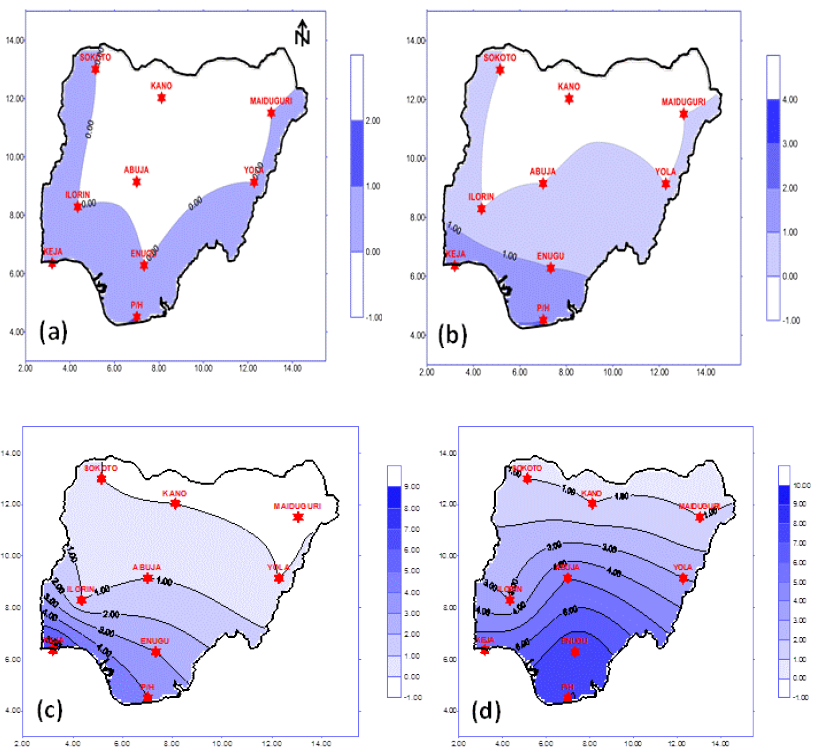
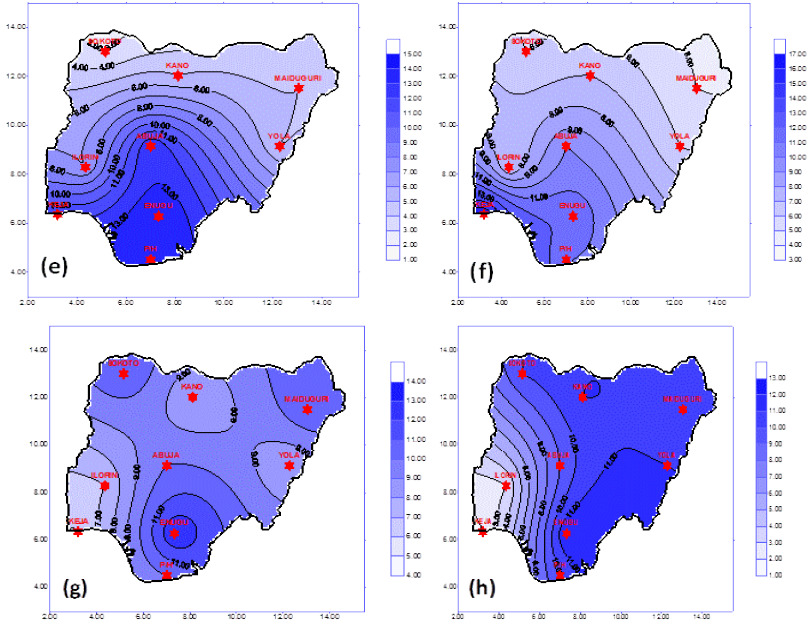
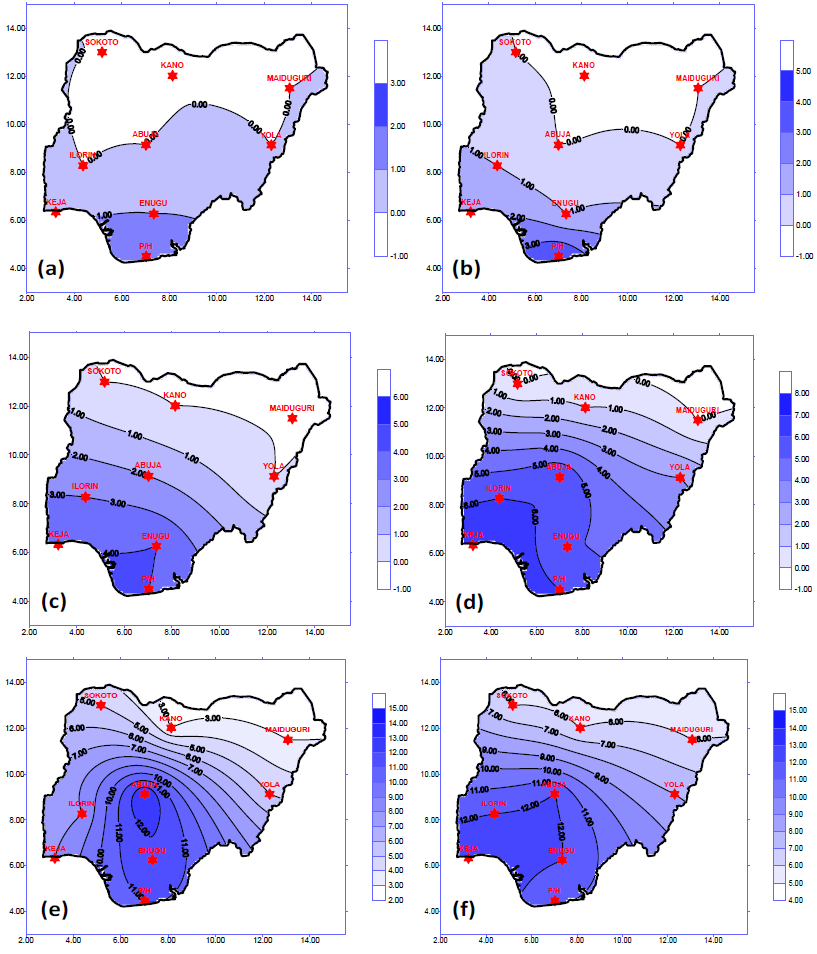
Thunderstorm activities were only recorded in the Sahelian region of Maiduguri between July and August (Figures 2g and h) which coincides with the period of northernmost position of the Inter-tropical Discontinuity (ITD) and the time of Little Dry Season (LDS) in the south. The cores of the thunderstorm activities are stronger from the coast up to 9°N (around Abuja) in the summer months of April-June and September-October (Figures 2d-j), but with thunderstorm occurrence ranging from 2-3 times in November (Figure 2k). These findings are in agreement with Anne-Duncan (2010), who asserted that the months of May to October, which is the months of the rainy season are mostly characterized by thunderstorms and line squalls with its attendant turbulence, micro bursts and lightning. The effect and/or possible implication of LDS which leads to some areas having double maxima rainfall (10°W-9°E up to 10°N) (Omotosho, 1988), started exhibiting its feature of no activity in July but become prominent in the month of August as it spans to about 8°E and within south of 10°N. The beginning of thunderstorm activities always starts from the southwest through the south-south at the beginning of the summer month of March but later migrates to the centre of the study area in the other summer months till October as seen in Figure 2d-j.
The position of the ITD in the month of August implied that the thunderstorm activities are more predominant in the Sudan and Sahel region of the country at latitude 11°N upward. But such strong activities were also experienced around Enugu axis (lat. 6.28°N and long. 7.33°E) as was observed over Owerri (lat. 5.29°N and long. 7.00°E) as revealed by Enete et al. (2012), which is well below 10°N (transition zone) when other stations south of the same latitudinal position are experiencing lesser activities of the system. This situation can be attributed to orographic influences such as the presence Obudu hill and Cameroon Mountain.
In the month of August, the existence of a shift of the maximum isoceraunic lines from the coast up to the extreme north was observed as seen in Figure 2h, which could be as a result of the availability of more moisture which favours the development of cumulonimbus (CB) clouds as well as the position of the ITD. Together with the existence of an area of More Thunderstorm Activities (MTA) over Enugu, there is a latitudinal belt of reduced thunderstorm activities (RTA) which is between 7-10°N in August (Figure 2h). However, this belt has been observed to be between 6 and 8.5°N (Omotosho, 1988).
Furthermore, when a baseline of 5 numbers of thunderstorm was used, it was observed that the onset of agriculturally viable rainfall, which has been postulated to be lagging behind thunderstorm (Balogun, 1981), begins in March (Figure 2c), over the tropical rainforest regions of Ikeja and Port Harcourt, April (Figure 2d) over Abuja, May (Figure 2e) over Yola and Ilorin, and June (Figure 2f) over the Sahel region of Kano. This is in line with the findings of (Balogun, 1981) that rainfall over Nigeria follows the meridional migrations of the ITD from around 5°N in January to a maximum position of about 22°N in August. There is a drastic reduction in the number of thunderstorm over the areas lying between 2-7°E and 6-10°N as witnessed between the months of July and August (Figures 2g and h, respectively), which confirms the existence of the anomalous “little dry season”. This is in line with the findings of Ireland (1962), who gave the northern and eastern limits of this LDS as 9°N and 5°E, respectively. In confirming the existence of this “anomaly”, Adefolalu (1972) and Adekoya (1979) showed that the LDS extends to 12°W and 7°E.
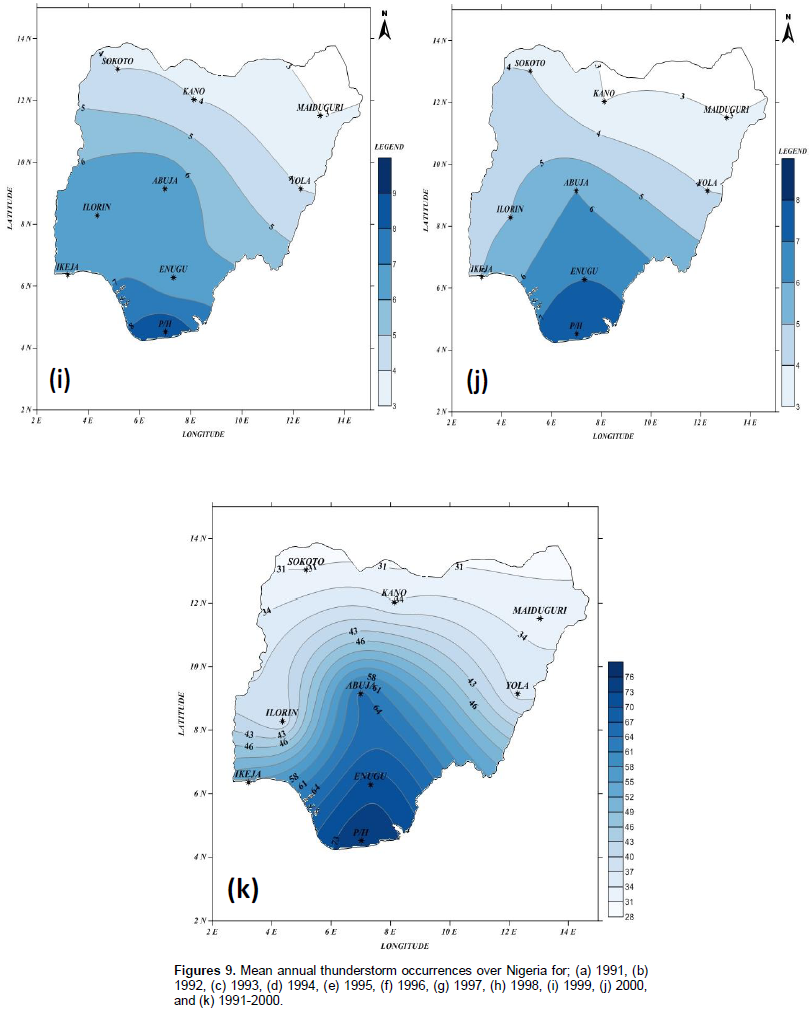
The isoceraunic lines of maximum thunderstorm activities were found over areas that are occupying the central states of the country but there exist reduced numbers of thunderstorm activities over areas to the extreme left (west) and right (east) of the country as seen at Ilorin and Yola stations (Figures 2d-f and i-j). This ‘centralized shape’ could be attributed to the movement and position of the weather producing wave (ITD) that is prevalent over the country; wherein the trough falls on, as in the central Nigeria (longitudinally) receives maximum thunderstorm activity, while the area under the crest of this wave experiences reduced thunderstorm activity. This can also be seen over the Sahel region, where the occurrence of thunderstorm tends to be greatly reduced over Maiduguri more than over Sokoto, with Kano (at the centre) receiving MTA. This severe RTA over Maiduguri (Figure 9c, d, g, h, i and j) could be the reason for the existence of more severe desert encroachment from this side of the country than it is over Sokoto, and this is particularly noticeable in September (Figure 2i) but reflected little in other months.

Mean inter-seasonal variation
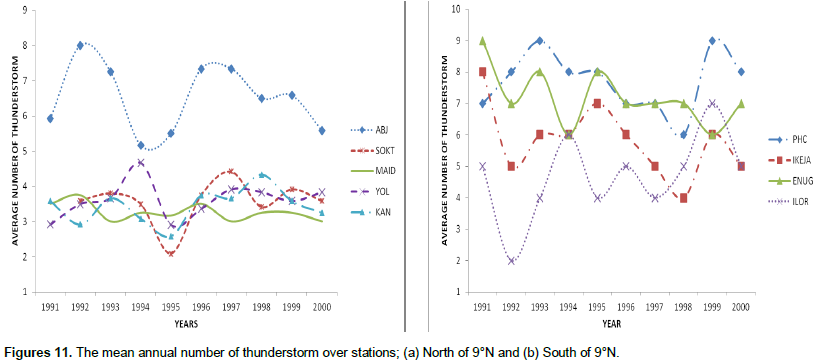
It can be seen from Figure 11a that the average number of thunderstorm remains constant between 3 and 4 thunderstorms (TS) per year for stations north of 9°N while Abuja has the highest number of thunderstorm occurrence of 8 TS in 1992 and 7 TS in 1996. However, there is generally a very low thunderstorm occurrence over Ilorin and Yola, which implies the dominance of the other rain producing systems such as monsoon and squall line. The same cannot be said of the stations south of 9°N where the range of the average thunderstorms recorded were between 4 and 9 TS per years with the least number of 2 TS of thunderstorm per years (Figure 11b) experienced over Ilorin station in 1992. While Port Harcourt, Ikeja and Enugu were experiencing a downward trend in the average number of thunderstorms from 1991-1998, Ilorin on the other hand was experiencing an upward trend.
Five year mean inter-seasonal variation
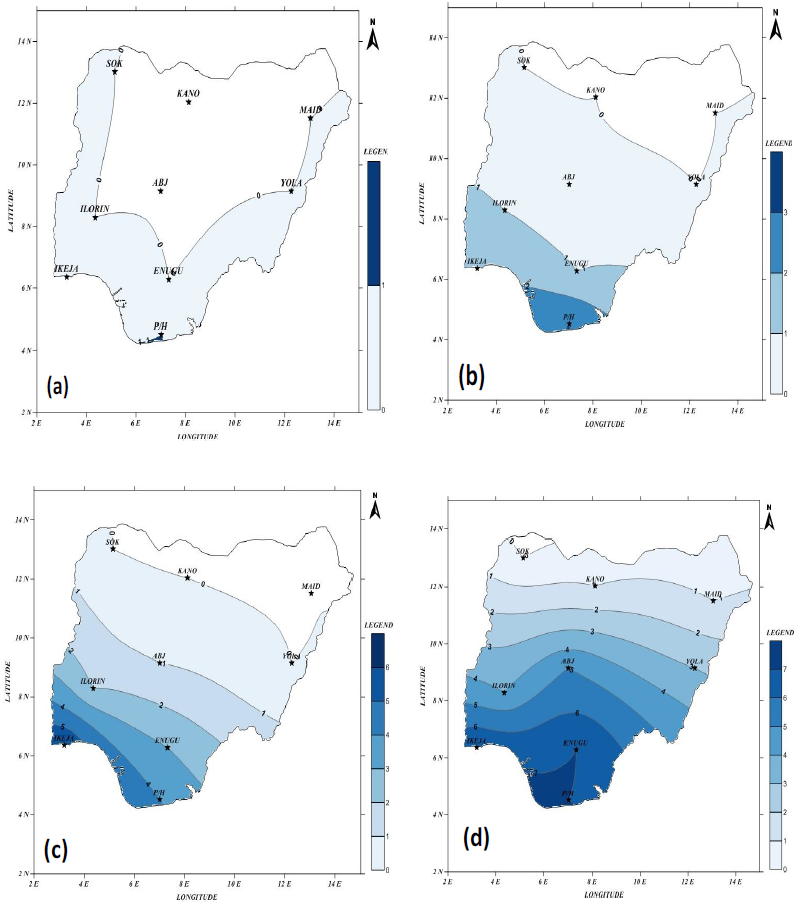
Between the first and second pentads on the inter-seasonal basis; the five year mean is to determine the variability in the frequency of occurrence of thunderstorms within the ten years period by comparing the first pentad and the second pentad (Figures 3a-k). Hence, the pentad spatiotemporal graphs will give a better representation on an average than on an annual basis.

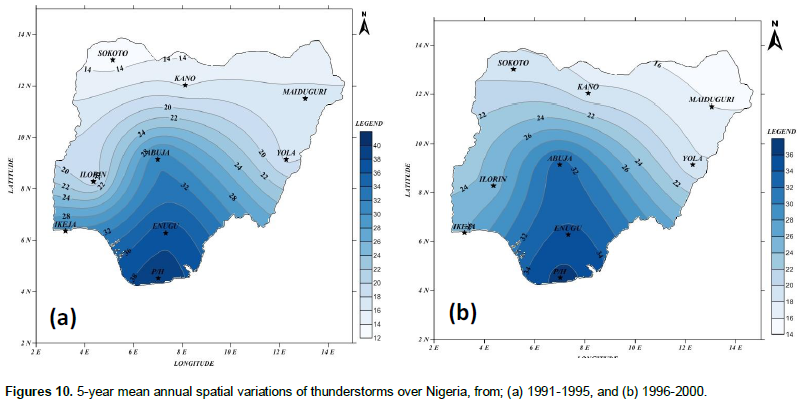
There is an increase in the number of thunderstorm occurrences inland in the second pentad between 1996 and 2000. This increase is more prominent over Ilorin and Yola in the second pentad when compared with the first 5 years (1991-1995) as seen in Figure 10a and b. Maximum thunderstorm occurrence in the first and second pentads was highest in the coast, but reduces inland, as latitude increases.
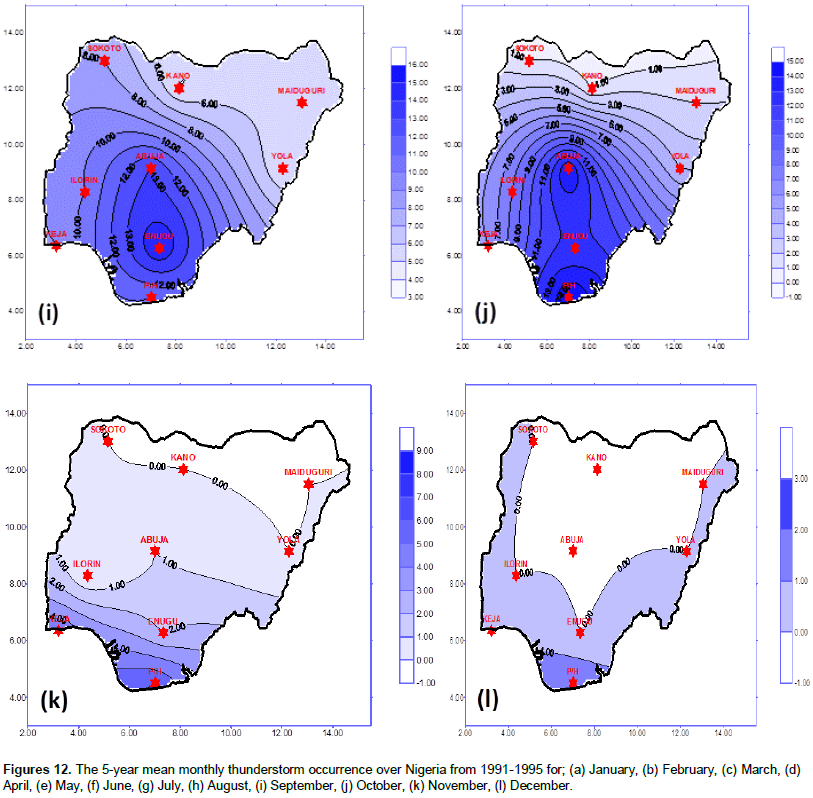
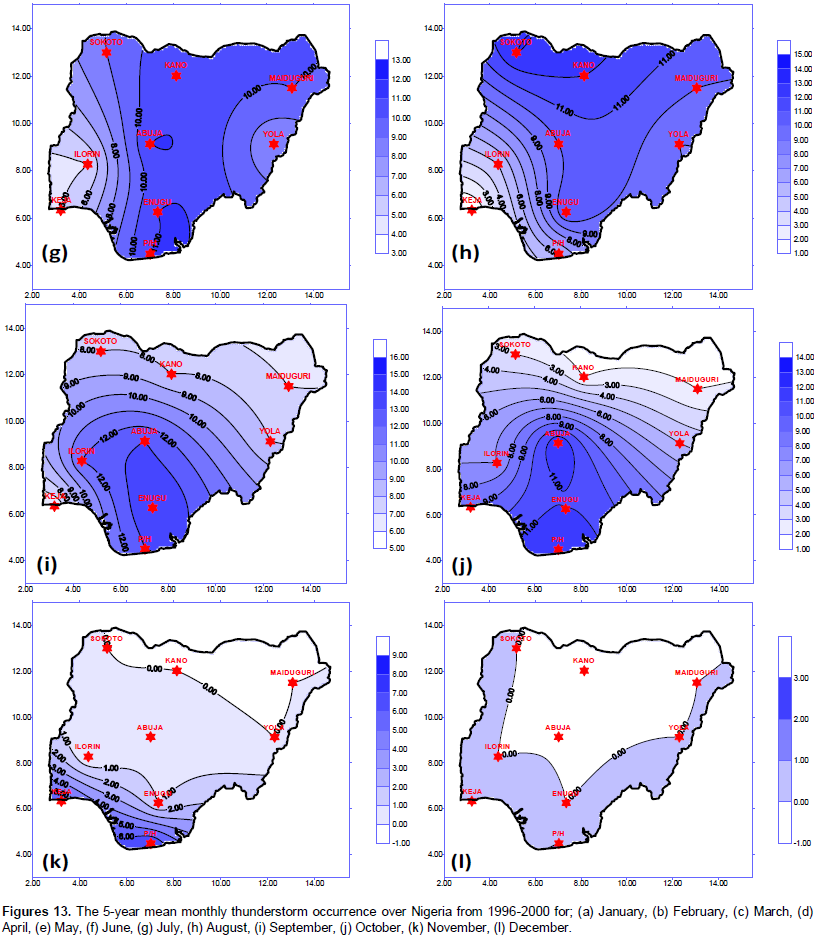
However, on the seasonal basis; the five-year monthly average of the frequency of thunderstorms showed that January, February, March, June and September (Figure 13a, b, c, f and i) of the second 5-year mean (1996-2000) recorded an improvement in the system compared to the previous (1991-1995) 5-year mean monthly frequency of thunderstorms. In the second pentad, there was an improvement in the spatial coverage of thunderstorm activity in the country which was more predominant over the south-western region of the country with a marked reduction over Sokoto and Maiduguri in the Sahel region while the first 5-year average experienced most of the
activities over the south-south region.
July and October (Figure 13g and j) of 1996-2000 recorded a reduction in the frequency of thunderstorm from what was obtainable in the previous pentad of 1991-1995, but the month of August showed a shift in the maximum thunderstorm activity (MTA) from the south-eastern region (Figure 12h) between 1991 and 1995 to the extreme northern part of the country (Figure 13h) within 1996 and 2000. However, there was no significant change in the frequency of thunderstorms in November and December of the two pentads considered.
Temporal and seasonal variation
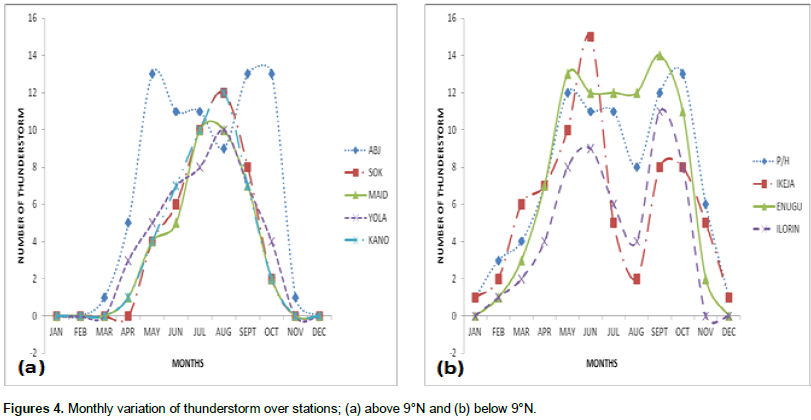
In August, double maxima could be seen over all the stations that are south of 9°N except Enugu (lat. 6.28°N and long. 7.33°E) which experiences a reduced thunderstorm activity that is not significant enough to have shown the feature of double maxima of thunderstorm activities like other stations within the defined latitude (Figure 4b). Also all stations north of 9°N have been observed to be experiencing a single maximum of thunderstorm activities except Abuja (lat. 9.15°N and long. 7.00°E) whose thunderstorm activities show double maxima (Figure 4a). This is in line with results of (Balogun, 1981 and Okuma, 2001) who however, made use of a bench mark of 7°N to delineate the nation, while Omotosho (1988) used 10°N to delineate the country.
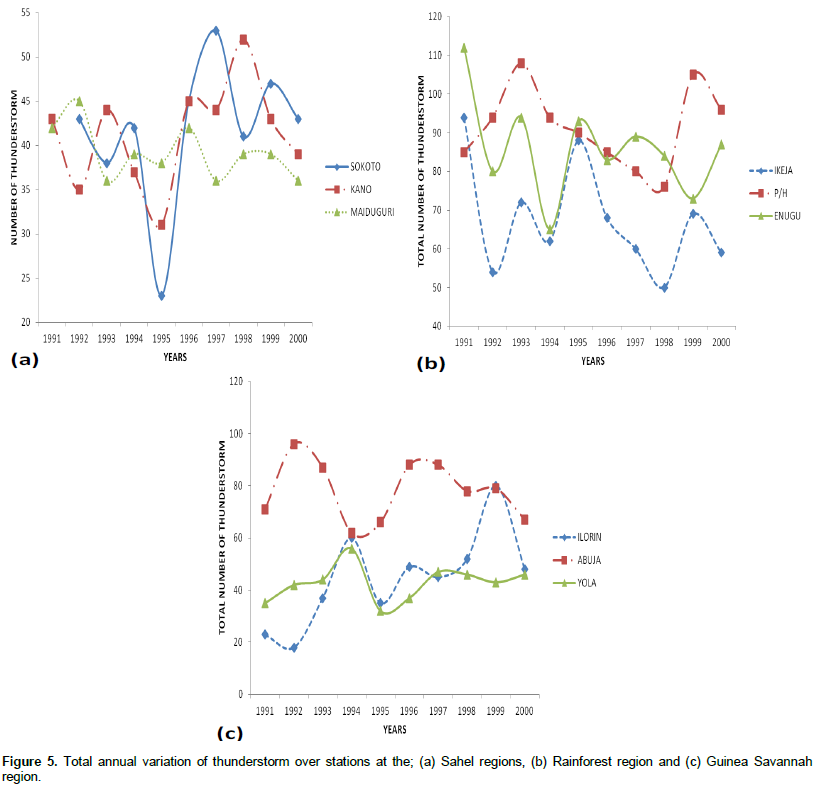
Over all the stations in the Sahel region, the total number of thunderstorms ranges between 35 and 45, except in 1995 and 1997, when Sokoto and Kano experienced a sudden decline and increase in the number of thunderstorm, respectively (Figure 5a). However, over the rainforest region, all the stations show a gradual reduction in the total number of thunderstorm activities until 1998 when Ikeja and Port Harcourt started increasing, while Enugu started experiencing increase in thunderstorm activities in 1999 (Figure 5b).
Over the Savannah region, it can be deduced that Yola and Ilorin are having the same increasing thunderstorm trend; and this can also be seen on the spatial distribution maps, whereas, Abuja was observed to be having a decreasing trend (Figure 5c).
Inter-seasonal variation
With Abuja (above 9°N) experiencing double maxima and Enugu (below 9°N) experienced a single minimum, it can
be seen that the weather over tropical Nigeria does not strictly follow latitudinal divides. And it is safe to say that there are other local factors that influence its formation.
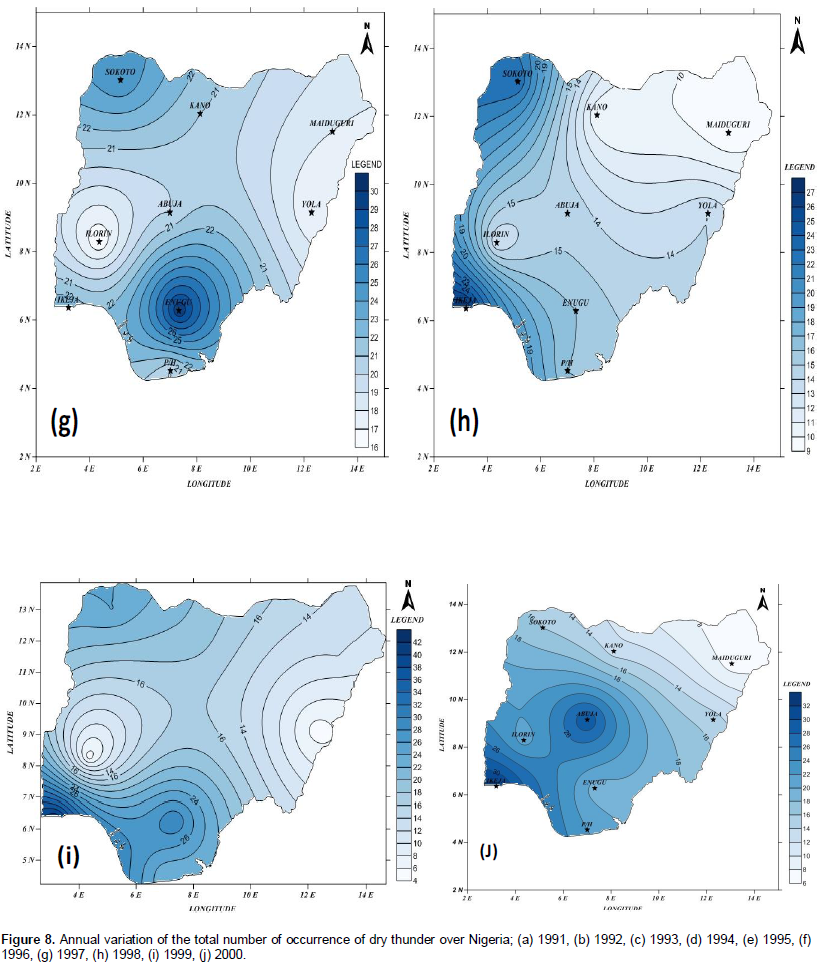
Dry thunderstorm
Inter-seasonal variation
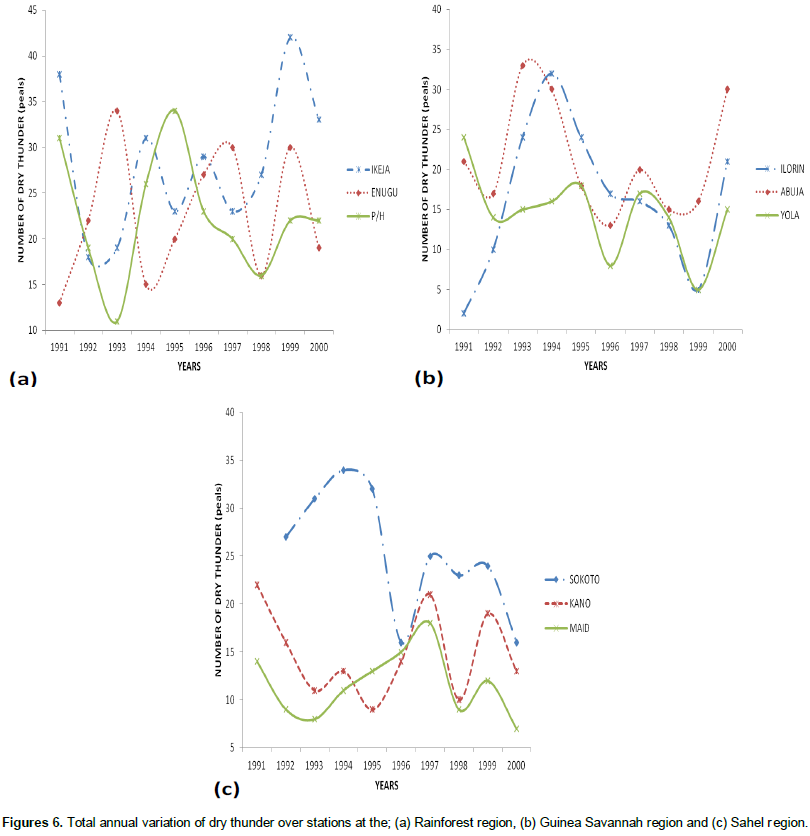
While both Enugu and Port Harcourt are experiencing a gradual reduction in the number of dry thunderstorm occurrence, Ikeja had a sudden increase from 1997 to 1999 (Figure 6a). The number of dry thunderstorm activity is more predominant over the western part of the country than over the eastern part when viewed longitudinally (Sokoto, Ilorin, Ikeja and Abuja) (Figures 6a-c). There is a general decreasing trend in the number of dry thunderstorm occurrence over the Savannah region until in 1999, when there was a sudden increase in the dry thunderstorm frequency in all the stations (Figure 6b). All the stations over the Sahel region showed decreasing trends from 1991-1995 and 1997-2000, but there was an increase in the frequency of occurrence of thunderstorm activities in 1996, over Kano and Maiduguri (Figure 6c).
Comparison between thunderstorm and dry thunder frequency
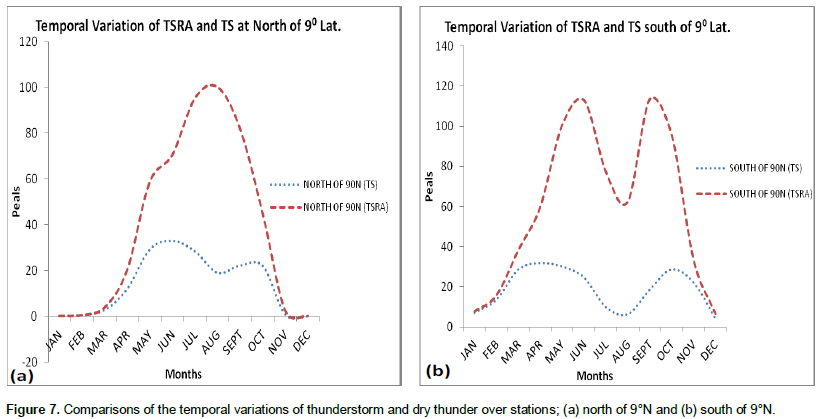
Stations north of 9°N showed a single maximum in thunderstorm frequency while the dry thunderstorm showed a double maximum (though, not really significant). Also, it can be seen that stations that are south of 9°N have double maxima both by thunderstorm and dry thunder frequencies (Figure 7a and b).
CONCLUSION
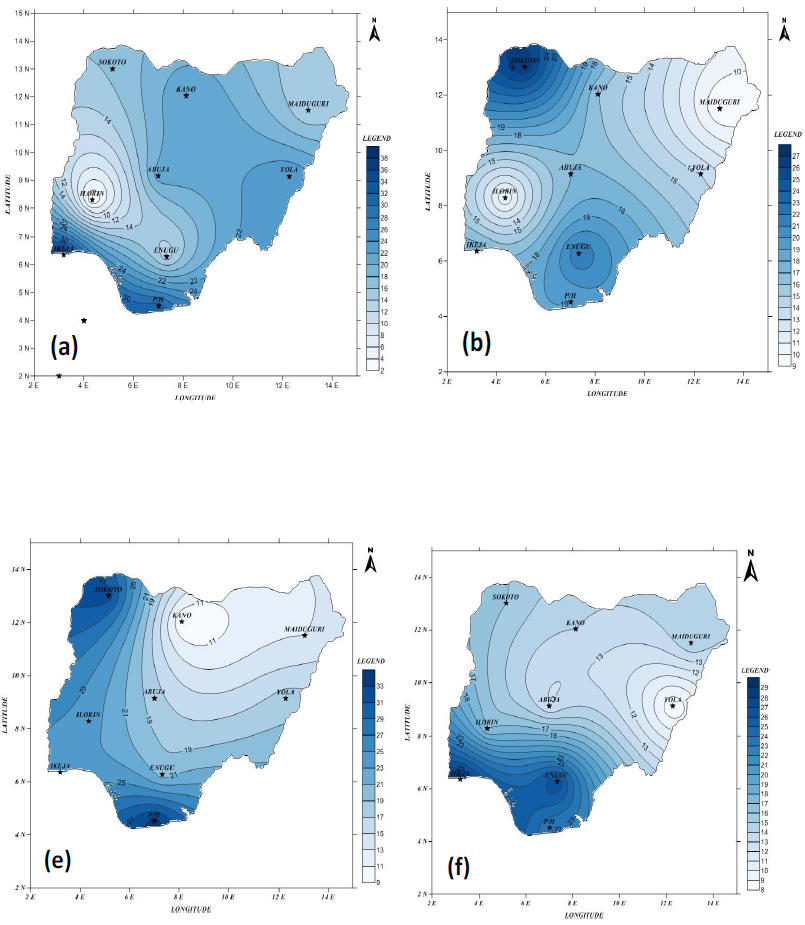
In this study, the seasonal, inter-seasonal and spatial variations of thunderstorm frequency over a tropical region, Nigeria, was investigated. It was observed that the maximum thunderstorm and dry thunder frequencies are predominant over the central and western parts of Nigeria, respectively. However, while the isoceraunic lines of maximum dry thunder activities show no well defined pattern, the isoceraunic lines of maximum thunderstorm activities (MTA) decreases from the coast towards the inland regions as latitude increases. During July/August months, two areas of MTA were observed; Enugu and Kano, which are sandwiched by a belt of reduced thunderstorm activities (RTA; 8- 10°N).
Furthermore, over the Sahel region, it has been observed that the occurrence of thunderstorm tends to be greatly reduced over Maiduguri than over Sokoto, which could be the reason for the existence of a more severe desert encroachment from the north-eastern side of the country than it is over the north-western side. The existence of a latitudinal belt of reduced thunderstorm activities has been observed to be between 7.6-10.4°N in August, while the little dry season belt which was earlier stated to be between 10°W-9°E has been found to be limited to 7°E.
REFERENCES
|
Adefolalu DO (1972). "On the mean Equivalent Potential temperature of the tropical Atmosphere and the 'Little Dry season' of West Africa", Niger. Q. Meteorol. Mag. 2(1): 15- 40. |
|
|
Adekoya JO (1979). "Little dry season in West Africa", MSc. Thesis, Dept. of Meteorology, Florida State University, USA. Unpublished. |
|
|
Adelekan IO (1998). "Spatio-Temporal Variations in Thunderstorm Rainfall over Nigeria". Int. J. Climatol. 18:1273-1284. |
|
|
Ahrens DC (2000). "Meteorology Today: An Introduction to Weather, Climate and the Environment", 6th ed., Brooks/Cole. pp. 381-388. |
|
|
Anne-Duncan P (2010). Thunderstorm and their associated Hazards. Niger. Geographers 16(2):167-176. |
|
|
Balogun EE (1981). "Seasonal and Spatial Variations in Thunderstorms Activity over Nigeria". Weather 36(7):192-197. |
|
|
Biggerstaff MI, Houze Jr. RA (1993). "Kinematics and Microphysics of the Transition Zone of a Midlatitude Squall-line System". J. Atmos. Sci. 50:3091- 3110. |
|
|
Changnon SA (2001a). Thunderstorm Rainfall in the Contaminous United States", Bull. Am. Metorol. Soc. 82(9):1925-1940. |
|
|
Changnon SA (2001b). "Damaging Thunderstorm Activity in the United States". Bull. Am. Meteorol. Soc. 82:597-608. |
|
|
Enete IC, Ajator U, Nwoko KC (2015). Impacts of Thunderstorm on Flight Operations in Port-Harcourt International Airport. Int. J. Weather Climate Conserv. Res. 1(1):1-10. |
|
|
Houze RA Jr. (1993). Cloud Dynamics. Academic, San Diego, California. 573 p. |
|
|
IFRC (2012). International Federation of Red Cross and Red Crescent (IFRC) disaster relief emergency team report of 2012. |
|
|
Ireland AW (1962). "The Little Dry season of Southern Nigeria", Nigeria Meteorological Service Technical Note. 24p. |
|
|
Kingsmill DE, Wakimoto RM (1991). "Kinematic, Dynamic and Thermodynamic Analysis of a Weakly Sheared Severe Thunderstorm over Northern Alabama Mon. Weather Rev. 119:262- 297. |
|
|
Obasi GOP (1974). Some statistics concerning the disturbances lines of West Africa. Symposium Tropical Meteorology, Part II, Nairobi. pp. 52-66. |
|
|
Ologunorisa ET (1999). "Diurnal and Seasonal Variation of Thunderstorm in Ondo State Nigeria". Geo. Res. 2(2):47-51. |
|
|
Ologunorisa ET, Alexander BC (2004). "Annual Thunderstorm Trends and Fluctuations in Nigeria", J. Meteorol. UK, 29(286):39–44. |
|
|
Ologunorisa ET, Alexander BC (2007). "The Diurnal Variation of Thunderstorm Activity over Nigeria". Int. J. Met. UK, 32(315):19–29. |
|
|
Omotosho JB (1983). Prediction of maximum gusts in West African line squalls. Niger. Metereol. J. 1:94-100. |
|
|
Omotosho JB (1984). Spatial and seasonal variation of line squalls over West Africa. Arch. Metereol. Geophs. Bioclimatol. Ser. A33:143. |
|
|
Omotosho JB (1985). "The Separate Contributions of Line Squalls, Thunderstorms, and the Monsoon to the total Rainfall in Nigeria". J. Climatol. 5:543-552. |
|
|
Omotosho, J.B., (1987): Richardson number, vertical wind shear and storm occurrences at Kano, Nigeria. Atmos. Res., 21:123-137. |
|
|
Omotosho JB (1988). "Spatial Variation of Rainfall in Nigeria During the 'Little dry Season'". Atmos. Res. 22:137-147. |
|
|
Omotosho JB (2008). "Pre-rainy Season Moisture Build-up and Storm Precipitation Delivery in the West African Sahel". Int. J. Climatol. 28:937-946. |
|
|
Orisakwe IC (2015). "Disaggregation and Quantification of Rainfall Associated with the three Rainfall Producing Systems in Nigeria". Unpublished M. Tech Thesis, FUTA, Nigeria. 47pp. |
|
|
Smull BF, Houze RA, Jr. (1987). "Dual-Doppler Radar Analysis of a Midlatitude Squall Line with a Trailing Region of Stratiform Rain". J. Atmos. Sci. 44:2128-2148. |
|
|
Smull BF, Augustine JA (1993). "Multiscale analysis of a mature mesoscale convective complexes". Mon. Weather Rev. 121:103- 132. |
|
|
Yang M, Houze RA (1994). "Multicell Squall Line Structure As A Manifestation Of Vertically Trapped Gravity Wave ." Sixth conference on Mesoscale Processes, Portland, AMS. pp. 619-622. |
|
Copyright © 2024 Author(s) retain the copyright of this article.
This article is published under the terms of the Creative Commons Attribution License 4.0


