Full Length Research Paper

ABSTRACT
Climate change has the potential to affect hydropower generation by either increasing or reducing flows (discharge) and the head. This paper assessed the impacts of climate change on hydropower generation with a focus on Lujeri micro-hydropower scheme in Mulanje district, Malawi. The study analyzed trends in weather time series (air temperature and rainfall) data from 1980 to 2011 in connection to changes in river discharge and their associated impacts on hydropower generation profile. The Mann-Kendall (MK) test was used to detect trends in air temperature, precipitation and discharge. Correlation analysis was also used to uncover the relationship between discharge and precipitation as well as between discharge and temperature. The MK results highlighted significant rising rates of air temperature, precipitation and discharge in some months and decreasing trend in some other months, suggesting significant changes have occurred in the area. The relationship between precipitation and discharge was not significant (p = 0.552), while that between temperature and discharge was significant (p = 0.0001). Therefore, as temperature showed significant increasing trend, it will be associated with decrease in discharge, consequently a decrease in hydropower generation (power is directly proportion to discharge). Hence, proper adaptation measures such as standby alternative sources of energy and storage mechanisms devices should be exploited to ensure electric power is available throughout the year, especially in the hot and dry season when the discharge is usually very low.
Key words: Climate change, discharge rate, hydropower, Malawi, precipitation, temperature.
INTRODUCTION
Environmental change, manifested by climate change and variability, is no longer a mythical discourse; the scientific consensus is not only that, human activities have contributed to it significantly, but the change is far more rapid and dangerous than thought earlier (IPCC, 2007a). Climate change and variability are now becoming one of the significant development challenges due to shift in the average patterns of weather. While climate change results from activities all over the globe, with rather unevenly spread contributions to it, it may lead to very different impacts in different countries, depending on local, regional environmental conditions and differences in vulnerability to climate change (UNEP, 2002). The Millennium Ecosystem Assessment (2005) shows that, in all ecosystems of the world, the climate changes impacts are rapidly increasing, such as, on water resources, environmental services and other livelihoods capital assets for sustainable human development. Thus, as also attested by Dhakal (2011) that the energy sector is one of the major users of water resources, climate change will particularly affect the temperature, precipitation and flow regime and consequently, hydropower generation.
Hydropower is power derived from the force or energy of moving water which is harnessed for useful purposes. Prior to the widespread availability of commercial electric power, hydropower was used for irrigation and operation of various machines, such as watermills, textile machines, sawmills, dock cranes and domestic lifts (Kreis and Steven, 2001). With the invention of electric generators, hydropower was a natural source of power for such generators in generating electricity according to the following power equation:

Where P is power output (W), ρ is the density of water (kg/m3), g is the gravity (m/s2), η is turbine efficiency (%), Q is the discharge rate (m3/s) and H is the head (m). In addition to the fact that hydroelectricity emits near-zero emissions, Jain (2011) highlighted that hydropower is a proven, mature, efficient and cost competitive renewable energy source. Hydropower requires relatively high initial investment but has low operation costs and it offers a hedge against volatile energy prices. Harrison et al. (1998) argued that exploitation of hydropower potential is considered by many governments and international bodies to be a key feature in economic development, especially in less developed countries.
The amount of electricity to be produced by a hydropower facility will mainly depend on the volume of water passing through the turbine in a given amount of time, the water head and the efficiency of the turbine. While many of the variables on the power equation will usually be fixed for a particular hydropower facility, the fluctuations in the quantity and timing of river discharge rate affects much the production of hydroelectric power. The discharge rate is in turn affected by seasonal and quantitative changes in precipitation and evapotranspiration (Koch et al., 2011).
Hydropower is clearly among the most vulnerable areas to global warming because water resources are closely linked to climate changes (Pathak, 2010). Since climate change will certainly increase global air temperature, considerable regional impacts on the availability of water resources will occur concerning quantity and seasonality (IPCC, 2007b). At first glance, increased global precipitation would appear to suggest more water available for hydroelectric power production. However, higher temperatures will lead to increased evapotranspiration levels thus reducing the runoff (Harrison et al., 1998). Therefore, hydropower vulnerability to climatic conditions has a profound effect on its generation. Consequently, this is more critical to energy security for a country such as Malawi which sorely depends on hydropower for its electricity production.
Nearly all of Malawi’s electricity is provided by hydropower from a cascaded group of interconnected hydroelectric power plants located on the Shire River and a mini-hydro on the Wovwe River, which constitute the interconnected system. Total installed capacity of these hydropower plants is 351 MW. However, changes in power demand scenarios within the past years, coupled with tremendous environmental degradation in Malawi has drastically negatively affected the operation and the efficiency of the existing power generation plants. This has forced the government to re-examine its power development options in the short and medium term. As one of its key strategy, the government plans to construct more hydropower stations along the major rivers of the country.
Nevertheless, hydropower will be impacted by climate change in a varying degree depending on the region and hydropower type; thereby run-of-river power plants as well as reservoir hydropower plants will be affected (Koch et al., 2011). Africa at large and southern Africa in particular, will be the most affected part of the world due to lack of adaptation and mitigating measures (IPCC, 2001). Similarly, according to Hamududu and Killingtveit (2006), the East and Southern African countries have a climate that is highly variable, unreliable and unpredictable. These impacts will directly affect hydroelectric production and have the potential to make hydropower either more or less vulnerable because it may lead to timing mismatch between energy generation and demand. As hydropower is the major source of electricity in Malawi, impacts on hydropower production would lead to serious disruptions in the energy infrastructure.
Study area (Lujeri micro hydropower scheme)
Lujeri Tea Estates grows and processes high quality tea on its estates under the imposing Mount Mulanje, the highest point in Malawi. Its tropical location and superior cultivar plant varieties produce excellent quality teas that are unusually high in health promoting anti-oxidants. Tea was first planted on the estate in the late 19th Century.
Electricity is required to run the machines in the factories as well as the estate's irrigation pumps and Lujeri is able to provide approximately 30% of its electricity requirements from the two micro hydroelectric power plants it owns and operates on the estate. These power plants are constructed on two rivers, Ruo and Lujeri River that run through the estate and this study was done on a plant constructed on Ruo River (which houses three turbines referred to as Ruo 1, 2 and 3). Both plants were commissioned in the 1930's. The closed circuit system of water reticulation returns all the water to the river from the two power stations. This makes the system eco-friendly as well.
The Ruo River (with a catchment area of about 4900 km2) rises on the slopes of mount Mulanje (the southern portion of the eastern Shire Highlands) and is the largest tributary of Shire River. It flows through Mulanje district and also forms part of the Malawi-Mozambique border before joining with the Shire River. The power plant is located at the base of the Mulanje Mountain as shown in Figure 1.
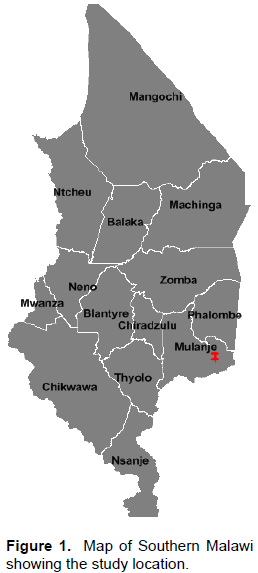
Mulanje District is located approximately 65 km east of Blantyre district and is named after the highest Mountain in the South-Central Africa. The district local weather conditions are greatly influenced by the Mulanje Mountain and the climate is also partly affected by Chiperoni winds causing high rainfall on the windward (South East side of the Mulanje Mountain) while limiting it on the leeward side (Taulo et al., 2008). The average annual rainfall is 1600 mm and the average minimum annual temperatures ranges from 21 to 23°C and the maximum temperatures of about 32 to 35°C (Haarstad et al., 2009). Taulo et al. (2008) also noted that one most distinctive feature of Mulanje climate is the variation of rainfall over short distances, a characteristic attributed to the influence of Mulanje Mountain.
MATERIALS AND METHODS
The impact of climate change can be visualized in terms of changes in temperature, shift in weather pattern, rainfall distribution which have impact on the intensity of discharge and water accumulation in reservoir as well as the activities and natural phenomenon taking place in its catchment area (Dhakal, 2011). Generally, the study analyzed changes in recent weather time series (monthly and seasonal air temperature and rainfall) data from 1980 to 2011 in connection to changes in river discharge and their associated impacts on hydropower generation profile. The precipitation and temperature data used in this study was kindly provided by the Department of Climate Change and Meteorological Services and the discharge data by Water Department in the Ministry of Agriculture, Irrigation and Water Development. The discharge data used was from 1959 to 1990 because of unavailability of recent data. Pre-quality analyses of the data were done by the departments.
The recent trend of climate changes taking place in Mulanje
The precipitation and temperature data was used to analyze the changes in climate in Mulanje district over the years. The Mann-Kendall (MK) test was used to detect if any statistically significant trends exist in the data. This test, MK, is a powerful non-parametric method tool for analyzing long time series data such as precipitation, temperature and discharge. Under the null hypothesis (H0), the assumption is that there is no trend in the data and the alternative hypothesis (H1) carries the assumption that there is an increasing or decreasing trend over time. The mathematical computational for the MK test statistics S, Var (S) and the standard test statistic ZS were calculated as follows:
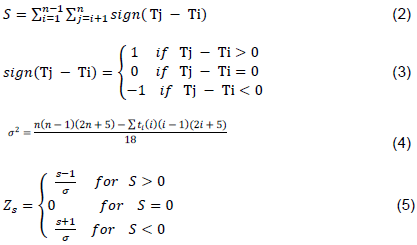
where Tj and Ti are the actual time series observation data, n is the period of the time series data, ti denotes the number of ties up to sample i. The test statistic ZS follows normal distribution and was used as a measure of significance of trend. Positive and negative values of ZS signify an increase and decreasing trend, respectively. A significance level α is used to test if the null hypothesis (increase or decreasing) trend exist. If ZS is greater than Zα/2, the null hypothesis is rejected implying that the trend is statistically significant. The chosen significance level for this study was 1.96 for p-value of 0.05. However, before running a MK trend test, autocorrelation was considered to remove the serial dependence of the time series data that would cause problems in testing of data and interpretation of results, according to the method proposed by Yue and Wang (2004).
The factors influencing discharge rates of Ruo River
The discharge rates are determined by factors such as climate, vegetation, soil type, drainage basin relief and the activities around the river basin such as farming. However, the study focused mainly on precipitation and temperature as the principle driver contributing to changes in discharge because of the limited availability of data to investigate the other variables. To accomplish this objective, the Pearson product moment correlation was used to uncover the relationship between discharge and precipitation as well between temperature and discharge. The correlation analysis used the formula presented in Equation 6:

Where: x is the independent variable (precipitation/temperature), y is the depended variable (discharge) and n is the number of data pairs.
Power analysis
The study used estimated potential power because the owners of the plant do not regularly keep records of monthly average data on the amount of power generated from the plant. The study therefore adopted Equation 1 to estimate the potential power generated from the plant using observed monthly average discharge data. The machines at the plant are all Pelton turbines which have a world reputation of reaching efficiencies of about 90%. Nonetheless, old installation of the machines and inadequate in maintenance of hydropower station could drastically affect the efficiencies of these turbines. Similarly, several losses are also encountered during the conversion of potential and kinetic energy of water to electricity but typically hydropower turbines efficiencies range between 60 and 90% (Meijer et al., 2012). Hence, an average efficiency of 70% was assumed in this study to show a more realistic first impression of potential hydropower. Finally, the hydropower plant rated net head (for Ruo 1 and 2 is 365 m while for Ruo 3 is 355 m) was used in the calculations. The estimated potential generated power was analyzed using simple graphs in order to evaluate the changes in the annual average generated power and to depict the maximum average generated power in each month of the year.
RESULTS AND DISCUSSION
Recent climate trends
Recent climate trends were analysed by looking at changes in annual rainfall distribution and temperature overtime.
Annual rainfall variation
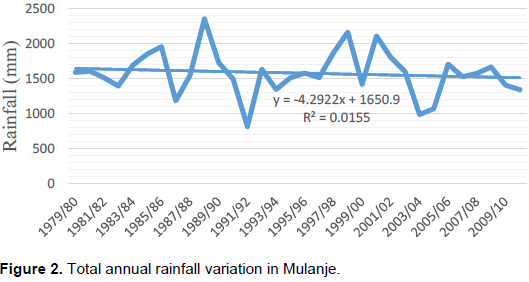
Projected precipitation over Malawi shows inconsistence among different Global Circulation Models (GCMs), with some models projecting increase and others projecting decrease in rainfall. Whereas, the 31 years of average annual rainfall data (1980 to 2011) in this study showed that the average annual rainfall of Mulanje is decreasing at the rate of about 4.29 mm per year (Figure 2). This is in agreement with the observation by MoNRE (2011) that the general trend is that the mean monthly rainfall will decrease with time. From this analysis, the maximum occurrence of rainfall occurred in 1988/89 season and the minimum rainfall occurred in 1991/92 season with total precipitation of 2356.5 and 811.2 mm, respectively. It was these years, 1991/92, when Malawi experienced severe drought across all regions of the country. It can also be observed from the results that the average rainfall is 1631.1 mm for the 31 year period, representing an average of about 135.9 mm of precipitation per month. However, Vincent et al. (2014) reported that the amount of rainfall in southern Malawi is between 150 and 300 mm per month and hence that for Mulanje is below this range. Bulckens (2013) also attested that rainfall in Mulanje district has decreased from an average of 2000 mm in 1960 to about 1500 mm in 2012. This clearly shows that there is a decline in annual rainfall distribution for period 1980 to 2011 and more analysis needs to be done to see whether this trend will continue.
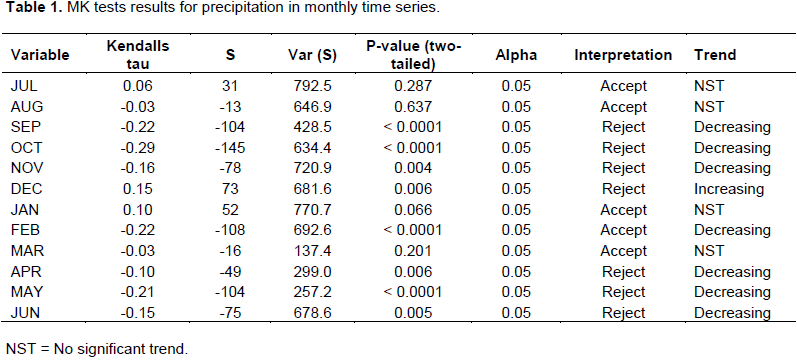
In order to detect if the trends in the precipitation were significant, the Mann-Kendall (MK) test was applied on a monthly scale for the entire 31 years period. The summary results of non-parametric MK test for trend analysis of data are presented in Table 1. The results for monthly trend tests showed a mix of positive and negative trends with January, July and December depicting a positive trend and the rest of the months of the year showing negative trend. The increasing trend in precipitation for December was statistically significant (p = 0.006). Significant negative trend were detected in the months of February, April, May, June September, October and November; no significant trends were found for the other months. The significant decrease of precipitation in October and November confirms the observation by many studies that the rains are shifting towards December (Action Aid, 2006; Magrath and Sukali, 2009; USAID, 2013).
Temperature
The temperature data from 1980 to 2010 was also analyzed. Figure 3 shows that both mean monthly minimum temperature and mean monthly maximum temperature for Mulanje is increasing by about 0.04°C every year. Phiri et al. (2004) also observed (as cited in ActionAid, 2006: 5) that mean temperatures in the lower Shire had increased by 2.3% while mean maximum temperatures increased by 2% between 1970 and 2002. Meanwhile, the period 1960 to 2006, McSweeney et al. (2011) observed that mean annual temperature has increased by 0.9°C,an average rate of 0.21°C per decade.
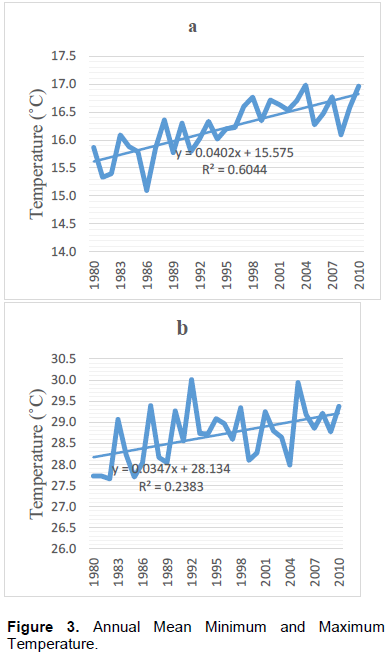
Therefore, temperature projections for Malawi are mainly consistent, with all GCMs results predicting significant increase in temperature. The observation from the temperature analysis done here also shows consistency with the GCMs. This increase in temperature has also been perceived by villagers in a Participatory Rural Assessment (PRA) study (Magrath and Sukali, 2009; USAID, 2013) and the results highlighted warming temperatures as one of the most visible impacts of climate change in Malawi.
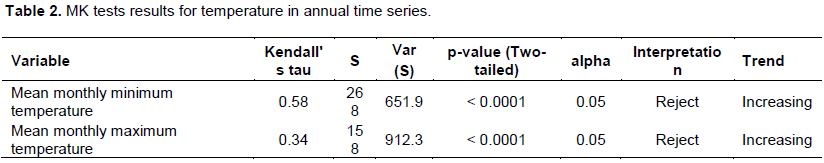
On running the MK test on mean monthly and mean maximum temperature data to detect if there is a trend in the 30 years period, the following results in Table 2 were obtained. The results indicate that there is significant increasing trend for both mean monthly and mean maximum temperature. Therefore, further impacts asso-ciated with the increasing temperature in Mulanje district should be considered.
Discharge analysis
Monthly discharge and annual discharge
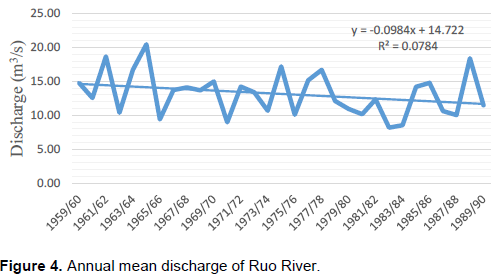
The Ruo River hydrological data from 1959 to 1990 (station 14C2) was collected and analysed. On plotting a linear trend line for the 31 years data, the annual mean discharge indicates that the Ruo discharge is decreasing at a rate of 0.09 m3/s every year as shown in Figure 4. This result is in alignment with the annual rainfall distribution which has also indicated a decreasing trend over the years. It was also observed that the minimum mean discharge was 8.17 m3/s and occurred in 1982/83 rainy season. The year 1982/83 rainy season precedes the drought that occurred in 1981/82 season which had affected many areas in Malawi (MoNRE, 2011). It has been noted that the quantity of surface water resources in Malawi’s river systems is highly dependent on runoff from rainfall and thus water resources are usually more abundant during the rainy season than the dry season (MoNRE, 2002). However, while attributing that data collection on the rivers flowing from the Mulanje Mountain is inadequate, Nangoma (2008) observed the rivers runoffs are no longer reliably and depict flow irregularity. If the decreasing trend of Ruo discharge is to go on it will have a negative impact on life activities that depends on and thus the trend needs to be researched further.
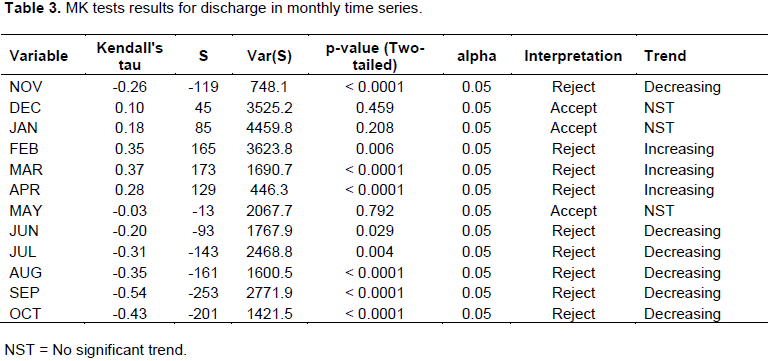
On the other hand, a mix of decrease and increase trend were obtained when the MK test was run to detect trend in monthly discharge. The results indicated that there was a positive trend in discharge in the months of January, February, March, April and December and all these months correspond to the rainy season. The increase in trend was significant for February, March and April. The results also indicated a statistically significant negative trend in discharge for the rest of the months of the year apart from May. The MK tests results for discharge in monthly time series are shown in Table 3. Therefore, it is of immense importance based on these results to look further on the impacts such as ecological, economical as well as social that would result if the decreasing discharge trends are to continue in future.
Rainfall and discharge relationship
One factor that affects discharge is the amount of rainfall. The relationship between the mean annual rainfall and mean annual discharge was investigated using Pearson product-moment correlation coefficient. It was assumed that the sample is of normality, linearity and homoscedasticity. Therefore, preliminary analyses were performed to ensure no violation of the assumption of normality, linearity and homoscedasticity. The results indicated a small, positive correlation between the rainfall and discharge, with r = 0.111, n = 31, p = 0.552. These results therefore show that as the amount of rainfall will be increasing, it will be associated with increase in the amount of river discharge and vice versa. However, the increase is not statistically significant as P-value is greater than 0.05. Hence, the results strongly suggest that other variables other than rainfall have major influence on discharge.
Temperature and discharge relationship
Similarly, temperature is another factor that may affect discharge. To understand the relationship between temperature and discharge, the mean annual maximum temperature and mean annual discharge was investigated using Pearson product-moment correlation coefficient. It was also assumed that the sample is of normality, linearity and homoscedasticity. Therefore, preliminary analyses were performed to ensure no violation of the assumption of normality, linearity and homoscedasticity. It was observed from the results that there is a large, negative correlation between the temperature and discharge, with r = - 0.604, n = 31, p = 0.0001. The relationship between these two variables is statistically significant. This means that with any increase in temperature, it will be associated with decrease in the amount of river discharge. As it has been observed that temperature is increasing in the area (Figure 3), this will lead to further reduction in discharge.
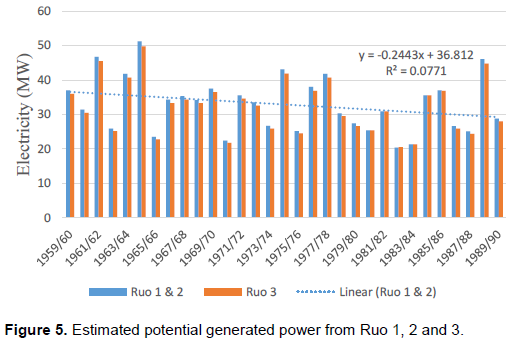
Power generated
The potential monthly distribution of power generated from the plant was estimated by using Equation 2 and the results are shown in Figure 5. The trend for the annual distribution of potential generated power was also established. The results indicate that annually, the power generated will be decreasing by around 0.24 MW every year and this will have a negative impact on the operations of Lujeri Tea Estate. However, the actual power generated may likely be lower than the estimated results found in this analysis due to inadequate maintenances of the machines and that they were installed in early 1930’s. It can also be observed that the pattern for this estimated potential power is analogous to Figure 5 since the annual mean discharge were used in the calculations. Therefore, the MK tests results for monthly discharge will play a greater role in the power that will be generated in future.
CONCLUSION
Climate change has the potential to affect hydropower generation by either increasing or reducing flows (discharge) and the head. This paper assessed the impacts of climate change on hydropower generation with a focus on Lujeri micro-hydropower scheme in Mulanje district, Malawi. The study analyzed trends in weather time series (air temperature and rainfall) data from 1980 to 2011 in connection with changes in river discharge and their associated impacts on hydropower generation profile. The Mann-Kendall (MK) test was used to detect trends in air temperature, precipitation and discharge. Correlation analysis was also used to uncover the relationship between discharge and precipitation as well as between discharge and temperature.
The MK results for monthly precipitation trend tests showed a mix of positive and negative trends with January, July and December depicting a positive trend and the rest of the months of the year showing negative trend. The increasing trend in precipitation for December was statistically significant (p = 0.006). Significant negative trend were detected in the months of February, April, May, June September, October and November; no significant trends were found for the other months; while the MK results on temperarture indicate that there is significant increasing trend for both mean monthly and mean maximum temperature. On the other hand, a mix of decrease and increase trend was obtained when the MK test was run to detect trend in monthly discharge. The results indicated that there was a positive trend in discharge in the months of January, February, March, April and December and all these months correspond to the rainy season. The increase in trend was significant for February, March and April. The results also indicated a statistically significant negative trend in discharge for the rest of the months of the year apart from May.
The annual rainfall distribution analysis showed a general decreasing trend with time. However, this annual rainfall change is not significant on the annual discharge. Hence, this could mean that there is no significant change in the annual hydroelectricity generated. Nevertheless, the analysis on the potential generated power revealed that there is a significant decrease in power annually. This is mainly attributed to the change in temperature. The relationship between the two variables (temperature and discharge) is significantly negatively correlated thus as temperature increases it will be associated with decrease in discharge. The analysis of temperature showed an increasing trend. Thus, the warmer temperatures will lead to increased evapotranspiration in the rivers and in turn reduce discharge. As discharge is directly proportion to power generated, hence changes in climate will have a direct impact on hydropower thereby affecting hydropower generation. Therefore, proper adaptation measures such as standby alternative sources of energy, storage mechanisms devices and storage hydropower schemes should be exploited to ensure electric power is available throughout the year, especially in the hot and dry season when the discharge is usually very low.
CONFLICT OF INTERESTS
The author has not declared any conflict of interests.
ACKNOWLEDGEMENT
This study was financed by the Scottish government through the University of Stathclyde and University of Malawi-Polytechnic.
REFERENCES
|
ActionAid (2006). Climate change and smallholder farmers in Malawi: Understanding poor people's experiences in climate change adaptation. |
|
|
Dhakal M (2011). Climate Change Impacts on Reservoir based Hydropower Generation in Nepal: A case study of Kulekhani Hydropower Plant (Master thesis, Pokhara University, Nepal). Retrieved from |
|
|
Harrison GP, Whittington HW, Gundry SW (1998). Climate Change Impacts On Hydroelectric Power. InPROC UNIV POWER ENG CONF. 1998 Sep 1:391-394. |
|
|
Haarstad J, Jumbe CBL, Chinangwa S, Mponela P, Dalfelt A, Disch A (2009). Environmental and Socio-Economic Baseline Study – Malawi. Norwegian Agency for Development Cooperation. |
|
|
Hamududu B, Killingtveit A (2006). Climate change impacts on Regional Runoff & Hydropower; the Case for East and Southern Africa. Retrieved from |
|
|
IPCC (2001). Climate Change 2001: Impacts, adaptation and vulnerability. Contribution of Working Group II to JJ McCarthy, OF Canziania, NA Leary, DJ Dokken and KS White. Cambridge, Cambridge University Press for Intergovernmental Panel on Climate Change. |
|
|
IPCC (2007a). Climate Change: The Physical Science Basis: Summary for Policy Makers, Paris: IPCC, WMO, 2007. |
|
|
IPCC (2007b). Climate Change: The Physical Science Basis; Contribution of Working Group I to the Forth Assessment Report of the Intergovernmental Panel on Climate Change; IPCC: Cambridge, UK. |
|
|
Jain SK (2011). Climate Change and Hydropower Generation. Paper presented at IITD-CSE Conference, New Delhi. |
|
|
Koch F, Prasch M, Bach H, Mauser W, Appel F, Weber M (2011). How Will Hydroelectric Power Generation Develop under Climate Change Scenarios? A Case Study in the Upper Danube Basin. Energies 4:1508-1541. |
|
|
Kreis and Steven (2001). The Origins of the Industrial Revolution in England, The history guide. |
|
|
Magrath J, Sukali E (2009). The winds of change: Climate change, poverty and the environment in Malawi. Oxfam International. |
|
|
McSweeney C, New M, Lizcano G (2011). UNDP Climate Change Country Profiles: Malawi. |
|
|
Meijer LJJ, van der Ent RJ, Hoes OAC, Mondeel H, Pramana KER, van de Giesen NC (2012). World Hydropower Capacity Evaluation. |
|
|
Millennium Ecosystem Assessment (MA) (2005). International scientific assessment: ecosystem changes and human well-being. |
|
|
Ministry of Natural Resources and Environmental Affairs (MoNRE) (2002). Initial National Communication to the Conferences of Parties of the United Nation Framework Convention on Climate Change. |
|
|
Ministry of Natural Resources and Environmental Affairs (MoNRE) (2011). Second National Communication to the Conferences of Parties of the United Nation Framework Convention on Climate Change. |
|
|
Nangoma D, Nangoma E (2008). Climate change and adaptation strategies: a case study of the Mulanje Mountain Forest Reserve and its surroundings. |
|
|
Pathak M (2010). Climate Change: Uncertainty for Hydropower Development in Nepal. |
|
|
Taulo JL, Mkandawire RW, Gondwe KJ (2008). Energy policy research baseline for Mulanje and Phalombe districts. |
|
|
United Nations Environmental Program/ Earths can (UNEP/Earthscan) (2002). Global Environmental Outlook 3. London: Earthscan. |
|
|
USAID (2013). Malawi Climate Change Vulnerability Assessment. |
|
|
Vincent K., Dougill AJ, Mkwambisi DD, Cull T, Stringer LC, Chanika D (2014). Analysis of Existing Weather and Climate Information for Malawi. |
|
|
Yue S, Wang C (2004). The Mann-Kendall test modified by effective sample size to detect trend in serially correlated hydrological series. Water Resour. Manag. 18(3):201-218. |
|
Copyright © 2024 Author(s) retain the copyright of this article.
This article is published under the terms of the Creative Commons Attribution License 4.0


