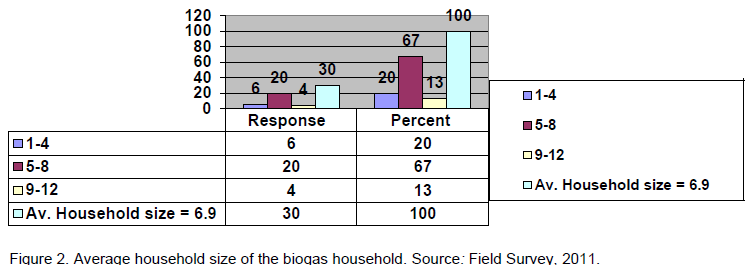
The demographic characteristics of the biogas user households are presented in data presenting tools such as Figures and tables. The average household size of the surveyed biogas user households was 6.9 (Figure 2).
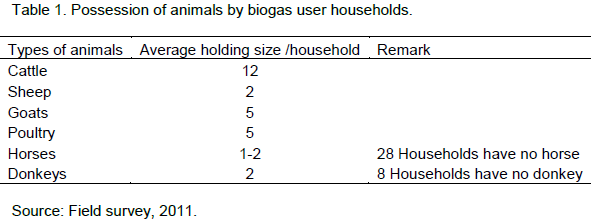
The surveyed biogas user households possess on average 12 cattle per household which is more than the minimum requirement of 4 cows for establishing biogas plant. The details are shown in Table 1.
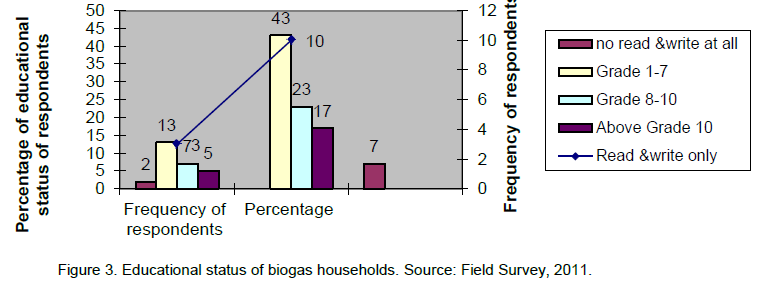
From the total respondents, majority (83%) are well educated which are from grade 1 to 7, 8 to 10 and from 11 to 12 complete (Figure 3).
Environmental benefits of household biogas investment in the study area
Perception of households on impacts of traditional fuel on forest
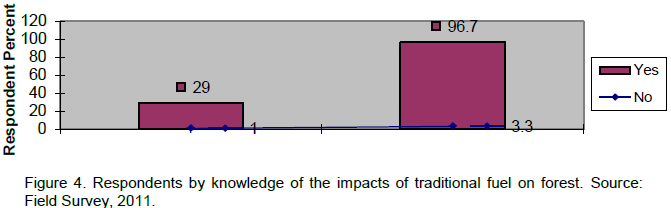
All the respondents were asked whether using of Trade tional fuel have direct impact on forest or not. Accordingly, the majority of the respondents (96.7%) perceived the negative impact of traditional fuel for the existing forest destruction and the rest (3.3%) did not perceive the impacts of traditional fuel for deforestation (Figure 4).
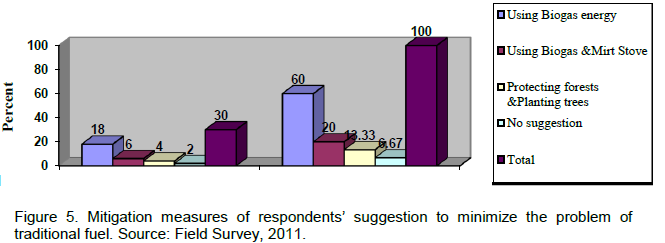
Regarding the solutions for deforestation, (60%) respondents suggested the use of biogas energy (20%) the use of biogas and Mirt stove, (13.3%) protecting forests and planting trees as a solution to control forest depletion and the rest (6.67%) did not show suggestion to minimize loss of forest due to use of traditional fuel (Figure 5).

It can be concluded that majority (96.7%) of the respondents perceived the negative impact of traditional household fuel on deforestation, and this could be attributed to their relatively better educational background. Even, all the solutions suggested by respondents are true, the researcher recommended the households to use biogas energy due to its clean and smokeless technology and ability to replace and reduce the use of firewood, charcoal, dung cake and other imported household energy sources such as kerosene.
Contribution of biogas as cleaner production mechanism
Biogas potential in the study area of Fogera district is in favorable condition in respect of the climatic and availability of raw material for biogas production. The potentials are: Municipal waste, livestock and human population. Thus, potentials needs to be recycled as cleaner production such as biogas energy, to get dual benefits from getting energy and making the environment clean.
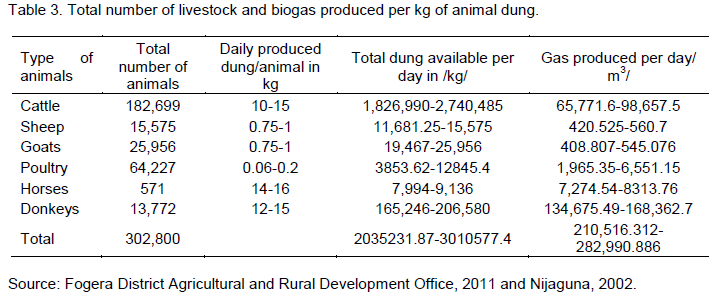
Livestock population in Fogera district: Documents gained from Fogera district Agriculture and rural development office, out of 302,800 livestock; 182,699 are cattle, 15,575 sheep, 25,956 goats, 64,227 poultry, 571 horses and 13,772 donkeys found in the district. Moreover, the annual dung production is about 666, 851,350 - 1,000,277,025 kg, which has a potential production from 24,006,648.6 to 36,009,972.9 m3 of biogas annually. However, it is estimated that only 90% of the theoretical potential, that is, 21,605,983.74 to 32,408,975.6 m3 (Av.27, 0074, 79.67 m3) of biogas would be practically available since the number of animals also include the households with only one cattle or goat. This has a potential for saving fuel wood from 118,832,910.6 to 178,249,365.8 kg, charcoal from 34569573.98 to 51854360.96 kg, kerosene from 16226, 093.79 L to 24339,140.68 L and electricity from 34569,573.98 to 51854360.96 Kwh annually (Table 3).
Human population in Fogera district: In Fogera district, 228,449 people reside there (CSA, 2007), which have a potential to produce 228449*0.3*365 = 2,501,5165.5 kg of human waste annually (Nijaguna, 2002). Assuming that all people have pit latrines and if they properly utilized their excreta, this would have a potential of producing 25,015165.5 kg x 0.046 m3 = 1,150,697.613 m3 of biogas, which saves 6,328,836.872 kg of firewood,1,841,116.181 kg of charcoal, 864,173.9 L of kerosene and 1,726,046.42 to 1956,185.942 Kwh annually (Filed survey, 2011; Nijaguna, 2002).
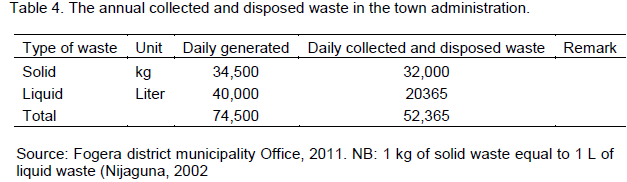
Municipal waste of the town administration: Fogera district town administration generates approximately 34,500 kg wastes (34.5 tons) of solid waste and 40,000 L (40tons) liquid waste was generated per day. Among these, the municipality collects and disposed only on average 32,000 kg of solid waste and 20,365 L of liquid waste per day, which is 92.5 and 50.91% of the total solid and liquid waste, respectively. The main sources of waste are from residential and commercial activities in the town. These wastes are collected and disposed in open space except small amount of liquid waste used for urban agriculture as fertilizer. Due to this small amount of utilization, the disposed waste creates bad smell to town and its surroundings that will create health problems.
COMEC (2006) stated that, in Brazil the biggest part of municipal waste generation is deposited without any methodology/without technological aid like Fogera district municipality, but Brazil uses high amount of waste for biogas energy production as energy source and waste treatment mechanism. This is also contended by UNESCO (1992), biogas technology have attracted considerable attention in waste recycling, pollution control and improvement of sanitary condition in addition to fuel and fertilizer.
On the contrary, the municipality of Fogera district have no future plan to use the potential waste as energy source officially except personal motivation and promise of experts after interview. As can be seen from Table 4, the town administration was collected and disposed 52.365 tons of waste per day and 19,113.225 tons of waste annually.
Assuming that all wastes are properly utilized, this has a potential of 19,113,225 kg × 0.03 m3 = 573,396.75 m3 of biogas, which saves 105,122,737.5 kg of firewood, 30,581,160 kg of charcoal,14,354,031.98 L of kerosene and 28,669,837.5 to 32,492,482.5 Kwh electricity annually. Besides, all this potentiality presented above such as wastes from livestock population, human population and municipal are dangerous unless it is recycled as cleaner production such as biogas to have dual purpose, killing two birds with one stone principle like Brazil (as source of energy and as environmental sanitation).
*Pair of oxen ploughs, 1 hectare per day: this is called “Temad”, which is the name of local measurement.
Social benefits of household biogas investment in the study area
Benefits from replacement of traditional household fuel
As the household traditional fuel consumption decrease, the contact hour of the family member to the traditional stove also decreased. As a result, the type of adverse effects of biomass combustion on human health stated by WHO (1991) could be decreased.
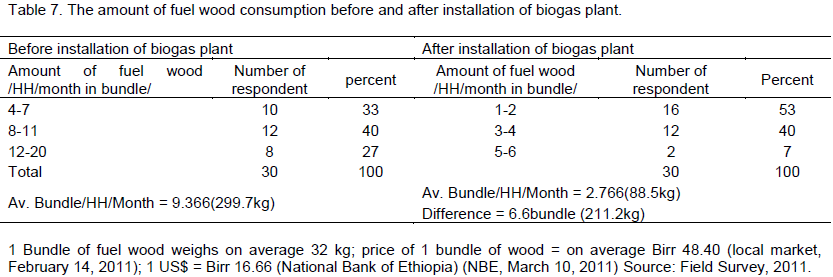
Household fuel wood consumption: The study showed that in the surveyed area, the biogas user households used Cordia Africana (Wanza) and acacia for cooking among others, Injera; Sauce (Wot), porridge and coffee/tea, before and after installation of biogas plant. However, after biogas plant installation, the traditional household fuel consumption was limited to baking Injera. As can be seen in Table 7, before installation of biogas plant, households used 3,596.4 kg of fuel wood/HH annually, but after installation of biogas plant each household uses on average 1062 kg of fuel wood/HH/year which is reduction of 2,534.4 kg (70.47%)/HH/ annually.
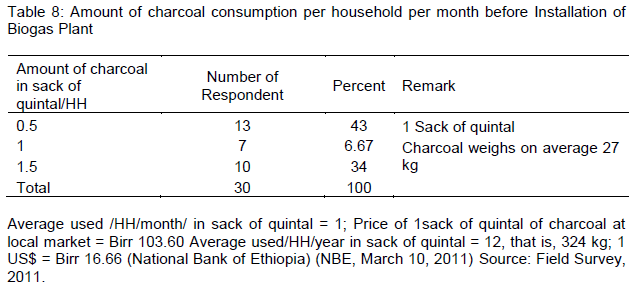
Household charcoal consumption: The average charcoal consumption in the surveyed households used 1 sack of quintal (27 kg) per month and 12 sack of quintal (324 kg) per year. As can be seen from Table 8, in the study area of biogas households, all of them used charcoal in different amount before installation of biogas plant. However, after installation of biogas plant, all the biogas households have been fully replaced with biogas energy.
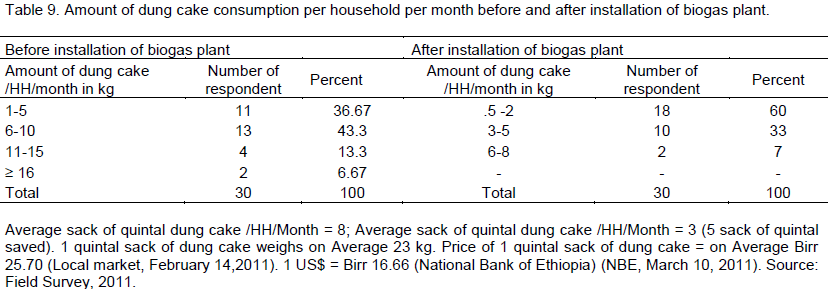
Household dung cake consumption: All the surveyed households, before installation of biogas, the majority (43.3%), used 6-10 sacks of quintal (138-230 kg), 36.67%, used 1-5 sacks of quintal dung cake (23-115 kg), 13.3% used 11-15 sacks of quintal (253-345 kg), 6.67% used above 15 sacks of quintal (460 kg) per month with on an average consumption of 8 sack of quintal(184 kg)/HH per month and 96 sacks of quintal (2208 kg) used annually. After installation of biogas plant, as presented in Table 9, majority (60%) used 0.5 to 2 sacks of quintal (11.5-46 kg), 33% used 3-5 sacks of quintal( 69-115kg), and the rest 7% used 6-8 sacks of quintal dung cake(138-184 kg) and on average of 3 sacks of quintal (63kg)/HH per month which is reduction of 5 sacks (115 kg)/HH per month, and 60 sacks (1380 kg) dung cake annually which is 62.5% from the total. This traditional household fuel consumption could contribute in

reducing the health impacts of households that appeared due to indoor smoke. Bajgain and Shakya (2005) stated that, the burning of fire wood, dung cake and agricultural residue creates many hazardous particles. Cooking is usually done indoors; this can lead to severe health problems. The particles from the smoke can give rise to acute respiratory infections among the people who are in contact with the smoke.
Benefits of biogas on health and sanitation of biogas user households
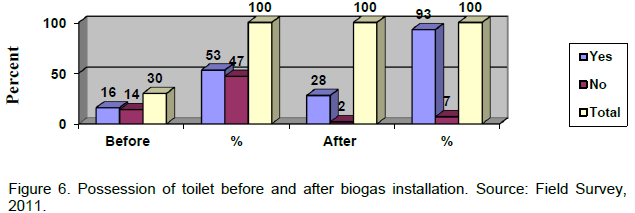
The study showed that in the surveyed area, after installation of biogas plant, the construction of toilet is increased which can be compared to IEIA (2002), study that was carried out by SNV/BSP of Nepal, showing that the record of toilet construction is higher among biogas users. Before installation of biogas plant, toilet possession of the surveyed HHs were 53%, while after installation of biogas, the possession of toilet reached 93% (Figure 6). From these toilet owners, 13% of them have attached their toilet to their biogas plant and the majority (80%) of respondents ready to attached their toilet to the biogas and the system is already installed which shows promising to use the integrated biogas plant for the near future. Only few (6.65%) respondents have no toilet at all. As data gained from the household survey, these two respondents cannot read and write at all. It seems that education has its own impact on dissemination of technology.
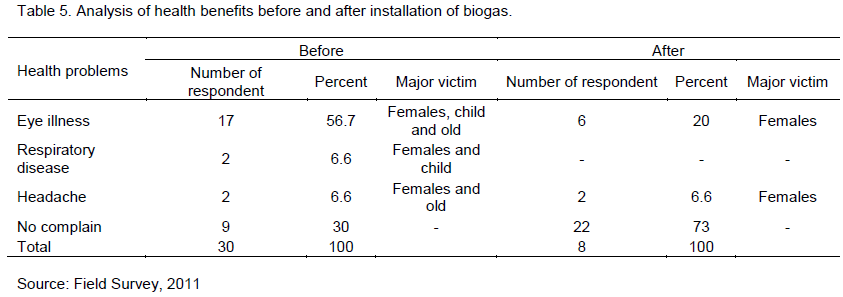
The biogas user households were asked to express their opinion about the difference in using traditional fuel and biogas energy use in relation to health impact. They replied by remembering what the local nurses and doctors recommend about negative impacts of traditional fuel on health and by adding their indigenous knowledge gained from experience. A comparison of the status of household in terms of frequently complained health problems, from the total of respondents, 21 (70%) were complain in eye illness, respiratory disease (such as common cold) and headache which accounts for 56.6, 6.6 and 6.6% respectively (Table 5).
Bajgain and Shakya (2005) stated that, the particles from the smoke can give rise to acute respiratory infections and eye ailments among the people who are in contact with smoke. These peoples are mainly women, children and infants, while in this study, the major victims were women, children and old people due to access to kitchen activities frequently and stay at home during food preparation. It has the same connotation with the study of Bajgain and Shakya (2005).
After biogas plant installation, the households reduce the use of traditional fuel such as firewood and dung cake, and limited these fuel only for Injera baking purpose which replaces the use of traditional fuel for cooking sauce (Wot), porridge, tea/coffee and at the same time the households replace kerosene and charcoal by lighting biogas lamp, and by using biogas stove for cooking sauce (Wot), porridge, tea/coffee etc. Due to this reduction of traditional fuel, after installation of biogas only 8 (26.6%) respondents complained about eye illness and head ache. The major victims were females due to baking of Injera by using firewood and dung cake but the frequency is less when compared with previous (before use of biogas energy). The direct effects of biogas plant on health and sanitation were found to be more visible than indirect ones; since, the study revealed that smokeless biogas had greatly benefited the plant owners by contributing to a significant reduction in eye related problems and respiratory diseases.
Biogas technology reduces contact hours to open stove fire, that is, after biogas installation the contact time is on average twice a week only for baking Injera and the rest activities are accomplished by biogas energy which is clean and smokeless.
Time saving and workload reduction
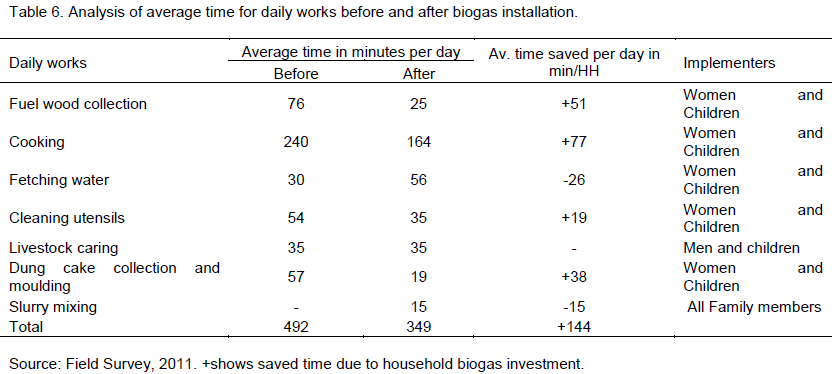
In the study area of the surveyed households, biogas installation makes each biogas household to save on average 144 min per day from fuel wood collection, cooking, cleaning utensils/kitchen materials, and the reduction in the physical stress was also remarkable. Women and children are the groups that collect fire wood traditionally. Table 6 depicts the time comparison that has been estimated to save up to 51 min on average every day due to installation of biogas energy. Gautam et al. (2005) stated that today’s use of biomass in list developed countries does not provide any use of sufficient lighting during the dark hours. The time consumed in collecting fire wood and other bio fuel carried out by women and children results in less time available for education. This means, as the study revealed that, children have time to go to school and they could use the biogas light for studying overnight unlike the previous time that they were used to kerosene for lighting purpose only from 2 to 3 h, and it has dangerous smoke that could affect respiratory organ and cannot be afforded by the poor. On the other hand, biogas gains equity of work among family members in accomplishing works such as slurry mixing which was accomplished by household members. Biogas households use their spare time/saved time in better care of family, in keeping household sanitation, education and other social affair. Due to absence of managing firewood and charcoal during cooking of sauce, porridge and tea/coffee, women could accomplish additional works at the same time.
Economic benefits of household biogas energy investment
Saving from fire wood purchasing expenditure
Due to the installation of biogas plant, there is an annual reduction of fuel wood consumption approximately 79 bundle of fire wood (2528 kg) per year per household and provides each biogas households an equivalent saving of 3833.28 Birr per year at the local rate of Birr 48.40 per 32 kg of fire wood (Table 7).
Saving from charcoal purchasing expenditure
In the surveyed area, after household biogas investment, purchasing of 12 sacks of quintal (324 kg) of charcoal is fully replaced by biogas stove. This amount of charcoal provides each biogas household an equivalent saving of 1,243.20 Birr per year at the local rate of Birr 103.60 per 27 kg of charcoal (Table 8).
Saving from dung cake purchasing expenditure
Due to household biogas investment, 60 sacks of quintal (1,380 kg) of dung cake are saved. This has an equivalent saving of Birr 1,542 annually at local rate of Birr 25.70/sack of quintal dung cake.
Saving from kerosene purchasing expenditure
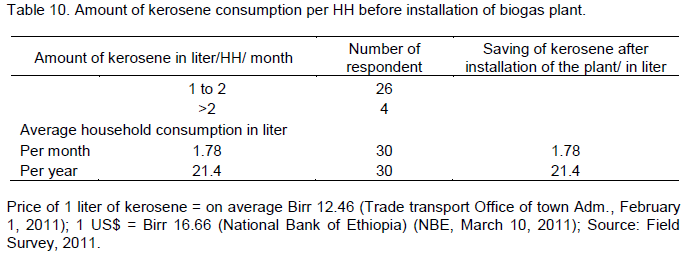
Besides the above household fuel, all the surveyed households used kerosene for lighting on average of 1.78 L per month per household and 21.36 L per year. Each household spent Birr 22.1789 and Birr 266.1456 per month and per year, respectively. After installation of biogas plant, all the surveyed HHs substituted their kerosene consumption fully by biogas lamp. This shows that Birr 266.1456 was saved annually at the local rate of Birr 12.46/L of kerosene per household (Table 10).
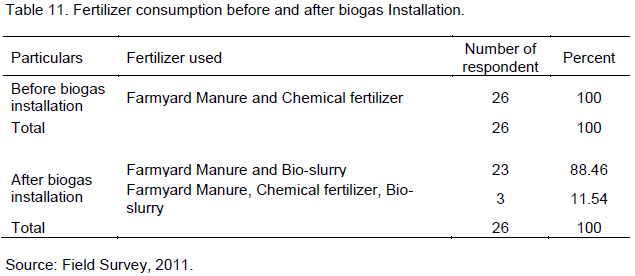
Savings from chemical fertilizer purchasing expenditure
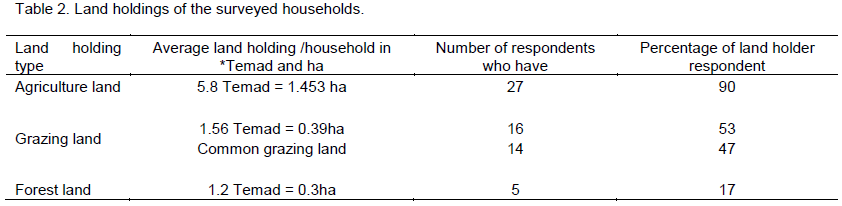
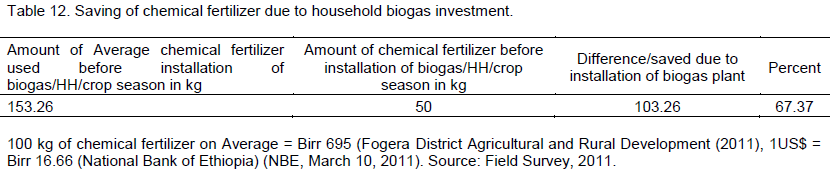
Further, reducing chemical fertilizer has an effect on households’ expense, from the total surveyed households, in the demographic characteristics of respondents, 27 of them have an average 1.453 ha/HH agricultural land and the rest have no agricultural land rather they have backyard farm used for managing the biogas slurry and cropping of cash crops such as khat (Chat). Before installation of biogas plant, the surveyed households used an average of 153.26 kg of chemical fertilizer per household annually/crop season/ in an equal proportion of dap and urea in their agricultural land to grow well the crop and increase the production but with an annual expenditure of Birr 1065.16/HH. After installation of biogas, due to use of bio-slurry fertilizer, the average household chemical fertilizer consumption in the crop season was reduced to 50 kg/HH which is saving of 103.26 kg of chemical fertilizer per household per crop season. This has an equivalent saving of Birr 717.657/HH/ crop season with an average local rate of Birr 695/100 kg of chemical fertilizer (Table 2).
Besides the above listed economic benefits of biogas, improving the hygiene and thereby reducing diseases also has an economic value. If people can avoid diseases it also means their working time will not be reduced as a result. The study also revealed that, household family illness due to use of traditional fuel also have an implication on health expense for treatment (Table 11).
In Fogera district, the cost of investment per plant varies due to personal contribution made by the respondents during construction work in the form of labor, variation in the year of construction, size of plants and access to the delivery of construction materials such as stone and sand/gravel. The total investment cost of the plant was an average of Birr 8,762.48 and Birr 9,813.46 for 6 and 8 m3 respectively and Birr 8,832.55 for an average plant size of 6.14 m3 for ease to calculate the approximate payback period of the plant. For a plant with total investment cost of Birr 8,832.55, the payback period was 5.77 years to recover investment of biogas plant per household without subsidy, whereas with subsidy of Birr 4,199.25, it could take only 2.7 years, which seem affordable as compared to study conducted by Li et al. (2005) and Woods et al. (2006). The calculation was based on saving from fuel wood, charcoal, dung cake, kerosene and chemical fertilizer (Table 12).
The shorter payback period makes biogas plant affordable for most peri-urban and rural households, even in poor areas (Li et al., 2005). The payback period for
Total land holding: 187.86 Temad = 46.971ha; Av. landholding/HH: 3.91 Temad = 0.978ha. Source: Field Survey, 2011.
Chinese type fixed dome biogas digester depends on how the biogas digester is used, what substrates, size, price on fuel wood, etc and without any subsidies would be around 3.6 to 5.8 years of payback period (Woods et al., 2006). The regional biogas coordination office and SNV/Ethiopia, estimated the cost of annual maintenance and miscellaneous expenses to be Birr 200 and 100 per plant, respectively. These costs are reserved in bank in the name of the plant owners dedicated from the subsidy.
Perception of users on benefits of household biogas energy
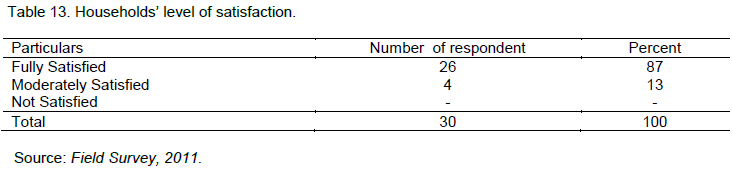
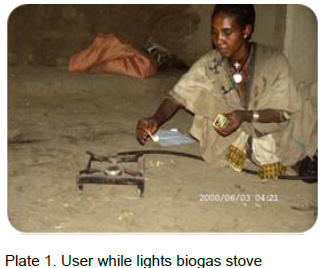
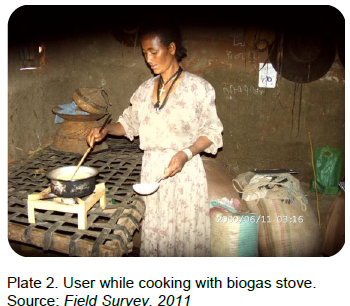
All the surveyed biogas plants were operational except temporary problems of lamp and other accessories. Due to this, the responses were quite satisfactory (Table 13, plate 1 and 2, box 1). There was significant satisfaction in terms of reduction of household fuel consumption, cease to expend for chemical fertilizer and HH traditional fuel, improvement in health and sanitation, time saving and studying for students among others.