ABSTRACT
Continuing degradation of urban environments of developing economies results from failure to make decisions based on scientific methods that employ accurate digital elevation models (DEM) in modelling environmental phenomena such as flooding and erosion. Data dumping and wastage occur if fresh DEM are required for every new project ignoring existing data. Every DEM to be used for modelling may be accepted as is, updated or rejected for a new one based on outlier fitness tests. High cost DEM aged only a few months should also be tested since elevation changes could occur in very short periods. Older DEMs might still be useful if changes are only in limited areas which could be mapped to update the DEM, so saving cost. A DEM of Owerri, South East Nigeria created from a 1977 1/2500 topographic map series was evaluated using elevations of random Global Navigation Satellite Systems (GNSS) points resulting in a ±1.290 m root mean square error (RMSE). Outliers of the 99% certainty were traced to a heavily cut construction site and a topographical survey of the site was used to update the DEM improving RMSE to below the meter mark.
Key words: Digital elevation model (DEM), geographic information systems (GIS), outlier, DEM updating, root mean square error (RMSE).
The intelligent way to manage the urban environment in the 21st century requires making decisions based on results of modelling of environmental phenomena. Factors that ravage our environment such as flooding and erosion and the components that cause them can be determined long before they occur using the geographic information systems (GIS). Natural runoff routes of landscapes can be delineated on GIS platforms and constructions that would compromise them stopped in advance. Many of the surface flow induced environmental hazards require analyses that use the digital elevation model (DEM) on GIS.
Devastating floods and erosion of the urban environments of developing nations in West Africa continue to be reported, for instance in Karley (2009), Odufuwa et al. (2012), Aderogba (2012), Chukwuocha and AC-Chukwuocha (2014), and Reliefweb (2017). Much of these results from constructions carried out on unmarked runoff routes or ill-advised drainages.
Availability of appropriate DEM fit for purpose is key in the analysis required to secure urban environments especially of the developing world. Often the costs of fresh DEM are included as part of every new project. High costs of DEM ordinarily could make administrators especially at the local government level, to shy away from using GIS modelling for their decision making processes.
Selection of appropriate data sets based on urban area elevation change analysis and error estimates in DEM
Sometimes the dilemma of researchers and project leaders in the developing world comes from confusion on which data set is appropriate in the midst of big data and limited funding. A case can actually be made to show data dumping in the developing world as obviously usable data sets are disregarded to procure newer ones. On the other hand, the general practice of using data within the first three to five years of their lifespan as current data can also be faulted if topography has changed so soon after the data was generated. The determination of the appropriateness of data considered new or old for a project would have to be by scientific verification.
Change in elevations of some parts of a digital elevation model is a deformation case since from the geospatial point of view deformation occurs when there is a change in the recorded position of a project point beyond set limits. A measurement system for detecting movement of points must allow only uncertainties that are of magnitudes not more than a third of the minimum movement set to be identified (Beshr, 2015; US Army Corps of Engineers, 2002). Since elevation changes of up to 1 m are not expected in habited urban environments, some older DEMs could represent the current topography better than newer ones with higher root mean square error (RMSE).
The deformation analysis procedures will have to be adopted for determining areas of significant changes in the DEM. Actions may be taken to improve the DEM or even to choose another so as to achieve more accurate modelling of topography based phenomena than using a newer but higher RMSE DEM. The aim of this paper is to demonstrate a statistically sound procedure for scientific verification of topographic data (old or new) that may be used in a project to ensure that the analysis being reported correctly represents the phenomenon as at the date of the analysis. Statistical outlier verification could lead to different types of decisions. The first is to determine what accuracy of DEM is required for a particular analysis. The second is to determine if a particular DEM is fit for the purpose of the project. The third is to determine what parts of a DEM has changed and by how much. The last is to determine if it is acceptable and cost effective to update the DEM.
There are high chances of discovering significantly changed topography in urban environments since they are inhabited. City construction works would have been documented by the works department and has 100% discovery chance. Eroded parts of the urban area will be known and enquiries in the city provide chances of discovering them. The planned field measurement checks on the landscape will be additional way to discover undocumented changes such as those created by erosion or siltation in remote areas. It is important that field measurements will cover all morphologies in the project area. Steep sloped landscapes with lose soil in bare areas are more susceptible to erosion. It is to be noted that elevation change that occurred naturally in a morphology type should trigger further interest to check all such landscape types and other landscapes known to be more susceptible to those natural causes.
The GNSS or aerial photogrammetry from remotely piloted aircraft systems (RPAS), (Unmanned Aerial Vehicles, UAV) platforms, are accurate enough and cost effective especially since the field works are carried out over sample areas. The flexibility and lower time required to execute UAV projects is an added advantage to the high accuracy DEM results of the UAV also termed unmanned aerospace systems (UAS) photogrammetry. It has been reported to accomplish elevation determinations at the 60 m altitude with RMSE of ±0.262 m (Udin and Ahmad, 2014) and 0.041 m horizontal and 0.068 m elevation at the 95% confidence level (Barry and Coakley, 2015). While the UAV can cover smaller areas in shorter times; it also has the advantage of generating full landscape coverage. Global Navigation Satellite Systems (GNSS) on the other hand is suitable to provide representative points with higher accuracy over very large areas of the landscapes without losing accuracy.
When the elevations of the sample points have been determined, a comparison is made between elevation of points on the older DEM with the elevations of their corresponding points in the new measurements and the statistics worked out. The first step is to determine the nature of the differences which is then used to derive the character of the distribution of the changes in elevation, especially the mean and the variance (μ, σ2) and also the range. The outlier determination is then carried out to isolate the points where elevations have changed in a way that is out of character with the data set.
An outlier is an observation that deviates so much from other observations as to arouse suspicion that it was generated by a different mechanism. Spatial outliers are spatial objects which value on an attribute or more is markedly different from others in the set under consideration (de Smith et al., 2015; Lu et al., 2003; Hawkins, 1980; Barnett and Lewis, 1994; Johnson and Wichern 1992). Spatial statisticians agree that outliers may not just be bad data, but may be indicative of unexpected, interesting, and useful spatial patterns that require further analysis (Lu et al., 2003; de Smith et al., 2015; Ben-Gal, 2005).
In the case of this research, the outliers of interest are those that indicate changed elevation beyond the natural random errors that would have accumulated from the DEM generation and the determination of the elevation used to validate the DEM. The outliers are those observations that occupy the outlier regions of the defined normal distribution. Davies and Gather (1993) in Ben-Gal (2005) state that for any confidence coefficient α, 0 < α < 1, the α-outlier region of the normal distribution N(µ,σ2), is defined by,
out (α, µ, σ2) = {x : |x − µ| > zq−α/2σ} (1)
where zq is the q quartile of the N(0,1). A number x is an α-outlier with respect to F if x ∈ out(α,µ,σ2), where F is the actual distribution of the dataset.
In similar analysis in which the accuracy of LiDAR in producing digital elevation models was evaluated, Vaze and Teng (2007) report that basic statistics such as minimum, maximum, mean difference and the RMSE were determined and the percentile method was used to evaluate the accuracy of the LiDAR elevations when compared with the field survey elevations. The RMSE method was used to identify outliers by which errors were removed using the 3 sigma rule. In the 3 sigma rule, all errors greater than 3 standard deviations are removed until either, the 5% of data has been removed, or there are no more errors greater than 3 sigma. Once these errors were removed, the vertical accuracy was reported at 68% confidence level as direct value of the RMSE and at 95% confidence level as per the formula: Accuracy = RMSE × 1.9600. Some stricter rejection rules as in Ghilani (2010) are applied to pure normally distributed data sets showing that rejecting observations greater than 3σ means that about 99.7% of all observations should be retained.
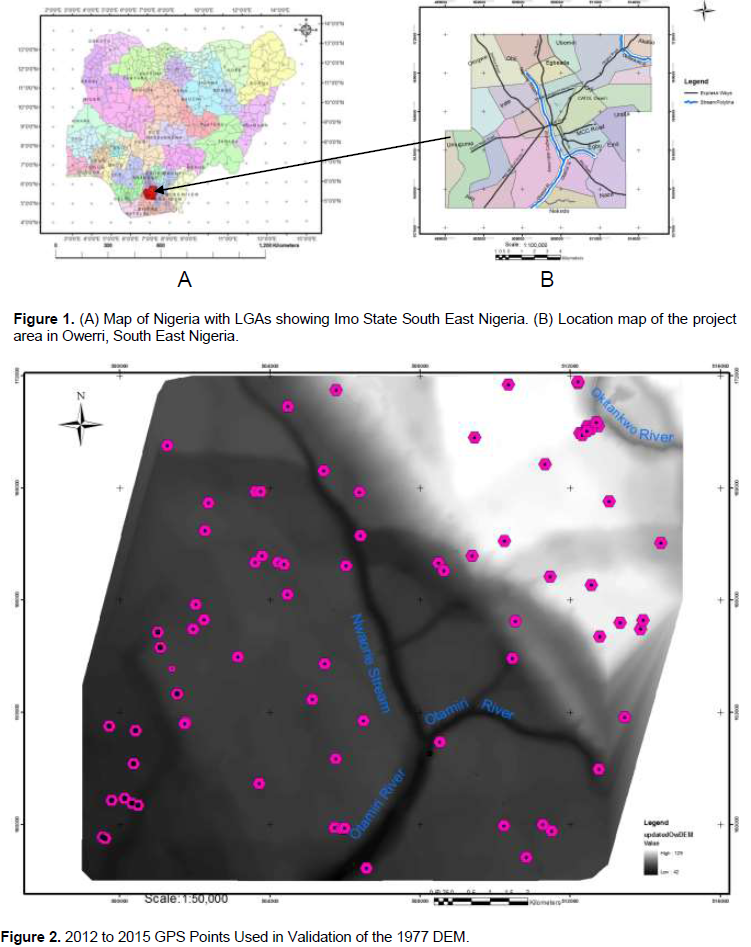
The project area was the urban and suburban areas of Owerri, capital city of Imo State, South East Nigeria, covering about 18602.38 ha. Owerri with a population of about 715,800 as at the year 2015 (Population City, 2015) situates between 5° 20'N, 6° 55'E in the south-western corner and 5° 34'N, 7° 08'E in the north-eastern corner having an elevation range of 30 to 120 m above the Lagos Datum Mean Sea Level with an average slope of under 1°. Two water bodies transverse the city. Nwaorie stream flowing from the north-west end of the city down to the south-east direction confluences Otamiri River which from its own source flows from the east of the city west-wards to the confluence of the two water bodies from where Otamiri turns south-west-wards. Figure 1a shows the location of Imo State (in red, arrowed) in the map of Nigeria. Figure 1b shows the project area in details.
The 1977 topographic map series of Owerri, capital of Imo State, South East Nigeria, produced from Aerial Photographs (Geodetic Surveys, 1977) covering the project area were scanned and georeferenced. The contours of the maps were digitized and converted to a digital elevation model on a GIS platform.
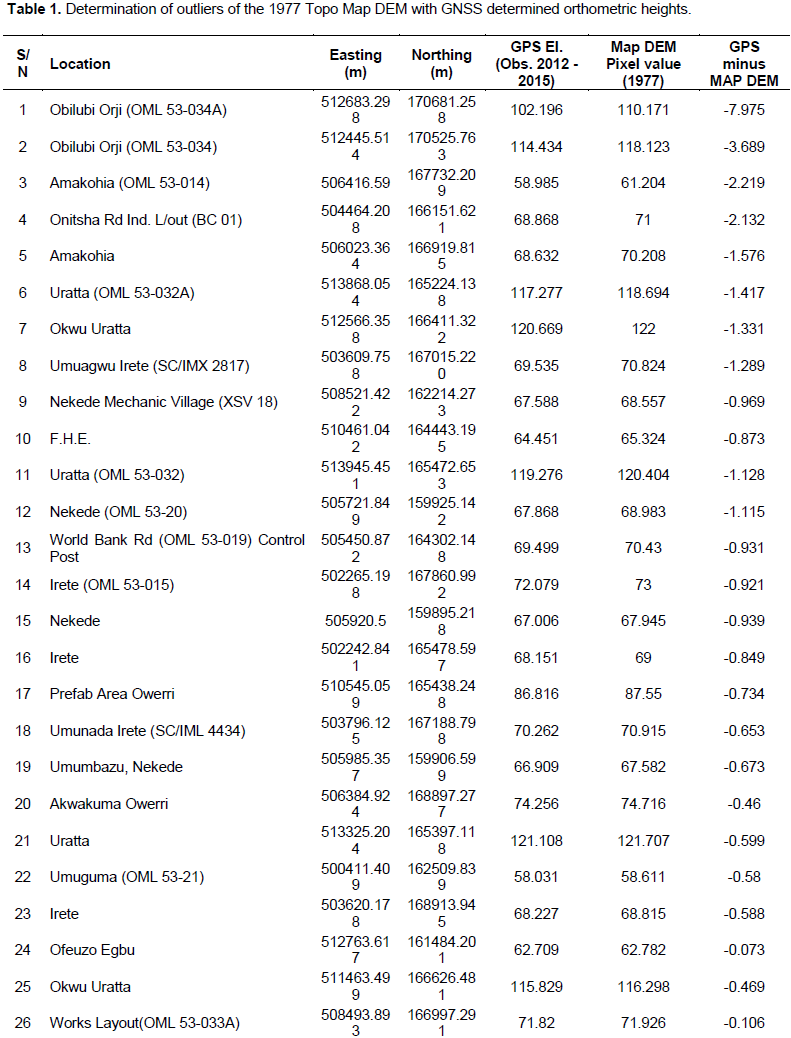
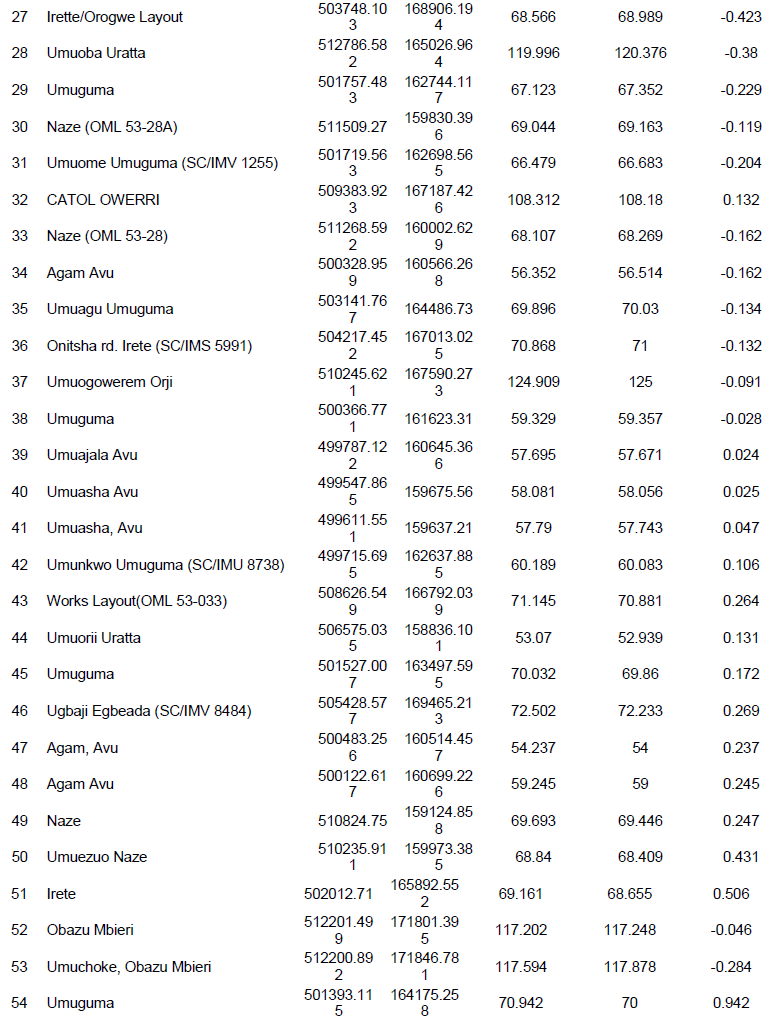
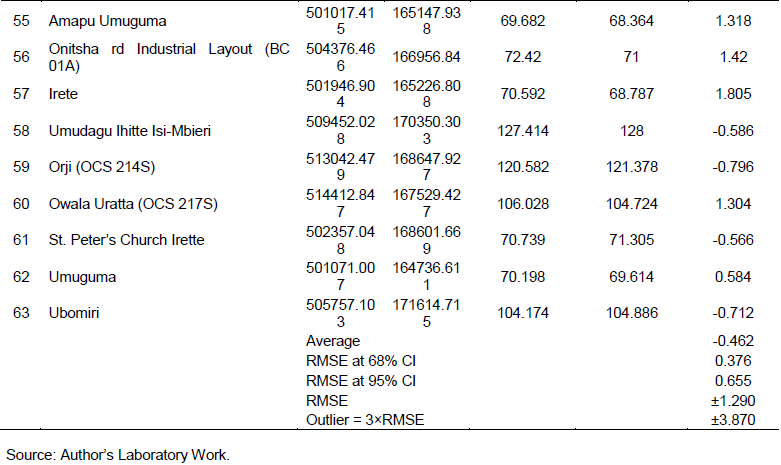
The positions of the GNSS points used to validate the DEM were spread out across the entire project area, covering all possible morphologies. Dual frequency Global Navigation Satellite Systems (GNSS) receivers were used in Fast Static observations of 63 random points between 2012 and 2015, as shown in Figure 2 on the 1977 map DEM created for this research. The GNSS surveys were processed using Trimble Business Centre™ software and the ambiguity resolved in the fixed mode. The same software was used to adjust the networks so created. The orthometric heights of the GNSS points were derived with reference to the Lagos datum mean sea level to which datum the elevations of the topographic map series were published. Top Nav (1998) published the relationship between Ohio State University (OSU) 91A geoid and the Lagos datum elevation over Owerri to be OSU 91A geoid value + 0.535 m. The elevations of points corresponding to the GPS points were extracted from the 1977 digital elevation model of the project area and their differences calculated. The details are shown in Table 1.
The rationality for this research is seen in the analysis of the validation of the 1977 DEM with the 2012 to 2015 GNSS determined elevations of the corresponding points. It is immediately seen that 90% of all the points have elevation difference of less than or equal to 1.4 m. The results show that generally the four decade old 1/2,500 topographic map results in a DEM of higher accuracy of more recent DEM such as the SRTM, ASTER or even SPOT. 40% of the elevations recorded differences of 0.5 m or less tending towards LiDAR DEM elevation accuracy. The stability of the ground surface is also obvious.
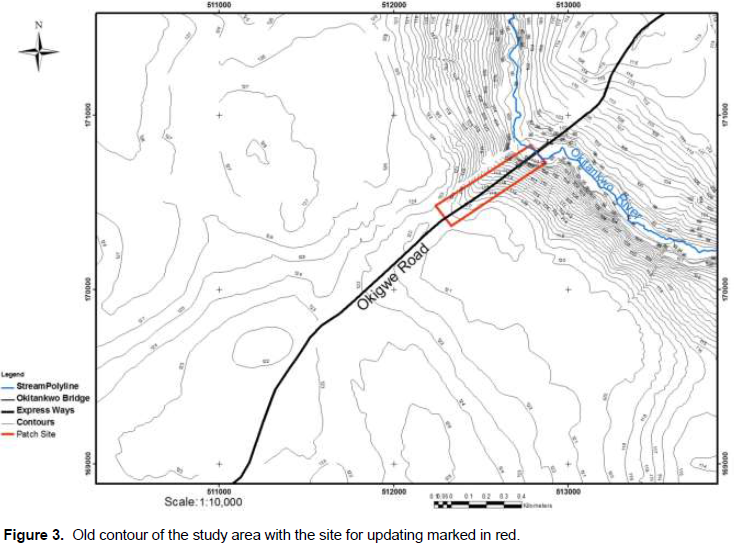
The 99% confidence level of ±3.870 m indicates that those points with errors outside of this range should be checked out. A point of elevation change of -7.90 m and with another of -3.689 m were located along a road that was constructed with very heavy cut of the terrain along the Owerri-Okigwe road, downslope from Obilubi to Akabo at the Okitankwo River bridge as shown in Figure 3. The works department’s records show that the construction was carried out around 1979, which was 2 years after the 1977 topo map was created. The area of the site so cut was about 96,000 m2 (9.6 ha), only 0.05% of the entire project area. The decision was made to survey the site with ground survey method using total station trigonometry connected to GNSS points established in that area for elevation.
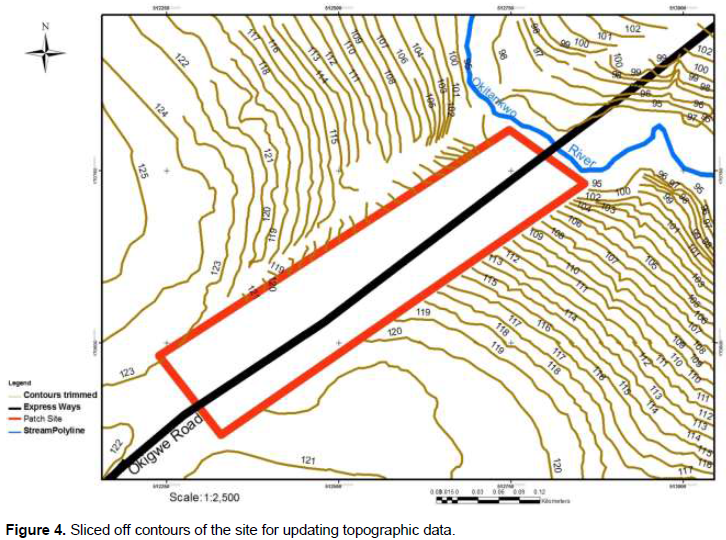
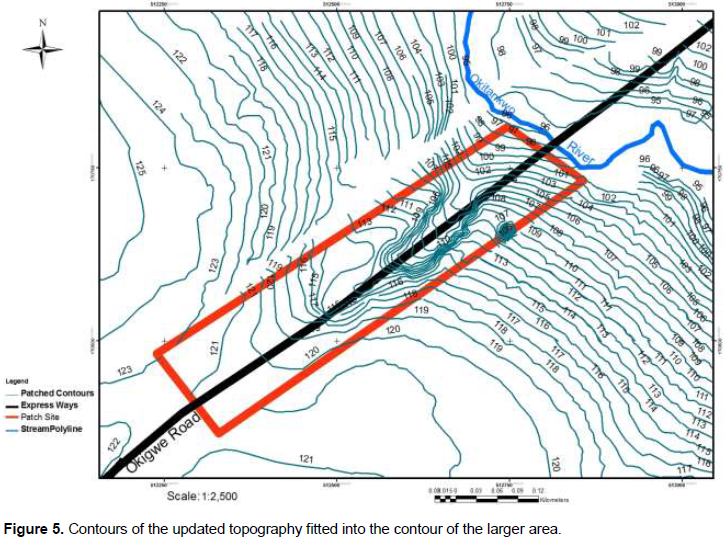
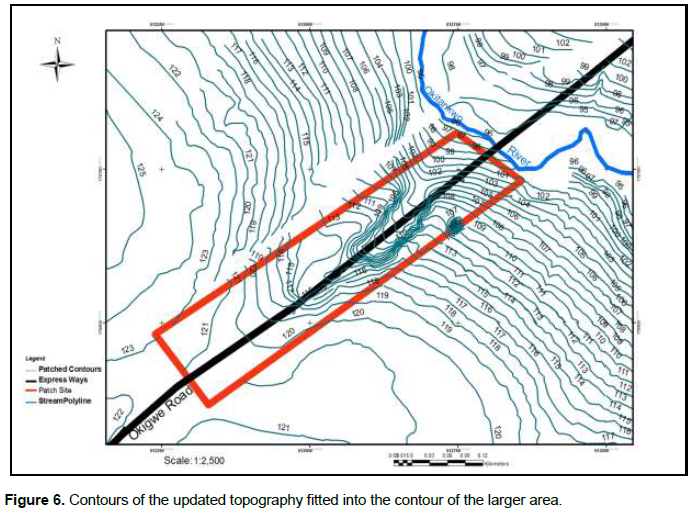
The integration of the updated data of the site with the old topo data of the entire project area was carried out. The first step was to slice off the contour of the part of the project area that was to be updated as shown in Figure 4. Then the updated contour generated by the new survey was used to patch up the area, thus integrating the contour of the entire study area with the updated contour of the sliced off part as shown in Figure 5. The updated DEM of the study area was then created from this current contour of the entire project area as shown in Figure 6.
In this research, two stages of work were carried out. The first was validating the DEM to identify any areas of elevation changes. The procedure used was to determine present elevations at points scattered over the face of the project area. The elevations of these points so determined were compared to the elevations of their corresponding positions in the DEM to check for all points where the elevation change was more than 3σ. With 3σ of the test dataset equals 3.870 m, a point of error magnitude equals -7.975 m was identified as an outlier. It had another point OML 53-34 about 284 m from the outlier station with elevation change of 3.689. The area was visited for ground truthing and the decision taken to update the elevation data of the area which was cut by a road construction that took place at a later date after the production of the topo maps from which the DEM of the area was produced. Since the area was just 9 ha, the trigonometric method involving total station was used to generate the 3-dimensional data from which an updated contour was produced.
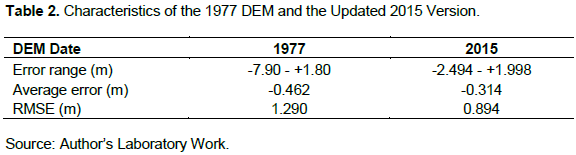
Validating the new DEM created from the updated contour with a new set of points revealed the improvement achieved. The results shown in Table 2 reveal that the updated DEM has an average error of -0.314 m and RMSE of ±0.894 m. The DEM was checked for outliers at the 99% confidence interval and all the points observed were found to lie within the normal distribution.
The updated contour of the entire project site was used to create the updated DEM of the study area. The analyses using the recent GPS Fast Static points were repeated and the impact of the updating is easily visible in the improved RMSE and average error which are now 0.894 and -0.314 m from 1.290 and -0.462 m, respectively.
The efforts made in this project resulted in the identification of a site where elevation had changed significantly. This was a site where a road construction was executed after the topographic map of the area had been made. It was from this map that the initial DEM was developed.
The choice was made to update the DEM by using the current records of the topography of the area of changed elevation. Any modelling or analysis carried out with the initial DEM without updating it would have resulted in a faulty model that would not represent the actual situation of the landscape. The updated DEM so created represents the topography of a critical landscape of a riverbank that slopes steeply.
After the updating, some new set of ground control points were used to check the statistics of the updated DEM. The RMSE is now 0.894 m, improving 31% from the initial RMSE of 1.290 m. The average error in the updated DEM is -0.314 m improving by 32% from -0.462 m. The core point is that the identification of changed topography by the outlier error detection method has proved very effective.
The research reported in this paper has demonstrated the efficacy of outlier based analysis in selecting suitable DEM for a project. And if it is considered cost effective, the same procedure is used to determine the part of a DEM that may be resurveyed for updating the digital elevation model (DEM) that would be employed in modelling of landscapes and their phenomenon.
The study was based on the validation analyses of the topographical data from the 1977 topographical maps of Owerri, South East Nigeria using orthometric heights derived from GPS surveys from 2012 to 2015. The maps used here are products of aerial photogrammetry campaigns of Owerri. The result is the creating of an up to date DEM with RMSE of 0.894 m.
The method of outlier based statistical determination of suitable DEM for geospatial phenomena analyses is necessary in all cases requiring the use of DEM because without authentication of the dataset to accurately represent the topography, there is no way to know if the result of the analyses with which the DEM is executed is accurate.
It is not always that state of the art techniques will require acquisition of brand new data sets to operate. Cities of developing countries which cannot afford to regularly acquire entirely new accurate topographic data for the DEM may sometimes rely on updated old sources to fight critical cases of menace of flooding and erosion in the urban areas and for other hydrological analyses.
Limitations of the method being proposed in this paper include that for very vast areas collection of data for validation of the DEM could still miss very wide areas. Efforts to cover large areas using cheaper sensor systems such as the UAV could be time consuming and error prone. In such cases the option left is to produce brand new DEM.
(1) The method described in this research shows cost effective methods to update and derive accurate digital elevation models. It is therefore recommended.
(2) The developing world should not hesitate to employ the use of the digital elevation model due to cost. The management of the environment from flooding and erosion must now be pursued with this state of the art methods of GIS employing the DEM.
(3) Given that the significantly changed topography was discovered by outlier analysis using random Global Navigation Satellite System survey points, an alternative is to use digital elevation model (DEM) generated from remotely piloted aircraft systems (RPAS) which can cover areas of interest with many more points.
(4) The result achieved by updating old digital elevation model (DEM) of urban areas recommends itself for development of DEMs for hydrological analyses of urban areas.
The authors have not declared any conflict of interests.
REFERENCES
|
Aderogba KA (2012). Qualitative Studies of Recent Floods and Sustainable Growth and Development of Cities and Towns in Nigeria. International Journal of Academic Research in Economics and Management Sciences 1:3.
Crossref
|
|
|
|
Barnett V, Lewis T (1994). Outliers in Statistical Data. 3rd edition John Wiley and sons 17:582.
|
|
|
|
|
Barry P, Coakley R (2015). Accuracy of UAV Photogrammetry Compared with Network RTK GPS Baseline Surveys Ltd, Mount Desert Lodge, Lee Road, Cork, Co. Cork – Ireland.
View
|
|
|
|
|
Ben-Gal I (2005). Outlier detection, In: Maimon O, Rockach L (Eds.) Data Mining and Knowledge Discovery Handbook: A Complete Guide for Practitioners and Researchers," Kluwer Academic Publishers, ISBN 0-387-24435-2.2
Crossref
|
|
|
|
|
Beshr AAA (2015). Structural Deformation Monitoring and Analysis of Highway Bridge Using Accurate Geodetic Techniques. Engineering 7:488-498.
Crossref
|
|
|
|
|
Chukwuocha AC, AC-Chukwuocha N (2014). Geographic information system planning and monitoring best practices for West Africa African, Journal of Environmental Science and Technology 8(1):31-40.
Crossref
|
|
|
|
|
Davies L, Gather U (1993)."The identification of multiple outliers," Journal of the American Statistical Association 88(423):782-792.
Crossref
|
|
|
|
|
De Smith MJ, Goodchild MF, Longley PA (2015). Geospatial Analysis: A Comprehensive Guide to Principles, Techniques and Software Tools 5th ed. Winchelsea Press, Winchelsea UK. pp. 41-43, 310.
|
|
|
|
|
Geodetic Surveys Limited (1977). Owerri Nucleus Sheet Map series, 1/2,500. Government of Imo State, Nigeria.
View
|
|
|
|
|
Ghilani CD (2010). Adjustment Computations–Spatial data Analysis 5th Ed. New Jersey John Wiley and Sons P 43.
|
|
|
|
|
Hawkins DM (1980). Identification of Outliers, Chapman and Hall, London.
View.
Crossref
|
|
|
|
|
Johnson RA, Wichern DW (1992). Applied Multivariate Statistical Analysis. Prentice Hall International editions 642 p.
|
|
|
|
|
Karley NK (2009). Flooding and Physical Planning in Urban Areas in West Africa: Situational Analysis of Accra, Ghana, Theoretical and Empirical Researches in Urban Management Number 4:13/November 2009.
|
|
|
|
|
Lu C, Chen D, Kou Y (2003). Algorithms for Spatial Outlier Detection. Proceedings of the Third IEEE International Conference on Data Mining (ICDM'03).
View
|
|
|
|
|
Odufuwa BO, Adedeji OH, Oladesu JO, Bongwa A (2012). Floods of Fury in Nigerian Cities, Journal of Sustainable Development 5:7.
|
|
|
|
|
Population city (2015). Owerri• Population Accessed from:
View. Accessed on March 6, 2018.
|
|
|
|
|
Reliefweb (2017). West and Central Africa: 2017 flood impact (as of 18 Oct 2017). UN Office for the Coordination of Humanitarian Affairs.
|
|
|
|
|
Top Nav (1998). Technical Report on 3D Owerri 98 / OML 53 GPS Survey. Chevron Nig. Ltd.
|
|
|
|
|
Udin WS, Ahmad A (2014). Assessment of Photogrammetric Mapping Accuracy Based on Variation Flying Altitude Using Unmanned Aerial Vehicle. IOP Conference Series, Earth and Environmental Science 18:012027.
Crossref
|
|
|
|
|
US Army Corps of Engineers (2002). Structural Deformation Surveying. Department of the Army, Washington DC. pp. 2-511.
|
|
|
|
|
Vaze J, Teng J (2007). High Resolution LiDAR DEM – How good is it? Proceedings of the MODSIM 2007 International Congress On Modelling And Simulation. Modelling and Simulation Society of Australia and New Zealand, Christchurch, New Zealand.
View
|
|