ABSTRACT
This study examines concentration of pollutants that can contaminate soil, surface water and groundwater in the Bongor Basin. The analysis of thirty soil samples from six oil sites: Koudalwa, Ronier, Ndoubadana, Narenang, Croisement Baobab and Croisement Ridina was carried out using standard laboratory testing methods of chemical elements and pollutants. Results reveal that Nickel has a maximum concentration above the acceptable threshold of INERIS standard of France (2-60 mg/kg). Copper present concentrations above the Cameroonian standard of SONARA site (10 - 30 mg/kg), Cadmium has a content above the INERIS standard of France (0.2-0.7 mg/Kg) and Cameroonian standard of SONARA site (1 - 2 mg/kg). Phenol was present in all samples with very high concentration values compared to Canadian class A and B standards (0.1-1 mg/kg) and Cameroonian standard of SONARA site (0.2-1 mg/kg).
Keywords: Oil installations, pollutants, groundwater resources, basin, Bongor.
Soil and water contamination by hydrocarbons is of concern because of the toxic nature of hydrocarbons for all forms of life. Hydrocarbons, metals and other chemical compound associated with oil development and facilities detected in soil and environment come from water produced during hydrocarbon production. This water consists of reservoir water brought to the surface with hydrocarbons, as well as condensation and reinjection water for pressure maintenance and production optimization (UNEP, 1997). Thus, all chemical elements associated with hydrocarbons and those contributing to its exploitation might be dispersed on the ground, and dissolved in water or float freely on the surface of the water. These chemical elements are real problems for the environment (Aniefiok et al., 2016). In the history of hydrocarbon development, several cases of oil and chemical spills have been recorded (Jacqueline and Emilio, 2017). Increased land pressure, urbanization, the development of oil and industrial facilities, and the dramatic deterioration of the environment associated with various spills are often source of conflict between residents, operating companies and existing governments (Bruno and Pascale, 2000). In Chad, companies recorded several cases of oil and chemical spills in oil fields (Anonymous 1, 2018). Other research also raised concern about oil spill problems in the Doba Basin (ECMG, 2009). Concerning Bongor Basin, according to the Initiative for Transparency in Extractive Industries in Chad (ITIE, 2014), environmental disputes have been an arm wrestling between the government and oil companies. These disputes are due to flagrant violation of environmental standards by intentional spills of crude oil into open pits and trenches in the Koudalwa Region (Croset, 2015). Despite various notifications, these bad practices influencing the environment of these localities have not stopped. Buried crude oil spilled during exploitation in pits and on the ground might likely result in soil, surface water and groundwater contamination. In view of reports on oil spills, chemicals, and all oil practices, the receptacle for all kinds of waste generated by oil activities in this environment is the soil. It plays a decisive role in the flow or dispersion of these harmful substances and is the main point of dispersal of environmental pollutants (Wilcke, 2000). In order to know the state of the environment in Bongor Basin, this research carried out focuses on the determination of concentration of pollutants that could contaminate soil, surface water and groundwater. Samples were taken from six oil sites in Bongor Basin.
Area of study
Bongor Basin is located southeast of N'Djamena (Chad), between 15.15 and 17.50° East longitude and between 9 and 11.25° North latitude with surface area of about 105767 km2. It is located 180 km from the starting point of Komé pipeline. It is located in a transition zone between the humid tropical climate and the dry tropical Sahelian climate, marked by an alternation between wet and dry seasons. Rains begin with some precipitation in April and last until October with maximums precipitation in July, August and September (PANA, 2009; Atlas TCHAD, 2013; Anonymous 3, 2017). The average lowest temperature is in January (24.6 degrees), the average and maximum temperature is 40 and 47 degrees, respectively. We observe peak temperature in April. The minimum temperature ranges from 10 to 20 degrees in December (ATLAS TCHAD, 2013; Anonymous 3, 2017).
This zone is highly dependent on physical and chemical phenomena, linked to changes in temperatures and the amount of rain that can trigger altered and mineralized reactions (Anonymous 2, 2017). Soils that predominate in this area are tropical ferruginous soils formed on silica sands or clay sands (Anonymous 2 and 3, 2017). They are associated in some parts with halomorphic soils and in other places with hydromorphic soils. Vertisols or hydromorphic soils have poor internal drainage. They are flooded during the rainy season for several months (Nadjiam, 2013; Anonymous 3, 2017). Bongor Basin Oil Fields are located north of the Chari River and south of the Logone River. These two rivers are the main permanent rivers in CHAD. Chari River which is near the study area has an average annual flow rate of 1230 m3/s, the maximum netflow rate measured to be 5160 m3/s, and the average annual runoff is about 38.8 billion m3 (Anonymous 2 and 3, 2017). This river has its origin from Central African Republic, fed by Baminguiand then Bangoro streams. Its main tributaries are Barh Aouk, Barh Keita and Barh Salamat on the right bank; Bahr Sara and Ba Illi on the left bank (PANA, 2009; ATLAS TCHAD, 2013; Anonymous 3, 2017).
The vegetation of the site is a Sudanese Savanna tree supported by sandy-textured soils. Forest formations are more or less dense to combretaceous (Anonymous 3, 2017). There are also clear forests, shrub savanna, fallows, grasslands and gallery forests along temporary streams (PANA, 2009; ATLAS TCHAD, 2013; Anonymous 3, 2017). The geology of Chad dominated by the Lake Chad Basin is a sedimentary basin forming in Mesozoic times and filled, in depth, with tertiary-age sandstone and clay sands from the continental terminal; superimposed by the Pliocene-quaternary sandy age/clay deltaic sediments and lacustrine sediments. Bongor Basin is within the lower end of base Oligo-Miocene at Neogene located in large parts of southern Chad. It consists of alternating layers of sandstone, clay sand and clay generally at depths of 400 to 700 m, below the quaternary-Pliocene formation shown on the geological map in Figure 1 (Ngatcha et al., 2008; UNICEF, 2010). Aquifers in this area include three main aquifers: an upper, unconsolidated Quaternary/Pliocene aquifer of lacustrine and deltaic deposits (the Chad Formation); a Tertiary sequence underlying this (the Continental Terminal formation) (GWP, 2013).
Sampling method
The approach used for sampling is the hypothetical approach, with a control sample that amounts to a subjective selection of sampling points based on on-site visual recognition. The type of sampling is punctual and redesigned (ISO, PART 2, 1993). The collection points are under oil wells, manifolds, pipelines (Plates 1 to 3), on a space of 30 × 30 m2 of oil facilities. To ensure good representativeness of samples, fields and or sites are crossed in zig-zag by taking random sub-samples throughout the field area. Each sub-sample consisted of 200g obtained from a 25 cm high stainless steel cylindrical tube core and 50 mm in diameter (ISO, PART 1, 1993). A sample consists of several sub-samples from a collection site and put together. At each locality site, five (05) samples were collected, including a control sample, and 4 samples from the targeted areas or parts of the fields with quite different ground-looking colour. Each sub-sample was stored in a resistant polyethylene bag. The set of sub-samples by site or oil fields put together in a larger plastic bag, placed in a wooden case, and transported to Water and Environment (LABEN) Laboratory at the Faculty of Exact and Applied Sciences at University of N'Djamena in Chad. 30 samples were collected from 72 points visited and identified; 5 samples per oil field or site (Figure 3) are taken from six localities in Bongor Basin (Figure 2): Koudalwa, Ranger, Ndoubadana, Narenang, Croisement Baobab and Croisement Ridina.
Soil samples processing
Soil samples taken from the target points in oil sites were air-dried at room temperature. A follow-up mixture of sub-sample quartage was made, and then a quantity was crushed using a porcelain mortar and pestle; it was sieved using a 100-mesh sieve. 250 g of the soil sieved was stored in suitable polyethylene plastic and numbered according to codes defining their origin. 10 g of previously treated soil sample was diluted in 100 ml distilled water volume, and filtered by the WAH filtration device (2008-2012). Filtrates obtained from samples are stored for laboratory analysis (Plates 1 to 3).
Chemical analysis methods
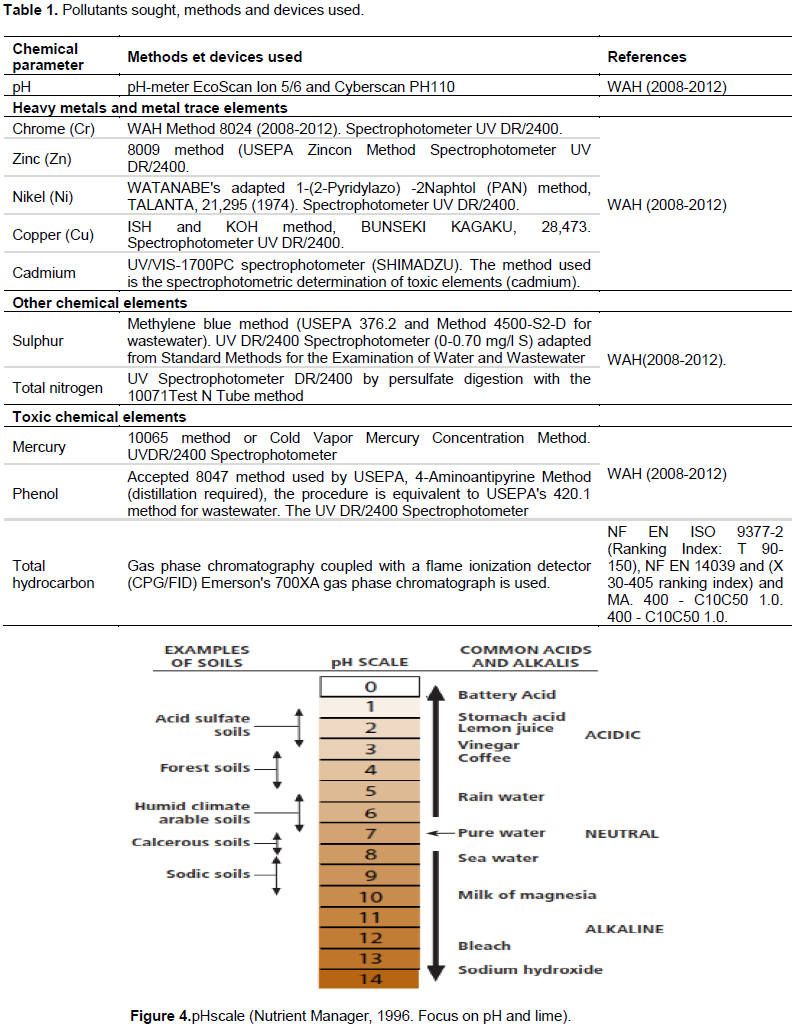
Chemical parameters determination methods are presented in
Table 1.Concentrations values obtained in mg/L are then converted
in mg/Kg of dry matter, according to these formulas:
The results obtained, are analyzed based on control samples by site and standards; it is also in comparison with the maximum, average and minimum values. The pH scale (Figure 4), which gives acidic solutions with a pH of less than 7 and basic or alkaline solutions with a pH greater than 7 (Nutrient Manager, 1996), has been used to measure the acidity and alkalinity of the soil solution. Soil pH is influenced by acidic and basic soil cations (Brady and Weil 1999).
Hydrogen potential
The pH measurements of samples from the different localities of Bongor Basin range from 4 to 9 with an average of 7.39. The average and maximum pH values are within the pH range of alkaline soil, and the minimum value of 4.8 is in the range of acid soil content (Figure 4). Values of pH close to 8 and above, within the alkaline soil range (Figure 4), are obtained from Koudalwa locality (BBS01 and BBS03), Ronier (BBS06 and BBS08), Ndoubadana (BBS11), Narenang (BBS17), Croisement Baobab (BBS22 and BBS23) and Croisement Ridina (BBS26 and BBS30). While the samples with pH values within acid pH interval are from Croisement Ridina locality (BBS27).
Concentration of heavy metals in soils samples from oil field sites
Chromium
The concentration of soil samples from various oil sites or near oil facilities ranges from 0.2 to 9.5 mg/kg with an average of 4.07 mg/kg, a standard deviation of 2.32 and a coefficient of variation of 0.57. These concentrations are within the range of standard values. Sample BBS08 from Ronier locality has low concentration (0.2mg/kg) of chromium (Figure 5). This concentration is as low as that of control sample BBCS10 from the same locality, which has a value of 1.5 mg/kg. The high chromium concentration value (9.5 mg/kg) is from sample BBS26 of Croisement Ridina locality. This concentration is very high compared to the control sample BBCS30 (3.50 mg/kg) of the same locality (Figure 5).
Nickel
Concentration level of Nikel in soil samples from various oil sites or installations ranges from 0.5 to 102 mg/kg, with an average of 25.67 mg/kg, a standard deviation of 24.57 mg/kg and a coefficient of variation of 0.96, pointing out high levels of Nikel concentration in these oil sites or localities. Some Nikel content values are not within the range of INERIS standard of France (2 -60 mg/kg) and Cameroonian standards of SONARA site, background content (≤15 mg/kg) and low contamination (15-30 mg/Kg). Concentrations of samples BBS07 and BBCS10 of Ronier locality, sample BBS13 in Ndoubadana locality and sample BBS17 in Narenang locality (Figure 6) have Nikel content values below INERIS standards of France. On the other hand, samples BBS06 from the locality of Ronier, BBS22 and BBS23 from Croisement Baobab locality have values above this standard. Compared to low contamination of Cameroonian standards of SONARA sites, sample BBS03 from Koudalwa locality, sample BBS06 from Ronier, sample BBS16 from Narenang, samples BBS22 and BBS23 from Croisement Baobab locality and samples BBS26 and BBS29 from Croisement Ridina have higher values (Figure 6).
Copper
Copper concentration in the study area ranges from 12.5 to 52 mg/Kg, with an average of 30.91 mg/Kg. The coefficient of variation is 0.34 with the high standard deviation of 10.59 mg/Kg, indicating high presence of copper in these different localities (Figure 7). Copper concentrations of all samples are within the range of Canadian standards (40-500mg/kg) and INERIS standards of France (2-60 mg/Kg). Concentrations of copper within the range of low contamination of Cameroonian standards of SONARA site (10- 30 mg/kg) are observed from samples BBS06, BBS07 and BBS08 of Ronier locality, sample BBS13 of Ndoubadana, samples BBS17 and BBS18 of Narenang, samples BBS21, BBS23 and BBS24 of Croisement Baobab locality (Figure7). However, it is observed from samples BBS01, BBS02, BBS03, BBS04 and BBS05 of Koudalwa locality, samples BBS11, BBS12 and BBS14 of Ndoubadana locality, sample BBS16 of Narenang, samples BBS26, BBS28 and BBS29 of Croisement Ridina, high values compared to low contamination level of Cameroonian standards of SONARA sites (10 - 30 mg/kg). The control sample BBS30 is the only one of low concentration compared to samples from the same locality (Figure 7).
Zinc
Zinc concentration of all soil samples analyzed ranges from 0.5 to 42.7mg/kg with an average of 15.63mg/kg and a coefficient of variation of 0.77. All samples have concentrations which are within the interval of Cameroonian standards (of the low contamination) of SONARA site (15-50mg/kg); they are low and within the range of Canadian standards (110, 500 and 1000 mg/Kg) and INERIS of France (40 - 180 mg/kg). This wide gap and values of zinc concentration with extremely low values compared to Canadian standards might be from the nature of the soil environment and climate conditions. Results have shown that all values of zinc concentration in Koudalwa locality are lower than that of the control sample BBCS05 of the same locality (Figure 8). In Ronier locality, zinc content of the control sample BBCS10 is lower than that of BBS06, BBS07 and BBS09 and higher than that of BBS08. For samples from the locality of Ndoubadana, zinc content of the control sample BBCS15 is below that of sample BBS11 and higher than that of samples BBS12, BBS13 and BBS14. Concerning the locality of Narenang, zinc concentrations of samples BBS16, BBS18 and BBS19 are higher than that of sample BBS17 and lower than the zinc content of control sample BBCS20. The zinc content of all samples at Croisement Baobab and Croisement Ridina are lower than that of control samples in these localities (BBS25 and BBS30 respectively) (Figure 8).
Cadmium
Cadmium detected from soil samples gives concentrations values that vary from 0 to 3.3mg/Kg with an average of 0.535mg/Kg and a coefficient of variation of 1.77, indicating strong presence of cadmium in soil of these environments. The high concentration values observed from samples BBS01, BBS02 of Koudalwa locality, BBS13 from the locality of Ndoubadana and BBS26 in Croisement Ridina, exceed the acceptable thresholds values of INERIS standards of France (0.2 - 0.7 mg/kg) and the low level of contamination of Cameroonian standards of SONARA site (1-2mg/kg) (Figure 9). These values of concentration are in the average contamination range of Cameroonian standards of SONARA site (>2 -≤5 mg/Kg).
Other chemical elements
The determination of the concentration of other elements such as Sulphur and Total Nitrogen samples has no significant results:
Sulphur
Sulphur content value of all samples in Bongor basin varies from 0.9 to 7mg/Kg; the average value is 4.26mg/Kg with a coefficient of variation of 0.42; that is an indicator of sulphur detection in soil of these localities. All of these values are very low and below the acceptable thresholds of the Canadian (400-2000mg/kg) and Cameroonian (60-120 mg/kg) (Figure 10) standards. Comparing the control samples to other samples from each locality, control sample BBCS05 in Koudalwa locality has higher sulphur content than all samples in that locality. In Ronier locality, the control sample has higher sulphur concentration than BBS07 in that locality. The control sample BBCS 15 has higher sulphur content than BBS11, BBS12 and BBS13 from Ndoubadana. The sulphur concentration of the control sample BBCS20 from Narenang is slightly above that of BBS17 and BBS19 of the same locality (Figure10). From the field observations, oil facilities have high standing ground to avoid stagnant water near theses installations therefore; drained oil spill and leakages by rain might lead to accumulation of oil content far from installations, where control samples are taken and making some of them to have high sulphur content.
Total nitrogen
Total nitrogen concentrations range from 0 to 56 mg/kg, the average value is 10.85mg/Kg, with a coefficient of 1.42. This indicates remarkable presence of nitrogen in the soil of these localities. All concentrations are below and within the Cameroonian standards of SONARA site (40-100 mg/kg). Control samples from the localities of Koudalwa (BBCS5), Ndoubadana (BBCS15) and Narenang (BBCS20) have higher nitrogen levels than other samples from these environments respectively. This low nitrogen value is as a result of oil content found in oil sites of Bongor basin with weight percentage of 0.26 W% (Anonymous 4, 2007). In addition, infiltration of nitrogen makes its content in soil relatively low in these areas. The control sample from the locality of Ronier has higher nitrogen content than that of BBS06 and BBS09 (Figure 11) sample. The control sample from Croisement Baobab is higher than that of BBS22. At Croisement Ridina, the control sample is slightly higher and higher than that of BBS26 and BBS29 respectively (Figure 11).


Toxic chemical elements
Mercury
The value of concentration ranges from 0.01 to 0.09 mg/Kg with the average value of 0.024 mg/Kg with the coefficient of variation of 0.79 which is underlining the presence of mercury in all soil samples from the different localities of Bongor oil zone. Individual mercury concentrations of samples are low and are within the concentration range value of the acceptable threshold of the INERIS standards of France (0.02-0.10 mg/Kg) and below the Canadian standard (0.2 - 10 mg/Kg) and Cameroonian standards of the SONARA site (0.5 - 2 mg/Kg).
The control sample from Koudalwa locality has the same concentration value as that of sample BBS02. At Ronier, mercury concentration of the control sample has similar value to that of samples BBS08 and BBS09 (Figure 12). Mercury content of the control sample from Ndoubadana locality is higher compared to that of samples BBS11 and BBS12. In Narenang locality the control sample has the same concentration value as that of samples BBS18 and BBS19. In Croisement Baobab locality, the control sample has higher mercury content than that of other samples from the same locality. At Croisement Ridina control sample has the same concentration value as that of the BBS26 and BBS28 (Figure 12) samples.
Phenol
Analysis of soil samples for the determination of phenol concentration gives values that vary from 6.5 to 79mg/kg with an average of 26.23mg/kg and a coefficient of variation of 0.62, indicating strong presence of phenol in soil of these different localities. All samples have very high sample concentration values in comparison to Canadian Class A and B (0.1 - 1mg/kg) and Cameroonian SONARA site standards (0.2 -1mg/kg); however they are below the INERIS standard threshold (500mg/kg). Considering Canadian standards Class C (10mg/kg), one could observe low levels of concentration from samples BBS07and BBCS10 of Ronier locality and BBS17 of Narenang.
The control sample from the locality of Koudalwa is greater than the concentration of all samples from the same locality. One can also observe higher content of phenol in the control sample of Ronier locality than that of sample BBS07 (Figure 13). It is equally shown that control sample from the locality of Ndoubadana is higher than that of BBS13 sample. The control sample from Narenang and Croisement Ridina has higher phenol concentration than that of samples BBS17 and BBS27. We have higher phenol content of control sample from Croisement Baobab locality than that of samples BBS21 and BBS24 (Figure 13). This higher content of phenol in control samples is because of climatic conditions as mentioned earlier.
Total hydrocarbons
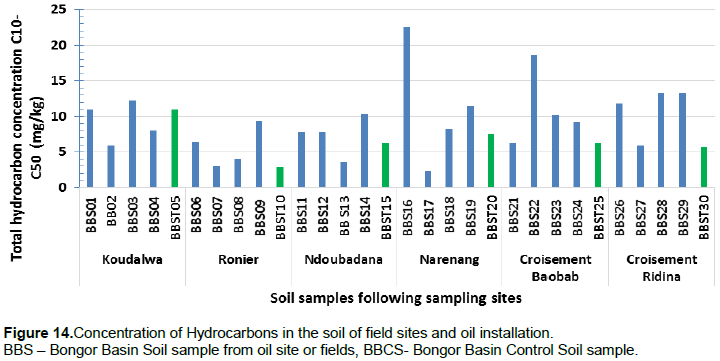
The concentration of total hydrocarbon of samples from different localities ranges from 2.4 to 22.6mg/kg, with an average value of 8.75mg/kg and a coefficient of variation of 0.51 expressing the presence of hydrocarbons in soil of these localities. We have low concentration values and are far below Canadian standards (300, 700 and 3500 mg/kg), INERIS standard of France (500 mg/kg) and Cameroonians standard of SONARA site (500 - 1000 mg/kg).It is observed that concentration of control sample in Koudalwa locality has the same value with sample BBS01 and higher than that of samples BBS02 and BBS4. In Ndoubadana and Narenang localities, control samples have higher total hydrocarbon content than that of samples BBS13 and BBS17, respectively. This phenomenon is in relation to the morphology of the zone (humidity of the soil) which appears to have an important role in the absorption of contaminants (oil product) by the sediments along water drainage (from rainfall), to different parts of the fields. It is also observed that, control sample of Croisement Baobab locality has the same concentration value with sample BBS21 (Figure 14).

Analysis of soil samples from Bongor oil sites for the determination of pollutants revealed the nature of contaminants that could disperse into surface water by runoff, alteration, erosion and then seep into groundwater.
The determination of the Nickel content gives high values of concentrations above the Cameroonian standard of SONARA site. High concentrations are observed from samples BBS03 (38.5 mg/Kg) of Koudalwa locality, BBS06 (102 mg/Kg) of Ronier locality, BBS16 (54 mg/Kg) of Narenang, BBS26 (50 mg/Kg) and BBS29 (39.5 mg/Kg) of Croisement Ridina locality. This soil contaminant comes from the nature of hydrocarbons, found in Bongor basin, which has 10g/g mass of constituents (Anonymous 4, 2007). These results obtained from Bongor Basin correspond with the one found in Bayelsa State, Nigeria, where the average nickel concentration (205 mg/kg) is above the permitted level (Okoro et al., 2020). Nickel is a metal heavily absorbed by soils but relatively mobile especially on acidic soils (Baize, 2000), so it is poorly accumulated by living organisms and seeps into groundwater (Bubb And Lester, 1996; Efsun and OlcayHüseyin 2015).
Considering Copper content of the soil samples from different localities, 16 out of 30 samples have high copper content which are above Cameroonian standards of SONARA site. These results are in line with the work carried out on sediments at Saint-François and Massawippi rivers banks in south-central of Quebec, which revealed higher levels of contamination with high concentrations of unusual copper according to the MDDEP (2004). High concentrations of copper observed in Absheron oil fields are above the accepted permitted levels of Azerbaijan Republic (Khalilova, 2015). These high concentrations of Cu could be in particular due to its use as corrosion inhibitors (Economides et al., 1989) and in electrical and electronic equipment (electromagnets, relays, distribution bars, switches, circuit boards), cathode-ray tubes, lightning rods or electronic gadgets abandoned at oil sites; which is also the case in Bongor basin oil sites. Similar results are presented with extremely high concentrations of copper at electronic waste sites in China (Zhang et al., 2012).
According to Frischer (2013), copper in the soil has significant adsorption on iron oxides, manganese, clay and organic matter with low mobility. These insoluble significant adsorption on iron oxides, manganese, clay and organic matter with low mobility. These insoluble compounds are present in the form of immobile precipitates in soils; they are also likely to change in nature, depending on physicochemical conditions and the presence of suspended particles. According to Maleckiet al. (1982), copper toxicity depends on their speciation, and copper is more bioavailable in soils that are low in organic matter (Streit 1984; Donkin and Dusenbery, 1993).
In the case of cadmium content of the samples, 8 out of 30 samples have concentrations above the acceptable threshold of INERIS standards of France and 4 out of 30 samples above the Cameroonian standard of SONARA site. The results from the analyses showed concentrations as high as of those carried out on industrial and anthropogenic discharge deposits in the two ports city of Sfax and Gabès (Chouba and Mzoughi-aguir, 2006) with respectively 10.42 mg/kg and 26.34 mg/kg. In the study area, this high concentration is from the nature of hydrocarbons found in Bongor Basin, which have 4.9 µg/g concentration of cadmium (Anonymous 4, 2007). The high content of Cadmum found might be from its mobility and its ability to accumulate in the upper horizons of the soil rich in organic matter (Onweremadu and Duruigbo, 2007). It could also come from alloys used for electrical conductors, fuses, coatings as anti-corrosion properties, which is unalterable in the air.
Analysis of samples from oil sites in the various localities of Bongor basin indicates high phenol concentrations that range from 6.5 to 79 mg/Kg. These sample concentration values are very high compared to Canadian standard Class A and B (0.1 -1mg/kg) and Cameroonian standards of SONARA site (0.2 – 1mg/kg), signifying high phenol soil contamination of these different localities in Bongor basin. Similar on-site studies of abandoned refinery in China have shown high concentrations of phenol compounds ranging from 0.01 to 232.96 mg/kg (Pei et al., 2012). Phenol was the main pollutant of oil shale semi-coke discharge leachates that contaminate surrounding soils in northeastern Estonia (Kahru et al., 2002). High concentration of phenol could be due to various surface water activities (treatment of large quantity of water produced from oil wells in Bongor basin), well stimulations and sand control techniques carried out in wells (Motta, 1993; API, 1991; Economides et al., 1989). Phenol is easily absorbed by clays once on the ground (Zhang and Spark, 1993). According to Howard (1989), phenol is mobile in the soil, soluble in water and moderately volatile; it can be easily leached from soils and contaminate groundwater by giving poor or bad water taste.
Detected parameters such as Chrome, mercury, sulphur, total nitrogen and total hydrocarbons from the soil samples analyzed have low levels of concentration in different localities during this study. This scenario is that concentrations often depend on events associated with spills and environmental conditions, hydrological conditions, e.g. sedimentary and climatic conditions that favor its migration deep beneath the subsurface (Nikanorov and Stradomskaya, 2003).The presence of mercury was detected from soil samples in Bongor with low concentration (giving a maximum value of 9 g/l) compared to the low Cameroonian standard contamination threshold of SONANRA site. Even at low concentrations, mercury is a major danger to microorganisms and other biota; these levels of concentrations might have adverse effects on the environment even at 5g/l (Boening, 1999, Orctet al., 2006). This low concentration of Hg in most soil samples taken from Bongor basin is the fact that, Hg easily evaporates as organo-mercury due to changes in climatic conditions (temperature) of the environment (Environmental Health - Safety Manual, 2000). The main sources of anthropogenic emissions of mercury, including other heavy metals (cadmium, lead, etc.) are thermal power plants (gas turbines from oil sites) and waste combustion industries (Vermillion et al., 2005).
The pH determination of soil samples from the Bongor basin gives an average value of 7.39 and is within the range of arable soil pH value, a maximum value of 8.85 in the alkaline soil range and a minimum of 4.8 that is in the acid range (Figure 7). The minimum value, which is within acid range could come from the nature of matrix stimulation fluids with the use of acids such as hydrochloric and hydrofluoric acid (Motta, 1993). And values within the alkaline range could be related to drilling mud and completion fluids mixed with sodium chloride, ammonium chloride fluids additives and as well as formation water produced with hydrocarbons to the surface (European Commission, 2019). Acid pH influences the mobility of heavy metals in soil; an alkaline pH limits the passage of heavy metals from solid phase to liquid phase in soil and then its transfer to plants (Thornton, 1996).
Compared to acid/base reactions, with a reduced pH, this enables most chemical elements transport, due to increase of their solubility; with acidic soil, this facilitates heavy metal elements dissolution contained in core mineral (Baize, 2000), therefore the transfer of these elements into deep aquifer formations.
Results from laboratory analyses revealed the nature of the pollutants in soil samples from various oil sites in Bongor basin, such as Ni, Cu, Cd, Hg and Phenol, which are indicators of soil contamination in these environments. Their values of concentration are 102, 52, 3.3, 0.09 and 79mg/kg respectively and above Cameroonian standard of SONARA site, Canadian standard and INERIS standard of France (500mg/kg). The determination of pH made it possible to assess the acid/base reactions of these environments and its influence on the mobility of metals in the soil. For this purpose, soil samples taken from Bongor oil sites have a maximum pH value of 8.85 that is within the alkaline soil range, with the average pH value of 7.39 in the range of the pH value of the arable soil, and a minimum of 4.8 within the range of acid soil content.
An alkaline pH limits the passage of heavy metals from the solid phase to liquid phase in soil, and a reduced pH favours the transport of most chemical elements to deep aquifer formations. The presence of these pollutants in soil taken from oil sites in Bongor basin whether low or high in concentration could be persistent in the environment and cause serious risks to environment and particularly to qualitative nature of ground water resources.
Further assessment of water pollution (pollutants) from surface waters (rivers and streams), traditional wells and human-motorized water boreholes in Bongor basins is needed. In addition, geochemical modelling studies of mechanisms governing mobility, infiltration or passage of pollutants from the soil to surface water and then groundwater in Bongor basin oil sites are very important in order to see the level of contaminations in the whole area. Results obtained will be valuable contributions for environmental protection measures and decisions.
The authors have not declared any conflict of interests.
REFERENCES
|
American Petroleum Institute (API) (1991). Bulletin on generic hazardous chemical categories list and inventory for oil and gas exploration and production industry, Bul E1.
|
|
|
|
Aniefiok EI, Usenobong FU, Margaret UI, Idongesit OI, and Udo JI, (2016). Petroleum Industry in Nigeria: Environmental Issues, National Environmental Legislation and Implementation of International Environmental Law." American Journal of Environmental Protection 4(1):21-37.
|
|
|
|
|
Anonymous 1 (2018). Archives of the Ministry of Energy and Petroleum of year 2015to 2018.Essochad Annual Report 2003-2011.
|
|
|
|
|
Anonymous 2 (2017). Archives of the Ministry of Energy and Petroleum of year 2015 to 2018.Environmental Impact Study, Field Development Project, Grand Baobab Oil and Prosopis Bongor II, A study conducted by ISM (Chad) For CNPC International (Chad) Co., Ltd., Volume 1, Final Version of 2012.
|
|
|
|
|
Anonymous 3 (2017).Archives of the Ministry of Energy and Petroleum of year 2015 to 2018.Madiago Basin Exploration Project, Environmental Impact Study conducted by ISM (Chad) For CNPC International (Chad) Co., Ltd. Volume 1.
|
|
|
|
|
Anonymous 4 (2007).Archives of the Ministry of Energy and Petroleum of year 2015 to 2018.Report of the feasibility study of the construction of the Chad refinery (N'Djamena Refinery).Volume I, Prepared by Wang Yehua for the CNPC. Is CHINA Design Institute, QINGDAO.
|
|
|
|
|
Atlas (2013). Observatory of the Sahara and Sahel Atlas of Vegetation Maps, Chad.
|
|
|
|
|
Baize D (2000). A guide to analysis in pedology: choice, expression, presentation, interpretation. 2nd ed. Paris, INRA.266 p.
|
|
|
|
|
Boening Dean W (1999).Ecological effects, transport, and fate of mercury: a general review. Chemosphere 40:1335-1351.
Crossref
|
|
|
|
|
Brady NC, Weil RR (1999). The Nature and Properties of Soils. 12 Edition. Prentice-Hall, Inc., Upper Saddle River, New Jersey 881 p.
|
|
|
|
|
Bruno C, Pascale L (2000). Oil in Africa violence against peoples, Research Group for an Alternative Economic Strategy. p. 175.
|
|
|
|
|
Bubb JM, Lester JN (1996). Factors controlling the accumulation of metals within fluvial systems. Environmental Monitoring and Assessment 41:87-105.
Crossref
|
|
|
|
|
Chouba Lassaad, Mzoughi-AGUIR N (2006). Trace metals (cd, bp, hg) and total hydrocarbons in the shallow sediments of the coastal fringe of the Gulf of Gabes. Marine Environment Laboratory, National Institute of Marine Science and Technology. Bulletin of the National Institute of Science and Technology Salammbô Sea 33 p.
|
|
|
|
|
Croset (2015). Oil Operations and Environmental Protection.
View
|
|
|
|
|
Da Motta EP (1993). Matrix Acidizing of Horizontal Wells, Phd. Dissertation. Austin: University of Texas at Austin.
|
|
|
|
|
Donkin SG, Dusenbery DB (1993). A soil toxicity test using the nematode Caenorhabditiselegans and an effective method of recovery.Archives of Environmental Contamination and Toxicology 25:145-151.
Crossref
|
|
|
|
|
Economides MJ, Nolte KG (1989). Reservoir Stimulation.Second Edition. Schlumberger Educational Services.
|
|
|
|
|
Efsun DF, OlcayHüseyin S (2015). Variations of soil enzyme activities in petroleum-hydrocarbon contaminated soil International Biodeterioration and Biodegradation pp.268-275.
Crossref
|
|
|
|
|
Environmental Health and Safety Manual (2000).Safe handling of mercury and mercury compounds.
|
|
|
|
|
European Commission (2019).Best available techniques guidance document on upstream hydrocarbon exploration and production, 27 February 2019.
View
|
|
|
|
|
External Compliance Monitoring Group (ECMG) (2009).Chad Export Project Report. Chad. Cameroon." Genova: D'AppoloniaS.p.A.
|
|
|
|
|
Frischer K (2013).In-depth diagnosis of potentially polluted soils, Sites and Soils potentially polluted by heavy metals analysis of health risks.
|
|
|
|
|
Global Water Partnership (GWP) (2013). The Lake Chad Basin Aquifer System. Global Water Partnership Transboundary Groundwater Fact Sheet, compiled by F Bontemps.
|
|
|
|
|
Howard PH (1989). Handbook of environmental fate and exposure data for organic chemicals, vol. 1.Lewis Publishers, Chelsea, MI. Initiative for Transparency in Extractive Industries in Chad (2014). EITI Framing Study, Fiscal Exercise.
|
|
|
|
|
Jacqueline MB, Emilio Lèbre La Rovere (2017). Environmental impacts of the oil industry. Encyclopedia of Life Support Systems (EOLSS).
|
|
|
|
|
Kahru A, Maloverjan A, Sillak H (2002). The toxicity and fate of phenolic pollutants in the contaminated soils associated with the oil-shale industry. Environmental Science and Pollution Research 9:27-33.
Crossref
|
|
|
|
|
Khalilova HK (2015). The Impact of Oil Contamination on Soil Ecosystem International Ecoenergy Academy, Baku, the Republic of Azerbaijan.
|
|
|
|
|
Malecki MR, Neuhauser EF, Loehr RC (1982). "The effect of metals on the growthand reproduction of Eiseniafoetida (Oligochaeta, Lumbricidae)."Pedobiologia 24:129-137.
|
|
|
|
|
MDDEP (2004). Soil protection and rehabilitation policy for contaminated land. Government of Quebec.
|
|
|
|
|
Nadjiam D (2013). Chad Resources: priority actions for sustainable action. Agriculture Systems at Risk; priority action towards Climate Change Adaptation and Launch of the Global Soil Partnership in West Africa", World Soils Parternaship.
|
|
|
|
|
Ngatcha BN, Mudry J, Leduc C (2008).The state of understanding on groundwater recharge for the sustainable management of transboundary aquifer in the Lake Chad Basin. Presentation at 4th International Symposium on Transboundary Water Management, Thessaloniki, Greece, 15-18 October 2008.
|
|
|
|
|
Nikanorov AM, Stradomskaya AG (2003). Oil products III bottom Sediments of freshwater bodies. Water Resources 1:98-102.
Crossref
|
|
|
|
|
Nutrient Manager (1996). Focus on pH and Lime. Newsletter of the Maryland Cooperative Extension Agricultural Nutrient Management Program. 3:2. Available on
View
|
|
|
|
|
Okoro Emmanuel, AmarachiOkolie G, Samuel Sanni E, Maxwell Omeje (2020).Toxicology of Heavy Metals to Subsurface Lithofacies and Drillers during Drilling of Hydrocarbon Wells.
Crossref
|
|
|
|
|
Onweremadu EU, Duruigbo CI (2007). Assessment of cadmium concentration of crude oil polluted arable soils.
Crossref
|
|
|
|
|
PANA (2009). National Climate Change Adaptation Programme (PANA-Chad), UNDP/UNFCCC.
|
|
|
|
|
Pei F, Luo ZJ, Peng JJ, Qi SH (2012).Phenols pollutants in soil and shallow groundwater of a retired refinery site.Huan Jing KeXue. Dec; 33(12):4251-5. Chinese. PMID: 23379149.
|
|
|
|
|
Practica Foundation, UNICEF and Enterprise Works/VITA (2010). Republic of Chad: feasibility study for manual drilling: mapping of favorable zones. Ministry of Environment, Water and Aquatic Resources. Practica/Enterprise Works/VITA/UNICEF.
|
|
|
|
|
Streit B (1984). "Effects of high copper concentrations on soil invertebrates (earthworms andoribatid mites): experimental results and a model."Oecologia 64:381-388.
Crossref
|
|
|
|
|
Thornton I (1996). Risk assessment related to metals: the role of the geochemist. Report of the International Workshop on Risk Assessment of Metals and their Inorganic Compounds, Angers, France, November 1996. International Council on Metals and the Environment.
|
|
|
|
|
United Nations Environmental Program (UNEP) (1997). Oil industry international exploration, & production forum', Environmental Management in Oil and Gas Exploration and Production:An Overview of Issues and Management Approaches, Vol. 2, UNEP/Earthprint.
|
|
|
|
|
Vermillion B, Brugam R, Retzlaff W, Baia I (2005).The sedimentary record of environmental lead contamination at St- Louis, Missouri (USA) area smelters. Journal of Paleolimnology 33:189-203.
Crossref
|
|
|
|
|
Wilcke W (2000). Polycyclic aromatic hydrocarbons (PAR) in soils - a review. Journal of Plant Nutrition and Soil Science 163(3):229-248.
Crossref
|
|
|
|
|
Zhang PC, Sparks DL (1993). Kinetics of phenol and aniline adsorption and desorption on an organic-clay. Soil Science Society of America Journal 57(2):340-345.
Crossref
|
|
|
|
|
Zhang WH, Wu Y X, Simonnot MO (2012). Soil contamination due to e-waste disposal and recycling activities: A review with special focus on China. Pedosphere 21(4):434-455.
Crossref
|
|