ABSTRACT
The concentration of cobalt was determined in wastewater, soil and vegetable (carrot, lettuce, onion, spinach, cabbage, tomato and okra) samples collected on seasonal basis from January, 2013 to September 2014 along Kubanni stream channels in Zaria. The results show cobalt levels in wastewater were in the range of 3.77 - 15.20 mg/L for the year 2013 and 4.74 - 15.20 mg/L in 2014; 0.63 - 3.57 mg/Kg for the year 2013 and 0.99 - 4.07 mg/Kg in 2014 for the soil while the vegetables had concentrations in the range of 1.25 - 8.75 mg/Kg for the year 2013 and 2.76 - 12.45 mg/Kg in 2014. Statistical analysis revealed no significant difference in cobalt levels across the sampling locations whereas significant difference (p < 0.050) were observed in seasons for wastewater and vegetables analyzed. Pearson correlation showed substantial (r = 0.726) relationship between cobalt levels in wastewater for the year 2013 and 2014, substantial (r = 0.799) relationship for soils between these two years and substantial (r = 0.720) relationship was also obtained for vegetables cultivated in 2013 to that of 2014, respectively. Cobalt concentrations in this study were higher than maximum contaminant levels set by Standard Organizations such as WHO and FAO in wastewater while below their limits in vegetables.
Key words: Cobalt level, Kubanni River, soil, vegetable, wastewater.
Cobalt is beneficial to human because it is part of vitamin B12. Exposure to high levels of cobalt results in lung and heart diseases and dermatitis. It is a key constituent of cobalamin which is known as vitamin B12, the primary biological reservoir of cobalt as an ultratrace element (Prasad, 2004). Bacteria in the guts of ruminant animals convert cobalt salts into vitamin B12, a compound which can only be produced by bacteria or arches. The minimum presence of cobalt in soils therefore markedly improves the health of grazing animals and an uptake of 0.20 mg/kg a day is recommended for them, as they can obtain vitamin B12 in no other way (Schwarz et al., 2000).
Industrial or municipal wastewaters are used for the irrigation of crops in periurban ecosystem, due to its availability and scarcity of fresh water. Irrigation with wastewater contributes to heavy metals contents in the soil. Heavy metals are harmful because of their non-biodegradable nature, long biological half-lives and their potentials to accumulate in different body parts (Wegelin et al., 1995). Heavy metals like cobalt are toxic because of their solubility in water. Low concentration of heavy metals has damaging effects on man and animals because there is no mechanism for their elimination in the body (Bahemuka and Mubofu, 1991). Wastewater contains substantial amounts of toxic metals which create problems (Sharma et al., 2009). High accumulation of these metals in agricultural soils through wastewater irrigation may not only result in soil contamination but affect food quality and safety (Mohsen and Seilsepour, 2008).
Soil is known as earth: it is the substance from which our planet takes its name. Soil is a vital resource of sustaining basic human needs, a quality food, food supply and a live able environment. Chemical analysis of soil is important for environmental monitoring and legislation (Catharine et al., 2011). It provides information on the fertility status, index of nutrient availability and bases for fertilizer recommendation (for a given crop) as well as planning of a nutrient management programme. Metals are introduced into aquatic systems as a result of the weathering of rocks and soils. For example, volcanic eruption and also several human activities involving the mining, processing and uses of metals and industrial material contain metal contaminants. Soil whether in urban or agricultural areas represent a major sink for metals released into the environment from a variety of anthropogenic activities (Fraser, 2004).
Vegetables provide accessible sources of essential vitamins (particularly ascorbic acid, niacin, riboflavin and thiamine) and minerals (such as calcium and iron), as well as supplementary protein and calories (FAO, 1988). Vegetables promote intake of essential nutrients from other foods by making them more palatable (Taylor, 1996; Oke, 1980). They provide dietary fibre to improve digestion and health, and they are essential for balanced diets (Koch et al., 1965). In developed countries, average daily consumption of vegetables is estimated to be about 238 g per capita (FAO, 1988). For the developing countries, it is only 135 g per capita. Availability per capita per day is estimated at about 60 g in Southeast Asia and sub-Saharan Africa (AVRDC, 1991) and 90-100 g in Latin America and South Asia. These average levels do not provide adequate amounts of essential nutrients. Moreover, they mask the fact that low income group consumes less than high income group, a pattern that is accentuated in rural areas, where income are lower than in urban areas (AVRDC, 1991).
Analysis of heavy metals found in vegetables from some cultivated irrigated gardens in the Kano metropolis, Nigeria were investigated by Lawal and Audu (2011). From results they obtained, the vegetable samples from Jakara indicated highest mean levels of Co (1.14±0.17 mg/Kg), Cu (7.50±1.08 mg/Kg), Zn (18.89±1.93 mg/Kg) and Cr (0.85±0.10 mg/Kg) while those from Sharada indicated highest levels of Ni (2.02±0.35 mg/Kg) and Pb (1.60±0.53 mg/Kg). They reported increased danger of growing vegetables on soils irrigated with contaminated industrial and domestic wastewater. This study is aimed at ascertaining the extent to which cobalt is accumulated in wastewater, soil and vegetables through man-made activities.
Sampling
Wastewater samples from Kubanni stream were obtained from five different sampling points on a four month basis along the stream channels for the period of two years giving total number of thirty (30) samples. Sampling was conducted in the harmattan, dry and rainy seasons. Wastewater samples were collected using composite sampling technique in a polyethylene plastic container that were previously cleaned by washing in non-ionic detergent and then rinsed with tap water and soaked in 10% HNO3 for 24 h and finally rinsed with deionized water prior to usage (Ademoroti, 1996). During sampling, sample bottles used were rinsed with sampled water three times and then filled to the brim at a depth of one meter below the wastewater from each of the five designated sampling points. Wastewater sample bottles were labelled, stored in ice-blocked coolers and transported to the laboratory while in the laboratory; they were stored in the refrigerator at about 4°C prior to the analysis (APHA, 1998). Soil samples were collected at three depths (0-5, 5-10 and 10-15 cm) from both sides of the river banks by using spiral auger of 2.5 cm diameter. Soil samples were randomly sampled and bulked together to form a composite sample from each designated point giving total number of thirty (30) samples. They were then put in clean plastic bags, labelled and transported to the laboratory. The full grown vegetable of [spinach (Amaranthus hybridus), lettuce (Lactuca sativa), cabbage (Brassica oleracea), carrot (Daucus carota), okra (Hibiscus esculentus), onion (Allium cepa) and tomato (Lycopersicon esculenetum)] were randomly handpicked from various garden plots along Kubanni stream channels using hand-gloves, bulked together to form a composite sample, wrapped in big brown envelopes giving total of forty-two (42) samples, labeled accordingly and transported to the laboratory.
Sample treatment
Wastewaters used for cobalt determination were acidified at the points of sampling with 5 cm3 of concentrated HNO3 as to avoid microbial activities on the wastewaters which might reduce the concentrations of intended cobalt before analysis and they were kept in a refrigerator prior to analysis (APHA, 1998). Soil samples were air-dried, crushed and passed through 2 mm mesh sieve. The soil samples were then put in clean plastic bags, sealed and labelled accordingly (Samira et al., 2009). Each vegetable samples were washed with tap water, followed by deionized water, air dried in the laboratory, grounded to powder and sieved using 250 µm sieve (Munson and Nelson, 1990).
Digestion of Wastewater Samples for Cobalt Determination
1000 cm3 of each wastewater sample was transferred into a beaker and 50 cm3 concentrated HNO3 were added. The beakers with the content were placed on a sand bath and evaporated down to about 20 cm3. The beakers were cooled and another 5 cm3 concentrated HNO3 were added to each beaker. The beakers were covered with watch glasses and returned to the sand bath. The heating was continued and then small portion of HNO3 was added onto each beaker until the solutions appeared light colour and clear. The beakers wall and watch glasses were washed with deionized-water and the samples were filtered to remove any insoluble materials that could clog the atomizer. Each sample volume was made up to 100 cm3 with deionized water (Ademoroti, 1996). Determination of Co in the wastewater sample was done at 241 nm wavelengths using Alpha-4 Model Atomic Absorption Spectrophotometer (AAS) as described by Association of Official Analytical Chemist (AOAC, 1995).
Determination of cobalt in soil samples
Two grams of each soil sample was weighed into acid-washed glass beaker. Soil samples were digested by the addition of 20 cm3 of aqua-regia (mixture of HCl and HNO3 in ratio 3:1) to each soil sample and 10 cm3 of 30% H2O2 were added in small portion to avoid any possible overflow leading to loss of material from the beakers. The beakers were covered with the watch glasses and heated on a water bath for 2 h at 90°C. The beakers wall and watch-glasses were washed with deionized water and the samples were filtered out to separate the insoluble solid from the supernatant liquid. Each soil sample was made up to 100 cm3 with deionized water to the mark levels. It was then analyzed for Co at 241 nm wavelengths using Alpha-4 Model Atomic Absorption Spectrophotometer (AAS) as described by Association of Official Analytical Chemist (AOAC, 1995).
Digestion of vegetable samples for cobalt determination
Three grams of the dry sample of each vegetable sample was ashed using Muffle furnace that was set at 450°C until a constant weight was obtained. On cooling, the ash was transferred to a decomposition flasks and 1cm3 of concentrated HNO3 was added. The content was refluxed on a hot plate for 40 min and on cooling 20 cm3 of deionized water was added, boiled for 3 min and filtered. 10 cm3 of 2 M HNO3 was added to the resulting solutions in a 100 cm3 volumetric flask. They were made up to the mark with deionized water, cobalt was determined at 241 nm wavelengths using Alpha-4 Model Atomic Absorption Spectrophotometer (AAS) as described by Association of Official Analytical Chemist (AOAC, 1995).
The results of cobalt in wastewater, soil and vegetables analyzed were expressed in form of bar-charts using Microsoft Excel (Window 7 Professional), the results obtained were subjected to one way Analysis of Variances (ANOVA) and Pearson Product Moment Correlations (PPMC) using Statistical Package for the Social Sciences (SPSS) 20.0 version software. Null hypothesis was adopted and this was set at 95% Confidence Mean level to check if there is significant difference in the concentrations of cobalt analyzed. Statistical decision for Pearson Correlation Coefficients (r) was taken as follows;
(i) If 0.05 ≤ r ≤ 0.20 there is negligible relationship
(ii) If 0.21 ≤ r ≤ 0.40 there is low relationship
(iii) If 0.41 ≤ r ≤ 0.60 there is moderate relationship
(iv) If 0.61 ≤ r ≤ 0.80 there is substantial relationship
(v) If 0.81 ≤ r ≤ 1.00 there is very high relationship (Robert, 1992)
Figure 1 presents cobalt levels in wastewater from Kubanni stream channels. The concentrations determined were in the range of 3.77 - 15.20 mg/L for the year 2013. Highest level of 15.20 mg/L was obtained at Tundun-wada during harmattan season and closely followed by 14.75 mg/L at Industrial area along Jos road in the dry season. High concentrations were also observed at Unguwa-fulani (13.08 mg/L), 12.50 mg/L at Industrial area along Jos road and 12.05 mg/L at Tundun-

wada sampling site all in the dry season whereas least level of 3.77 mg/L was found in rainyseason at Kwangila sampling site. High concentration of cobalt in harmattan and dry seasons could be as a result of industrial effluents being discharged to Kubanni River from nearby industries coupled with harmattan-dusts as suggested by Butu (2013) and Nwadiogbu et al. (2013). In the year 2014, concentrations of the cobalt in wastewater were in the range of 4.74 - 15.20 mg/L. Highest level was noted at Tundun-wada (15.20 mg/L) during the dry season and closely followed by 14.80 mg/L from Industrial area along Jos road during the harmattan season. High levels of cobalt were also observed at Tundun-wada (13.74 mg/L) in the harmattan season, 13.50 mg/L during the dry season at Industrial area along Jos road and 11.41 mg/L at Unguwa-fulani in the harmattan season while the least concentration of 4.74 mg/L was found at Kwangila sampling site. High levels of cobalt at Tundun-wada and Industrial area along Jos road could be traced to anthropogenic activities in the sampling sites as suggested by Butu (2013).
Comparing the results of 2013 and 2014 there was gradual increase in the cobalt concentrations from the rainy season 2013 (3.77 - 7.50 mg/L) to that of 2014 (4.74 - 9.84 mg/L). The chart also revealed high levels of cobalt during the harmattan (8.79 - 14.81 mg/L) and dry (5.73 - 15.20 mg/L) seasons of both years however, least concentration for cobalt was obtained in rainy season, 2013 as its concentration was in the range of 3.77 - 7.50 mg/L (Figure 1). All the sampling sites had cobalt levels above permissible limit set by FAO/WHO, 1985 (0.05 mg/L). Akan et al. (2008) reported 2.34 - 5.23 mg/L as cobalt level in wastewater indicating this study had high level of cobalt.
Analysis ofvariance in Table 1 indicates, p = 0.040 <0.050 shows that there is significant difference in cobalt concentrations from one sampling site to another throughout the periods of analyses. This is reflected from their mean and standard deviation as thus; Kwangila (6.547±2.118), Unguwa-fulani (9.690±2.731), Sabon-gari (8.130±1.850), Tundun-wada (11.433±4.202) and Industrial area along Jos road (11.532±3.770), respectively. ANOVA Table 1 also reveals p = 0.604 > 0.050 means there is no significant difference in cobalt levels from one season to season. This indicates cobalt concentration does not change significantly within the period of sampling when harmattan season 2013 compared with that of harmattan season 2014 as it showed from their mean and standard deviation as thus; harmattan season 2013 (10.814±3.631), dry season 2013 (8.246±4.004), rainy season 2013 (8.774±2.693), harmattan season 2014 (11.512±3.132), dry season 2014 (8.450±3.851) and rainy season 2014 (9.002±3.778) respectively.
Pearson Product Moment Correlation (PPMC) was conducted to establish the relationship between cobalt levels in wastewater for the year 2013 and 2014. Statistical data showed mean with standard deviation level for cobalt to be 9.107±3.624 in 2013 while 9.825±3.374 was obtained in 2014. Statistical analysis indicated Pearson correlation (r) = 0.726, degree of freedom (df) = 13 and p = 0.002 < 0.050 indicates that there is substantial relationship between cobalt levels in wastewater for the year 2013 and 2014 respectively (Table 2). The decision is justified from their mean as they are very close.
Cobalt concentrations in soil from Kubanni stream channels are presented in Figure 2. Concentration range of 0.63 - 3.57 mg/Kg was obtained in the year 2013.
Highest level was found at Sabon-gari (3.57 mg/Kg) during dry season followed by 2.75 mg/Kg at Industrial area along Jos road during the same season. High levels were also observed at Industrial area along Jos road (2.50 mg/Kg) during harmattan season, 2.28 mg/Kg at Tundun-wada during dry season and 2.23 mg/Kg at Unguwa-fulani during the same dry season while the lowest level of 0.63 mg/Kg was recorded at Kwangila sampling site in the rainy season. High cobalt concentrations during harmattan and dry seasons might be as a result of excessive use of wastewater to irrigate the farmland as suggested by Kumar et al. (2009). Generally, cobalt concentration was drastically reduced during rainy season as it had level ranging from 0.63 - 1.25 mg/Kg. This could be related to dilution effect as suggested by Chapman (1997). In the year 2014, cobalt levels were in the range of 0.99 - 4.07 mg/Kg as determined. Highest concentration was noticed at

Sabon-gari (4.07 mg/Kg) during dry season, followed by 3.74 mg/Kg at Tundun-wada sampling site but in the same dry season. This might be as result of anthropogenic sources of contamination from nearby dump-sites as suggested by Srinivas et al. (2009). Other sampling sites with high levels of cobalt were Industrial area along Jos road (3.08 mg/Kg) during the dry season, Sabon-gari (2.97 mg/Kg) during the harmattan season, Kwangila (2.54 mg/Kg) in the dry season and Unguwa-fulani (2.29 mg/Kg) also in the dry season whereas low concentrations were noticed at Kwangila (1.21 mg/Kg) and Sabon-gari (0.99 mg/Kg) sampling sites both in the rainy season. Comparing the results of 2013 to that of 2014, there was a reduction in cobalt level from the dry season (1.35 - 3.57 mg/Kg) to the rainy season (0.63 - 1.25 mg/Kg) in both years however, there was build-up in cobalt levels from the harmattan season (1.85 - 3.57 mg/Kg) to the dry season (2.29 - 4.07 mg/Kg) of both years. Least level for cobalt was recorded in the rainy season of both years although there was build-up in its concentration from rainy season, 2013 (0.63 - 1.25 mg/Kg) to that of rainy season, 2014 (0.99 - 2.05 mg/Kg). This might be connected to high application of manure, herbicides, fungicides and fertilizers in 2014 as these chemicals are rich in Cd, Co, Pb and Zn as suggested by Yasmeen et al. (2010).
Analysis of variance in Table 3 indicates, p = 0.280 > 0.050 this means that there is no significant difference in cobalt concentrations among the soil of sampling sites. Their mean and standard deviation clarify these; Kwangila (1.467±0.563), Unguwa-fulani (2.060±1.279), Sabon-gari (2.698±1.168), Tundun-wada (2.188±0.751) and Industrial-area along Jos road (2.254±0.608) respectively. This might be as a result of similar geological formation of soil from the sampling sites as suggested by Butu (2013). Also, Table 3 ANOVA indicates p = 0.915 > 0.050 this means that there is no significant difference in cobalt levels from one season to another within the periods of sampling. Their results showed that; harmattan season 2013 (1.764±0.758), dry season 2013 (1.962±1.073), rainy season 2013 (2.066±0.609), harmattan season 2014 (2.386±1.063), dry season 2014 (2.370±1.386) and rainy season 2014 (2.253±1.386), respectively.
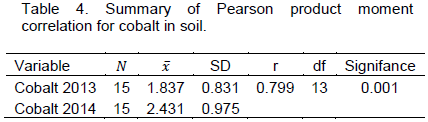
Table 4 presents Pearson product moment correlation for cobalt levels in soil between the year 2013 and 2014. Statistical data showed mean with standard deviation level of cobalt to be 1.837±0.831 in the year 2013 while 2.431±0.975 were obtained in the year 2014 with the degree of freedom (df) = 13, Pearson correlation (r) = 0.799 and p = 0.001 < 0.050 indicates that there is substantial relationship between cobalt level in soil for 2013 to that of 2014. This decision is jusified as analysis of variance showed similar results (no significant difference).


Cobalt levels in vegetables collected along Kubanni stream channels is presented in Figure 3. In the year 2013, the concentrations determined were in the range of 1.25 - 8.75 mg/Kg. Highest level was found in carrot (8.75 mg/Kg) followed by onion (7.50 mg/Kg) both in the harmattan season. High level was also observed in carrot (6.64 mg/Kg) in dry season, in addition similar concentration of 6.25 mg/Kg was noticed in tomato, carrot and spinach but in different seasons. Low concentrations of 1.75 and 1.25 mg/Kg were obtained in lettuce during dry and rainy seasons. Harmattan season showed more accumulation of cobalt in 2013 with concentration in the range of 3.70 - 8.75 mg/Kg than other seasons (Figure 3). This could be related to harmattan-dusts and extensive use of wastewater for irrigation as suggested by Kumar et al., (2009). Vegetables analyzed had concentrations in the range of 2.76 - 12.45 mg/Kg for the year 2014. Highest level was found in carrot (12.45 mg/Kg) followed by tomato (9.25 mg/Kg) and spinach (8.45 mg/Kg) all these results were obtained in the harmattan season. High concentrations were also noticed in onion (6.40 mg/Kg), lettuce (5.37 mg/Kg) both in harmattan season and 6.01 mg/Kg was recorded in carrot during dry season. Low level of cobalt was observed in rainy season from lettuce (2.04 mg/Kg) and 1.55 mg/Kg in onion. This might be related to dilution effect as suggested by Chapman (1997). Comparing the

results obtained for the year 2013 and 2014, harmattan season 2014 showed more accumulation of cobalt (2.77 - 12.45 mg/Kg) than harmattan season 2013 (3.80 - 8.75 mg/Kg). No much difference was observed in dry season of both years as they showed concentrations in the range of 1.75 - 6.64 mg/Kg for the year 2013 and 1.55 - 6.01 mg/Kg for the year 2014. Carrot showed more accumulation of cobalt than other vegetables analyzed with levels of 4.81 - 12.45 mg/Kg while okra was observed with least concentrations of 2.01 - 4.37 mg/Kg. Lettuce and cabbage were moderate in their levels as they had concentrations between (1.25 - 5.37 mg/Kg) and (2.50 - 3.80 mg/Kg), respectively. The cobalt levels analyzed were below permissible limit set by FAO/WHO, 2001 (50.00 mg/Kg) thereby these vegetables are free of its contamination. The present study had similar level of cobalt in cabbage with reported concentrations by Mohsen and Seilsepour, 2008 (0.10 - 3.18 mg/Kg) but less than reported levels by Lawal and Audu (2011) as they reported 1.14±0.24 mg/Kg for vegetables grown in irrigated garden.
Analysis of Variance in Table 5 shows, p = 0.012 < 0.050 this means that there is significant difference in cobalt concentrations from one species of vegetable to another as observed by Clemens (2001). This is more illustrated from their mean and standard deviation as thus; carrot (7.485±2.750), lettuce (2.807±1.517), onion (4.655±2.470), spinach (4.417±2.404), cabbage (3.682±0.719), tomato (4.725±2.657) and okra (3.243±0.878), respectively. The same Table 5 for ANOVA shows, p = 0.757 > 0.050 this means that there is no significant difference in cobalt levels from one season to another. This could be explained from their mean and standard deviation as thus; harmattan season 2013 (4.387±3.012), dry season 2013 (3.426±1.690), rainy season 2013 (5.169±2.636), harmattan season 2014 (5.209±3.638), dry season 2014 (4.183±1.313) and rainy season 2014 (4.210±1.634) respectively. In addition, Table 5 reveals p = 0.000 < 0.050 means that there is significant difference in cobalt concentrations in wastewater, soil and vegetables of the sampling sites. It implies that each constituent (wastewater, soil and vegetable) accumulates cobalt at different rate as reflected from their mean and standard deviation; wastewater (9.534±3.501), soil (2.308±1.358) and vegetable (4.431±2.394) respectively.
Pearson Product Moment Correlation (PPMC) is presented in Table 6 to show relationship between cobalt levels in vegetables for the year 2013 and 2014. Statistical analysis showed that the mean with standard deviation of 4.357±2.030 were obtained for 2013 and 4.500±2.759 for 2014. It also revealed Pearson correlation (r) = 0.720, degree of freedom (df) = 19 and p = 0.001 > 0.050 this means that there is substantial relationship between cobalt level in vegetables for the year 2013 and 2014 respectively.
There is need to find means of removing this heavy metal (cobalt) which might make these vegetables unsuitable for human consumption in future by stop using wastewater to irrigate the farmland in the studied area and stop indiscriminate discharge of refuse on the body of Kubanni River by providing appropriate dumpsites within the vicinity for this purpose.
The authors did not declare any conflict of interest.
REFERENCES
|
Ademoroti CMA (1996). Standard Method for Water and Effluents Analysis. Foludex Press Ltd., Ibadan. pp. 22 - 23, 44 - 54,111 - 112.
|
|
|
|
Akan JC, Abdulrahman FI, Dimari GA, Ogugbuaja VO (2008). Physicochemical Determination of Pollutants in Wastewater and Vegetable Samples along the Jakara Wastewater Channel in Kano Metropolis, Kano State, Nigeria. J. Am. Sci. 6:78-87.
|
|
|
|
|
APHA (1998). Standard Methods for the Examination of Water and Wastewater, 17th edition, Washington D.C. pp. 1269 - 1280.
|
|
|
|
|
Asian Vegetable Research and Development Centre (AVRDC) (1991). Vegetables Research and Development in the 1990's (A strategic Plan) Taipei. pp. 4 - 10.
|
|
|
|
|
Association of Official Analytical Chemist (AOAC) (1995). Official Methods of Analysis. 14th Edition, Washington DC. pp. 142-158.
|
|
|
|
Bahemuka TE, Mubofu EB (1991). Heavy metals in edible green Vegetables Grown along the site of the Sinza and Msimbazi River in Dares Salaam, Tanzania. Food Chem. 66: 63 - 66.
Crossref |
|
|
|
|
Butu AW (2013). Concentration of Metal Pollutants in River Kubanni, Zaria, Nigeria. J. Nat. Sci. Res. 3:19-25.
|
|
|
|
|
Catharine AR, Christine LT, Ann LY, Heather BD (2011). Dietary Reference Intakes for Vitamin D and Calcium. Institute of Medicine, 2011. Retrieved 31 March, 2011 from http://www.nap.edu/caterlog.php?recordid=13050.
|
|
|
|
|
Chapman D (1997). Water Quality Assessment. A Guide to the use of Biota, Sediments and Water in Environmental Monitoring, 2nd Edition, E & F Spon, London. File: A//:Hydrology and Water Quality of Lake Merced.htm.
|
|
|
|
Clemens S (2001). Molecular Mechanisms of Plant Tolerance and Homeostasis. Planta 4:475 - 486.
Crossref |
|
|
|
|
FAO/WHO (1985). Joint/WHO Expert Committee on Food Additives 1999. Summary and Conclusions. Proceedings of the 53rd Meeting, Rome, June 1 - 10, 1999.
|
|
|
|
|
Food Agricultural Organization/World Health Organization (FAO/WHO) Standards, (2001). Codex Alimentarius Commission, Rome.
|
|
|
|
|
Food and Agricultural Organization (1988). Production Year Book. Vol. 42, FAO, Rome
|
|
|
|
|
Fraser PM (2004). What is soil? Retrieved from http://www.compostingvermont.org/artilcles/whatissoil.htm 24th July, 2010.
|
|
|
|
|
Koch B, Kota M, Horvath MI (1965). Fodder Crops as Leafy Protein. Agrobotanica 1:19-28.
|
|
|
|
|
Kumar NJ, Soni HI, Rita NK, Bhatt IJ (2009). Hyperaccumulation and Mobility of Heavy Metals in Vegetable Crops in India. J. Agric. Environ. 10:10-20.
|
|
|
|
|
Mohsen B, Seilsepour M (2008). Investigation of Metals Accumulation in Some Vegetables Irrigated with Wastewater in Shahre Rey, Iran and Toxicological Implications. American-Eurasian J. Agric. Environ. Sci. 4:86-92.
|
|
|
|
|
Munson RD, Nelson WL (1990). Principle and Practices in Plants Analysis in "Soil Testing and Plant Analysis" (ed) Westernan, R.L.; Mandison, SSSA. pp. 359-387.
|
|
|
|
|
Nwadiogbu JO, Nwankwere ET, Eze KA, Chime CC (2013). Trace Metals in Airborne Harmattan Dust in Ahmadu Bello University Zaria, Nigeria. Arch. Appl. Sci. Res. 5:159-163.
|
|
|
|
|
Oke OL (1980). Amaranth in Nigeria. Proceeding of 2nd Amaranths Conference, Emmaus P.A. Rodel Press. pp. 8 - 10.
|
|
|
|
Prasad MNV (2004). Heavy Metal Stress in Plants, 2nd Edition, Springer, United Kingdom. pp. 484-487.
Crossref |
|
|
|
|
Robert J (1992). Elementary Statistics. 6th Edition. PWS Publishers, Wadsworth Inc, USA. pp. 120 - 129.
|
|
|
|
|
Samira AB, Elferjani HS, Haroun FA, Abdelnabi FF (2009). Determination of Available Nitrate, Phosphate and Sulfate in Soil Samples. Int. J. PharmTech Res. 3: 598-604.
|
|
|
|
Schwarz FJ, Kirchgessner M, Stangl GI (2000). Cobalt Requirement of Beef Cattle - Feed Intake and Growth at Different Levels of Cobalt Supply. J. Anim. Physiol. Anim. Nutr. 83(3):121-128.
Crossref |
|
|
|
Sharma RK, Agrawal BM, Marshall FM (2009). Heavy Metals in Vegetables Collected from Production and Market sites of a Tropical Urban area of India. Food Chem. Toxicol. 47:583-591.
Crossref |
|
|
|
Srinivas TN, Rao SR, Kumar KS (2009). Trace Metal Accumulation in Vegetables Grown in Industrial and Semi Urban area: A case study. Appl. Ecol. Environ. Res. 7:131-139.
Crossref |
|
|
|
|
Taylor OA (1996). Potentials of Grain Amaranth Utilization as Food. Proceedings of National Training Workshop on Grain Amaranth Production and Utilization. NIHORT, Ibadan, Nigeria. pp. 17-28.
|
|
|
|
Wegelin T, Jenka B, Ether R (1995). Heavy Metals in Soils and Plants of Allotment Gardens in the City of Zurich, Switzerland. Soil Environ. 5:269-272.
Crossref |
|
|
|
|
Yasmeen K, Versiani M, Arain R, Haque Q, Khan N, Ali S, Langha A (2010). Enhanced Metal Levels in Vegetables and Farm Soil Irrigated with Industrial Wastewater. J. Appl. Sci. Environ. Manage. 14:95 - 99.
|
|