ABSTRACT
Dodowa serves as a major peri-urban community close to the Accra Metropolis with increasing population, urbanization and settlements. Lack of access to basic infrastructural facilities including water and sanitation has hampered the development of the community. Dodowa has irregular access to pipe-borne water therefore the community resorts to other means of getting potable water. It is against this background that this study was conceived to assess the quality of drinking water sources in the community. Groundwater (Hand-Dug-Wells), stored water from pipes and mobile tanker water services were sampled to ascertain their quality since they were the major sources of water supply in the community. In all, 100 samples were collected for four months, 8 hand dug wells and 2 boreholes were sampled for groundwater, 10 stored water in either poly tanks or concrete tanks and then 5 mobile tanker water services were also sampled and physico-chemical and bacteriological parameters were assessed. The sources of water were also assessed to ascertain their quality. The available water sources in the Dodowa township could not be considered potable especially the groundwater which had high levels of turbidity, total dissolved solids (TDS), chloride, sodium and iron and therefore needs treatment before use. All the water sources had coliform bacteria which could cause water borne disease such as cholera, typhoid, dysentery and diarrhea thus unsafe for drinking without treatment.
Key words: Physico-chemical, microbiological, groundwater, potable water, water quality, Dodowa, coliform bacteria.
Cairncross and Valdmanis (2006) defined access to water supply as the availability of at least 20 L/capita/day from a source within 1 km of the user’s dwelling. This accessibility to an improved water supply can either be house connections and public or community sources. Globally, 1.1 billion people lacked access to improved water sources, which is 17% of the global population. Also, 2.6 billion people which is 42% of the world’s population lacked access to improved sanitation. There is a link between good water and sanitation. In sub-Saharan Africa, 42% of the population is still without improved water and also sanitation coverage is a mere 36% (WHO, 2004).
Each human being needs to consume several litres of fresh water daily to sustain his or her life. Since life is dependent on water, quality is paramount. However, fresh water is at a premium. Over 97% of the world’s water is seawater thus unsuitable for drinking and for most agricultural purposes (Baird, 2000).
The 2010 population and housing census puts Ghana’s population at twenty four million, six hundred and fifty eight thousand, eight hundred and twenty three thousand people (24,658,823) with a growth rate of 2.5% (Ghana Statistical Service, 2014). It is without doubt that the population of Ghana is increasing at a rapid pace. Although most of the population growth takes place in the cities, majority of Ghana’s population still live in rural areas (Schäfer et al., 2010).
According to the 2010 population and housing census, 46.5% have access to pipe borne water while 29.1% use borehole or protected well. In addition, 9.4% rely on sachet/bottled water. About 10.6% of households depend on surface water such as rivers, streams, dams, canals and ponds for drinking. Less than 1% (0.7%) depend on rainwater while 1.1% depend on tanker/ vendor services (Ghana Statistical Service, 2014).
Water supply and sanitation in Ghana faces a lot of problems. Poor access to improved water and sanitation in Ghana is attributed to a number of reasons which include weak sector policies, lack of political will, weak local government capacity and inadequate financing (Osumanu, 2010).
This study seeks to find the other sources of drinking water in the Dodowa community since that of the Ghana Water Company Limited is irregular. The quality of the other sources of drinking water will also be looked at. This research is also being conducted so that other researchers will build upon it.
Dodowa serves as a major peri-urban community close to the Accra Metropolis with increasing population, urbanization and settlements. Lack of access to basic infrastructural facilities including water and sanitation has hampered the development of the community. Dodowa has irregular access to pipe-borne water, therefore the community resorts to other means of getting potable water. Water sources available to the people include boreholes and hand dug wells. Many people in Dodowa store water in containers such as poly tanks and concrete tanks. They also patronize the services of water tankers. This research, therefore seeks to find the quality of boreholes and hand dug wells, stored water facilities and water tanker services as drinking water in the community and to provide data to help inform planning and decision making to ensure improvement in provision of water supply quality and facilities in the area. According to the Public Utilities Regulatory Commission (PURC) of Ghana, majority of urban households depend on secondary water providers like tankers, cart operators and domestic vendors, at a cost that is 12 times more than normal (paying too much for poor services). It is against this background that the study was initiated to access the quality of drinking water sources in the community. Groundwater (Boreholes and hand dug wells), stored water from pipes and mobile tanker services were sampled to ascertain their physico-chemical and bacterialogical quality since they were the major sources of water supply in the community. Sources considered as improved water are piped public water into homes, public standpipe, borehole, protected (lined) dug well, protected spring, and rainwater collection; unimproved are unprotected wells and springs, vendors, and tanker-trucks (WHO and UNICEF, 2000).
Study area
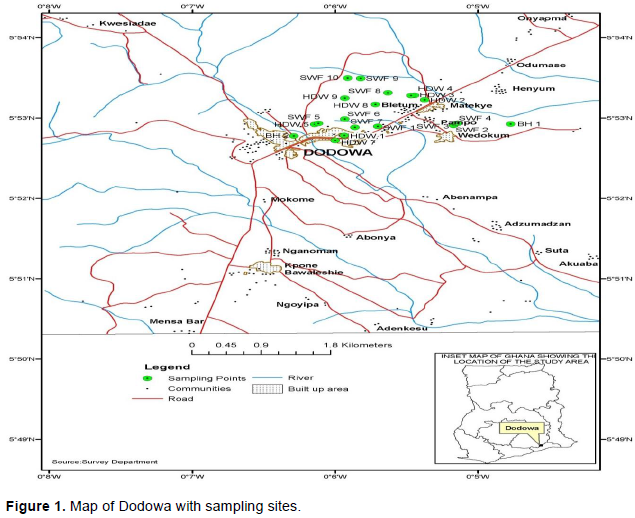
Dodowa is the district capital of the Dangme West district. The district lies between latitudes 5°45’ and 6°05’ north and longitude 0°05’E and 0°20’W. It has a population of 122,836 comprising 58,806 males and 64,030 females (Ghana Statistical Service, 2014). In all, the district occupies a total land area of about 968.361 km2 (Figure 1). The district has Dodowa as its capital. Based on Legislative Instrument, LI 2137, Dangme West district was split into two to have Ningo Prampram and Shai-Osudoku districts in June, 2012 (2010 Population and Housing census, District Analytical Report, 2014). It shares boundaries with the North Tongu district to the North-East, Yilo and Lower Manya districts to the North-West, Akwapim North district to the West, Kpone Kantamanso district to the South-West, Ningo Prampram district to the South and the Ada West district to the East (2010 Population and Housing Census, District Analytical Report, 2014). The Volta River washes the North-Eastern portions of the district (Ghana Statistical Service, 2014).
The Southeastern coastal plain of Ghana, which encompasses the Dangme West district, is one of the hottest and driest parts of the country. Temperatures are however subjected to occasional and minimal moderating influences along the coast and altitudinal influences affected by the Akwapim range in the northwest. Temperatures are appreciably high for most parts of the year with the highest during the main dry season (November - March) and lowest during the short dry season (July - August). They average a few degrees lower on the coast and close to the Akwapim range than they do over most of the plains. The absolute maximum temperature is 40°C. Mean annual rainfall increases from 762.5 ml on the coast to 1220 ml to the North and Northeast close to the foothills of Akwapim Range and on the summit (District Medium Term Development Plan 2010-2013, 2014).
The accessibility to potable water in Dodowa community is generally inadequate. The bigger and sub-urban communities like Dodowa, Prampram, Ningo, Afienya, Asutsuare, Osuwem, Ayikuma, etc., that are connected to GWCL lines from Kpong and Osudoku Water Project, in which flow of water is highly unreliable. In fact, Dodowa currently receives water from the GWCL only once in a week. To address this problem, the assembly has started the drilling of boreholes in suburbs of Dodowa so as to increase access to water supply (District Water and Sanitation Plan 2011-2014, 2014).
Water sampling
A total of 100 water samples were taken. Groundwater samples were collected between the periods of four months (November 2012 - February 2013). Eight hand-dug well (HDW) and two borehole (BH) water samples were collected for each month for the sampling sites. Ten stored water (SWF) samples (poly tanks and concrete tanks) were also taken during the four months. Twenty mobile tanker (MTS) services were also sampled.
One-litre plastic bottle was filled with water at each site. This was subsequently used in the laboratory for off-site analysis. Samples for bacteriological analysis were collected into 500 ml sterilized bottle and the cap covered with aluminium foil to avoid contamination during sampling. The samples were kept on ice and transported to the CSIR-WRI laboratory for the physico-chemical analysis. The bacteriological analyses were carried out immediately on arrival at the CSIR-WRI laboratory.
Physico-chemical and bacteriological analysis
The physico-chemical parameters were determined according to procedures outlined in the Standard Methods for the Examination of Water and Wastewater (APHA, 2012). Turbidity was measured with a HACH 2100 P Turbidimeter, colour by visual comparison method comparator, and pH by Suntex Model SP 701 pH Meter. Conductivity was measured with Cybersan PC 510 conductivity meter, total dissolved solids and suspended solids were measured gravimetrically after drying in an oven to a constant weight at 105°C. Sodium and potassium were measured by flame emission photometry, calcium and magnesium by the EDTA titration, sulphate by the turbidimetric method, and chloride by Argentometric method. Other analyses included alkalinity by strong acid titration. Nitrate was determined using hydrazine reduction method, Nitrite by diazotization method and Phosphate by stannous chloride method. Ammonium was determined by direct nesslerisation and spectrophotometric determination at 410 nm. Nitrate was determined at 520 nm, nitrite at 540 nm and phosphate determined at 690 nm. Fluoride was determined by SPADNS method, total iron and manganese by Atomic Absorption Spectrophotometry (AAS). Bacteriological analyses involved the determination of total and faecal coliforms by membrane filtration.
Statistical data analysis
Statistical analysis was done using SPSS version 19.0 for windows and Microsoft Office Excel 2013. ANOVA t-test was done.
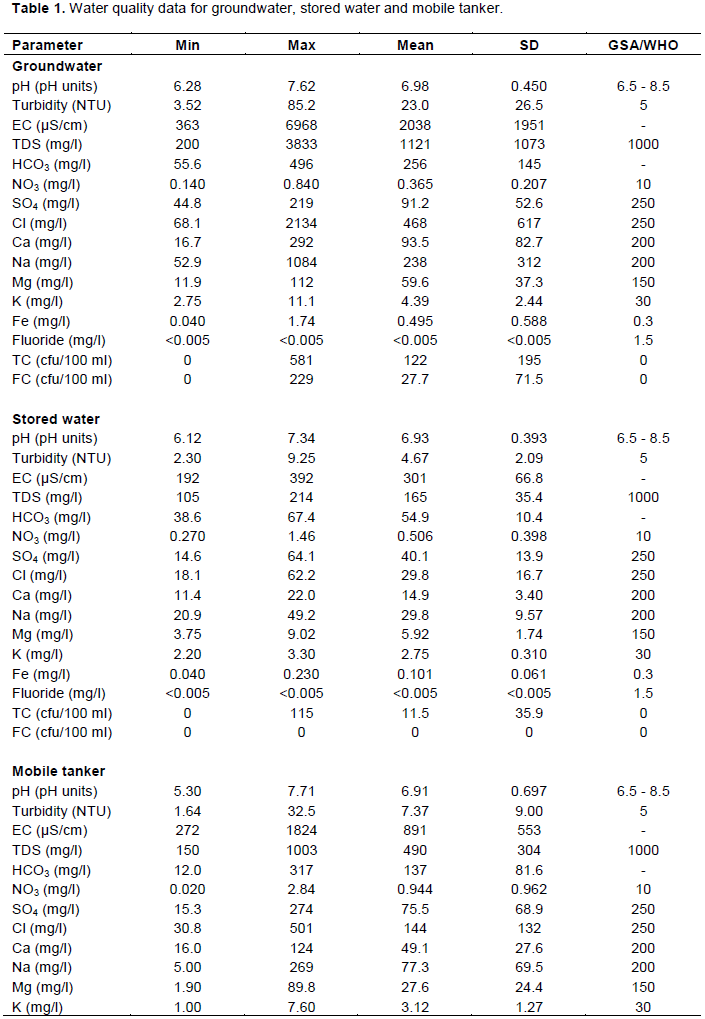
Table 1 shows the water quality parameters for the groundwater, stored water and tanker water.
There was no significant difference between the groundwater, stored water and tanker water for pH (p>0.05). The pH of the ground water sources were between 6.11 and 7.75 with a mean of 6.98 and standard deviation of 0.494. The pH for the stored water and the mobile tanker was also within the WHO Guideline values with means of 6.93 and standard deviation of 0.507, and 6.91 and standard deviation of 0.697, respectively. All the three water sources were within GSA and WHO guideline value of 6.5 to 8.5. Acidity (pH) and alkalinity are the base- and acid-neutralizing capacities of water. Waters of low alkalinity (<24 mgl-1 as CaCO3) are considered to have a low buffering capacity and can, therefore, be susceptible to alterations in pH (Chapman, 1996). The alkalinity of some waters is due only to the bicarbonates of calcium and magnesium. The pH of such water does not exceed 8.3 and its total alkalinity is practically identical with its bicarbonate alkalinity (Ballance and Bartram, 2002). pH is important in water quality assessment as it influences many biological and chemical processes within a water body (Chapman, 1996). In unpolluted waters, pH is principally controlled by the balance between the carbon dioxide, carbonate and bicarbonate ions as well as other natural compounds such as humic and fulvic acids (Chapman, 1996).

The turbidity for the groundwater ranges from 3.52 to 85.0 NTU with a mean of 23.0 NTU and standard deviation of 26.5 NTU, that of the stored water was from 2.30 to 9.25 NTU with a mean of 4.67 and standard deviation of 2.09 NTU. The tanker water had turbidity values with a mean of 7.37 NTU and standard deviation of 9.00 NTU. Their means exceeded the Ghana Standard Authority guideline and WHO guideline of 5 NTU. This could be attributed to heavy metals and biocides and can also harbour microorganisms or have the possibility of microbiological contamination (DWAF, 1989). The high levels also in the stored and tanker water could be due to the containers/tanks not being washed for a long time. With the three water sources, the tanker water was better with respect to turbidity followed by the stored water and the groundwater. Visible turbidity reduces the aesthetic acceptability of drinking-water. Turbidity can vary in colour and appearance, ranging from milky-white clay-based particles to muddiness from sediments and soils, red-brown iron-based particles and black manganese based particles. At high levels, turbidity can lead to staining of materials, fittings and clothes exposed during washing (WHO, 2017).
The electrical conductivity for the groundwater varied from 363 to 6968 µS/cm with a mean of 2038 µS/cm and standard deviation of 1950 µS/cm. The electrical conductivity for the stored water ranged from 192 to 393 µS/cm with mean of 301 µS/cm and standard deviation of 66.8 µS/cm. And that of the tanker water ranged from 272 to 1824 µS/cm with mean of 891 µS/cm and standard deviation of 553 µS/cm. There was however a significant difference between the water sources for electrical conductivity (p<0.05). Conductivity is a measure of the level of mineralization (Water Resources Commission, 2003) or the ability of water to conduct an electric current (Chapman, 1996). It is sensitive to variations in dissolved solids, mostly mineral salts. The degree to which the mineral salts dissociate into ions, the amount of electrical charge on each ion, ion mobility and the temperature of the solution all have an influence on conductivity (Chapman, 1996). And therefore, the groundwater will be more mineralized or will have high levels of cations and anions compared to the stored and tanker water.
The total dissolved solids (TDS) for groundwater values ranged from 200 to 3833 mg/l with a mean of 1121 mg/l and standard deviation of 1073 mg/l. The TDS levels for the stored water ranged from 105 to 214 mg/l with mean of 165 mg/l and standard deviation of 35.4 mg/l. And that of mobile tanker was from 150 to 1003 mg/l with mean of 490 mg/l and standard deviation of 304 mg/l. TDS comprise inorganic salts and small amounts of organic matter that are dissolved in water. The principal constituents are usually the cations; calcium, magnesium, sodium and potassium and the anions; carbonate, bicarbonate, chloride, sulphate; and particularly in groundwater, nitrate (www.hc-sc.gc.ca). The groundwater had TDS higher than the tanker and stored water; this could be due to the high level of mineralization of the groundwater.
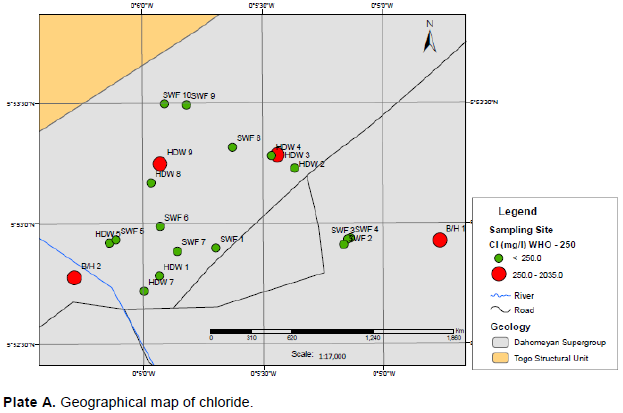
There was a significant difference between the groundwater, stored water and tanker water for chloride (p<0.05). The chloride values for groundwater varied from 68.1 to 2134 mg/l with a mean of 468 mg/l and standard deviation of 617 mg/l. Plate A shows the geographical map of the groundwater over the sampling sites, those in red exceeded the GSA and WHO guideline values. Chloride in surface and groundwater from both natural and anthropogenic sources, such as run-off containing road de-icing salts, the use of inorganic fertilizers, landfill leachates, septic tank effluents, animal feeds, industrial effluents, irrigation drainage, and seawater intrusion in coastal areas (Department of National Health and Welfare, Canada, 1978). High levels of chloride in groundwater could be as a result of weathering of the rocks underlying the area.

That of the stored water ranged from 18.1 to 62.2 mg/l with mean of 29.8 mg/l and standard deviation of 16.7 mg/l. And that of the mobile tanker chloride levels ranged from 30.8 to 501 mg/l with a mean value of 144 mg/l and standard deviation of 132 mg/l which were within the GSA and WHO guideline value of 250 mg/l. The stored water had good quality than the mobile tanker and groundwater.
Bicarbonate values for groundwater ranged from 55.0 to 496 mg/l with a mean of 256 mg/l and standard deviation of 145 mg/l. The bicarbonate values for stored water ranged from 38.6 to 67.4 mg/l with mean of 54.9 mg/l and standard deviation of 10.4 mg/l and the bicarbonate levels for the tanker water ranged from 12.0 to 317 mg/l with mean value of 137 mg/l and standard deviation of 81.6 mg/l. The presence of carbonates (CO32-) and bicarbonates (HCO3-) influences the hardness and alkalinity of water. The weathering of rocks contributes carbonate and bicarbonate salts. The relative amounts of carbonates, bicarbonates and carbonic acid in pure water are related to pH. As a result of the weathering process, combined with the pH range of surface waters (~6-8.2), bicarbonate is the dominant anion in most surface waters. Carbonate is uncommon in natural surface waters because they rarely exceed pH 9, whereas groundwater can be more alkaline (Chapman, 1996). There is however, no maximum value for carbonates and bicarbonates.
The nitrate values for groundwater ranged from 0.140 to 0.840 mg/l with a mean of 0.365 mg/l and standard deviation of 0.207 mg/l. Nitrate levels for stored water ranged from 0.270 to 1.46 mg/l with mean of 0.506 mg/l and standard deviation of 0.398 mg/l and that of tanker water ranged from 0.020 to 2.84 mg/l with mean of 0.944 mg/l and standard deviation of 0.962 mg/l. The nitrate values were all within the GSA and WHO guideline values of 10 mg/l.
Sulphate levels for groundwater ranged from 44.8 to 219 mg/l with a mean of 91.2 mg/l and standard deviation of 52.6 mg/l. And that of the stored water ranged from 14.6 to 64.1 mg/l with mean of 40.1 mg/l and standard deviation of 13.9 mg/l. The sulphate levels for the tanker water ranged from 15.3 to 274 mg/l with a mean value of 75.5 mg/l and standard deviation of 68.9 mg/l. Sulphate is naturally present in surface waters as SO42-.The values for sulphate for all the three water sources were within the GSA and WHO guideline values of 250 mg/l. The stored water was good in relation to sulphate than the tanker water and groundwater.
Sulphate arises from the atmospheric deposition of oceanic aerosols and the leaching of sulphur compounds, either sulphate minerals such as gypsum or sulphide minerals such as pyrite, from sedimentary rocks. It is the stable, oxidized form of sulphur and is readily soluble in water. High concentrations may make water unpleasant to drink (Chapman, 1996).
Calcium levels for groundwater ranged from 16.7 to 292 mg/l with a mean of 93.5 mg/l and standard deviation of 82.7 mg/l and that for the stored water between 11.4 and 22.0 mg/l with mean of 14.9 mg/l and standard deviation of 3.40 mg/l. That of the tanker water ranged from 16.0 to 124 mg/l with mean value of 49.1 mg/l and standard deviation of 27.6 mg/l. They were all within the GSA and WHO guideline value of 250 mg/l. The stored water was better than the tanker water and groundwater.
Magnesium levels for groundwater ranged from 11.9 to 118 mg/l with a mean of 59.6 mg/l and standard deviation of 37.3 mg/l. Magnesium levels for stored water ranged from 3.75 to 9.02 mg/l with mean of 5.92 mg/l and standard deviation of 1.74 mg/l. And that of tanker water ranged from 1.90 to 89.8 mg/l with mean of 27.6 mg/l and standard deviation of 24.4 mg/l. The magnesium also followed the same trend of the stored water being better than the tanker water and the groundwater.
The salts of calcium, together with those of magnesium, are responsible for the hardness of water (APHA, 2012; Chapman, 1996; www.hc-sc.gc.ca).
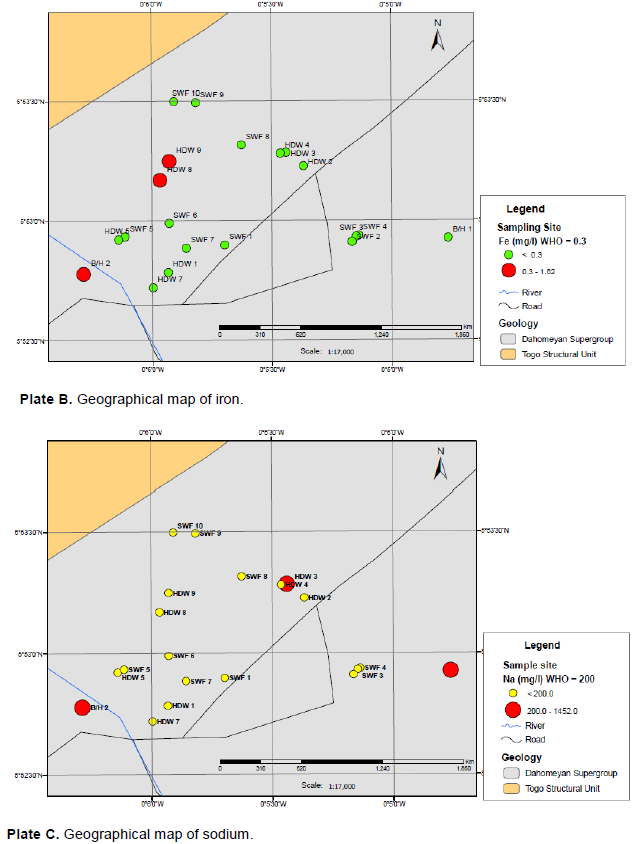
Sodium levels for groundwater ranged from 52.9 to 1084 mg/l with a mean of 238 mg/l and standard deviation of 311 mg/l. Plate C shows the geographical map of sodium over the groundwater sampling sites and the sites in red exceeded the GSA and WHO guideline value. The stored water ranged from 20.9 to 49.2 mg/l with mean of 29.8 mg/l and standard deviation of 9.57 mg/l. Sodium levels for the tanker water ranged from 5.00 to 269 mg/l with mean of 77.3 mg/l and standard deviation of 69.5 mg/l. Yet again, it follows the same trend, the stored water being good, followed by the tanker water and then the groundwater.
Potassium levels for groundwater ranged from 2.75 to 11.1 mg/l with a mean of 4.39 mg/l and standard deviation of 2.44 mg/l. Potassium levels ranged from 2.20 to 3.30 mg/l with mean of 2.75 and standard deviation of 0.310 mg/l. Potassium levels ranged from 1.00 to 7.60 mg/l with a mean value of 3.12 and standard deviation of 1.27 mg/l. All the three water sources had potassium below the GSA and WHO guideline value of 30 mg/l and therefore were all of good quality in terms of potassium. The stored water was better than the tanker water and the groundwater.
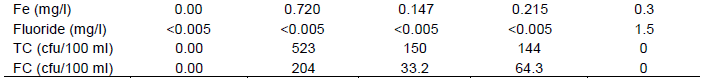
Plate B shows the geographical map of iron of groundwater over the sampling sites; those in red exceeded the GSA and WHO guideline values. Iron values for groundwater ranged from 0.040 to 1.74 mg/l with a mean of 0.495 mg/l and standard deviation of 0.588 mg/l. And that of the stored water ranged from 0.040 to 0.230 mg/l with mean of 0.101 mg/l and standard deviation of 0.061 mg/l. That of the tanker water ranged from 0 to 0.720 mg/l with mean of 0.147 mg/l and standard deviation of 0.215 mg/l. The high levels of iron in groundwater and tanker water exceeded the GSA and WHO guideline values of 0.3 mg/l. This may be due to the weathering of rocks and minerals. This causes groundwater that looks clear when first brought from a well to become cloudy, and then appear orange in colour, as oxidation immediately occurs with the precipitation of ferric hydroxide, iron (II) is converted to iron (III) (Chapman, 1996).

The precipitation of excessive iron imparts an objectionable reddish-brown colour to water (WHO, 2004). These high levels of iron will impart a bitter taste to water making it have that metallic taste like that of blood, a brownish color to laundered clothing and plumbing fixtures, emergence of iron bacteria and discoloured beverages (www.usgs.gov/search) and (www.purdue.edu/envirosoft/groundwater/src/title.htm), and may also result in haemochromatosis, a condition in which normal regulatory mechanism do not operate effectively, leading to tissue damage as a result of the accumulation of iron (Watt and Merrill, 1963; Hopps, 1972; Jacobs, 1977 in www. hc-sc.gc.ca). The stored water was better in terms of quality than the tanker water and groundwater.
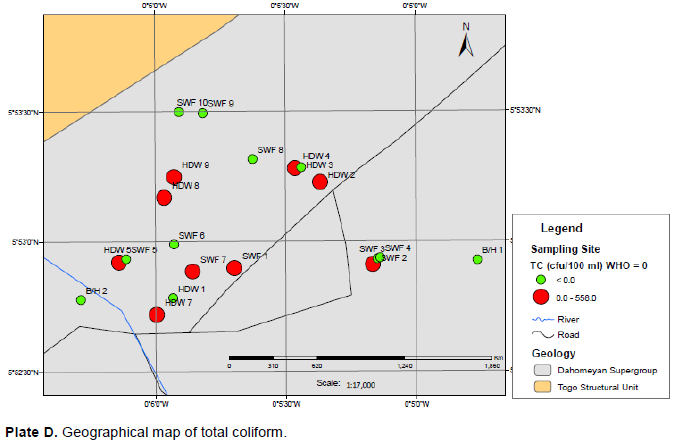
Total coliform (TC) bacteria counts for groundwater ranged from 0 to 581 cfu/100 ml with a mean of 122 cfu/100 ml and standard deviation of 195 cfu/100 ml and the faecal coliform (FC) bacteria counts ranged from 0 to 229 cfu/100 ml with a mean of 28 cfu/100 ml and standard deviation of 71 cfu/100 ml. Plate D shows the geographical map of total coliform over the sampling sites. The quality of water for the stored water was generally good except for the total coliform which exceeded the GSA and WHO guideline values of 0 which may be attributed to the tanks and containers used to store the water not cleaned properly and frequently.

TC counts for stored water ranged from 0 to 115 cfu/100 ml with mean of 11 cfu/100 ml and standard deviation of 40 cfu/100 ml. There are no FC in the stored water. TC and FC levels for the tanker water ranged from 0 to 523 cfu/100 ml with mean of 150 cfu/100 ml and standard deviation of 144 cfu/100 ml and 0 to 204 cfu/100 ml with mean of 33 cfu/100 ml and standard deviation of 64 cfu/100 ml, respectively.
The stored water had the best quality compared to the tanker water and groundwater. This was because the stored water is the irregular water supply from the GWCL which they have stored for use. It had a few concerns in terms of coliforms due to the way they are stored and irregularity with which the tanks are cleaned. The tanker water was from either pipe or boreholes/wells which they could not authenticate the source and the groundwater was from boreholes/wells which have not been treated, that accounts for the high levels of ions and iron.
Spatial distribution of parameters over sampling points
Plates A, B, C, and D show the spatial distribution of parameters over sampling points.
CONCLUSION AND RECOMMENDATION
The available water sources in the Dodowa township could not be considered potable especially with the groundwater which had high levels of turbidity, TDS, chloride, sodium and iron and therefore needs treatment before use. All the water sources had coliform bacteria which could cause cholera, typhoid, dysentery and diarrhea (Chapman, 1996). The high levels of coliform pose serious challenges to water resource management and could seriously affect public health and the socio-economic effect of ingesting coliform-infested water would be disastrous (Cobbina et al., 2009).
The stored water had the best quality compared to the tanker water and groundwater. On that basis the following are recommended for the management of the sources of drinking water in the Dodowa community:
(1) The Dangbe West district assembly should make sure residents do not sink wells near or closer to places of convenience so as not to cause contamination of wells with faecal matter as they may be leached into the wells.
(2) There is the need to increase the effectiveness of existing legislation by making use of a community participatory model. Since the chiefs are close to the people and have significant control over the actions of individuals within their jurisdiction, collaborative enforcement of environmental regulations should be promoted between the district assembly and the local authorities.
(3) There should be environmental education by the Dangbe West district assembly and must be structured in such a way that it cuts across all spheres of society thus catering for the educated and the non-educated.
(4) Residents should be encouraged to go for rain harvesting as another source of water for potable and domestic use.
(5) Residents should be educated on how to clean and chlorinate their stored water tanks as it is their major source of drinking water.
The authors have not declared any conflict of interests.
REFERENCES
|
American Public Health Association (APHA) (2012). Standards methods for the examination of water and wastewater, 22nd edition, Washington DC, USA.
|
|
|
|
Bartram J, Balance R (2002). Water quality monitoring - A practical guide to the design and implementation of freshwater quality studies and monitoring programmes. T. J. International Ltd, Cornwall, Great Britain. P 383.
|
|
|
|
|
Cairncross S, valdmanis V (2006). Water Supply, Sanitation, and hygiene Promotion. In: Jamison DT, Breman JG, Measham AR, et al., editors. Disease Control Priorities in Developing Countries. 2nd edition. Washington (DC): World Bank
|
|
|
|
|
2006. Chapter 41. Chapman D (1996). Water Quality Assessment - A Guide to Use of Biota, Sediments and Water in Environmental Monitoring, 2nd edition, UNESCO, WHO and UNEP., E&Fnspon, Chapman & Hall.
|
|
|
|
|
Cobbina SJ, Anyidaho LY, Nyame F, Hodgson IOA (2009). Water quality status of dugouts from five districts in Northern Ghana: implications for sustainable water resources management in a water stressed tropical savannah environment. Environmental Monitoring and Assessment 167(1-4):405-416.
Crossref
|
|
|
|
|
Department of National Health and Welfare (Canada) (1978). Guidelines for Canadian drinking water quality. Supporting Documentation. Ottawa.
|
|
|
|
|
Department of Water Affairs of Forestry (DWAF) (1989). Quality of Domestic Water Supplies: Assessment Guide. 2nd Edition, Department of Health and Water Research Commission, Pretoria, South Africa.
|
|
|
|
|
Dangbe West Municipal Assembly, District Medium Term Development Plan (2010-2013) (2014). Dodowa. Brochure. Dangbe West Municipal Assembly, District Water and Sanitation Plan (2011-2014) (2014). Dodowa. Brochure.
|
|
|
|
|
Ghana Statistical Service (GSS) (2014). 2010 Population and housing census, housing in Ghana.
View
|
|
|
|
|
Osumanu I (2010). Community involvement in urban water and sanitation provision: The missing link in partnerships for improved service delivery in Ghana. Journal of African Studies and Development 2:208-215.
|
|
|
|
|
Schäfer A, Rossiter HM, Owusu PA, Awuah EM (2010). Chemical drinking water quality in Ghana: Water costs and scope for advanced treatment. Science of the Total Environment 408:2378-2386.
Crossref
|
|
|
|
|
World Health Organization (WHO) (2017). Water Quality and Health-Review of turbidity: Information for regulators and water suppliers. Technical Brief.
|
|
|
|
|
WHO and UNICEF (2000). The Global Water Supply and Sanitation Assessment 2000 Report. Geneva: WHO.
|
|
|
|
|
World Health Organization (WHO) (2004). Guidelines for drinking water quality, 3rd edition, Geneva.
|
|