ABSTRACT
Climate change will cause Sub-Saharan tropical countries to experience a disproportionate increase in the number of extremely hot days when compared to Western countries with more temperate climates. We use the High Occupational Temperature Health and Productivity Suppression (HOTHAPS) model to estimate the potential impact of rising temperatures on worker productivity in different climate regions within Ethiopia, Uganda, Rwanda, and Kenya under varying future climate change scenarios. Using population data obtained from the International Labor Organization, we also estimate productivity losses at a country-wide level. We project large inter-country and intra-country disparities in productivity losses due to varying climatic conditions and local geography. Populations living in lower elevations or in more tropical and arid zones will experience higher productivity losses than those at higher elevations with more temperate climates. We estimate that some areas could lose over 12% productivity by 2099. Comparing climate change impacts across cities, Mombasa, Kenya, is projected to suffer most, losing 13% of its labor productivity. Cities above 1500 m in elevation showed almost no productivity loss by the end of the century. Increased heat stress projected from climate change will pose added risk to workers and labor production in lower elevation settings across East Africa.
Key words: Climate change, occupational health, Sub-Saharan Africa, health impacts, heat stress, WBGT.
The consequences of global climate change have continued to become more apparent since the early 20th century, in the backdrop of rapid industrialization, expanding economies, and continued population growth (Patz et al., 2005). Sub-Saharan tropical countries will experience a disproportionate increase in the number of extremely hot days, when compared to Western countries with more temperate climates (Engelbrecht et al., 2015; Spector and Sheffield, 2014; Asefi-Najafabady et al., 2018). The rise in ambient temperatures will negatively impact large groups of the working population (Kjellstrom et al., 2016; Kovats and Hajat, 2008).
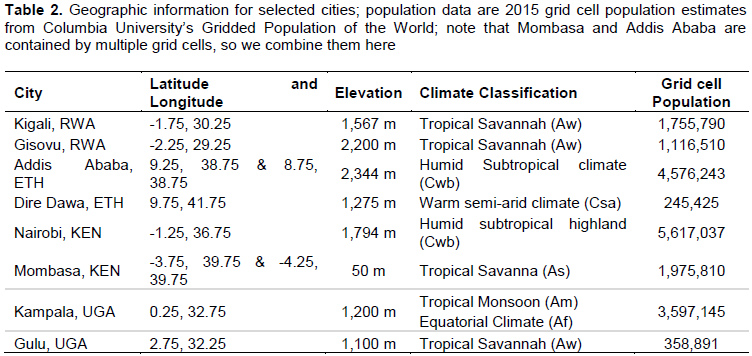
In this study of the East African region, we analyze the effects of Global Temperature Change (GTC) on workers in the countries of Rwanda, Ethiopia, Kenya, and Uganda. While global temperature averages are rising, climate change impacts for a given locale are highly dependent on its geography and climate classification. To better understand regional variation of potential productivity losses due to climate change, we also study select cities with varying geographic and climate conditions (Table 2).
Workers in these countries who carry out various forms of manual labor outdoors (in sun or shade) or work indoors without air conditioning are the most vulnerable and may be forced to considerably reduce their work time because of the heat (Kjellstrom et al., 2016; Nilsson and Kjellstrom, 2010). Loss in hourly productivity with increasing ambient temperature occurs as humans initially try to adapt by physiological (sweating) and behavioral (self-pacing) mechanisms in an effort to maintain thermoregulation; should these mechanisms fail, a spectrum of heat-related illnesses can occur if interventions are not taken to reduce the core body temperature (Cheung et al., 2016).
Reduced work capacity and labor productivity losses begin to occur when Wet Bulb Global Temperature (WBGT) exceeds 26°C, rising steadily until about 40°C when labor becomes almost impossible to sustain (Kjellstrom et al., 2009; Sahu et al., 2013). The High Occupational Temperature Health and Productivity Suppression (HOTHAPS) programme models the relationship between WBGT and work productivity. We ran HOTHAPS on regional climate data collected from Potsdam Institute’s Intersectoral Impact Model Intercomparison Project (ISI-MIP) to model how worker productivity in Eastern Africa may be affected by climate change.
While understanding how WBGT varies with geography is vital to understanding regional work loss, geographic variables are not explicit parameters in the model but are implicitly present in the WBGT. Elevation strongly affects temperatures (and thus WBGT), with mean decreases in temperature of 6.5°C for every 1000 m ascended (Lapse Rate, 2016; Fairbridge and Oliver, 1987). We therefore compared across countries within East Africa with markedly different elevations to assess risks from climate change on worker heat stress and potential losses in labor productivity.
The model we use, HOTHAPS, derives estimates for the heat load on workers under different climatic conditions. The model uses Wet Bulb Globe Temperature (WBGT) to directly estimate climate effects on the loss of work productivity at different ambient temperature levels for workers at different levels of labor intensity, Kjellstrom et al. (2018) discuss more on the treatment of the methodology. The WBGT is derived from daily recorded climate data, combining air temperature, humidity, wind speed, and solar radiation. Direct sun exposure increases WBGT so all work is assumed to be done in the shade or indoors without air conditioning for this study. Thus, WBGT has been employed as a more comprehensive and conservative indicator of the risk of heat exposures in workplace settings (Parsons, 2014).
Model and parameters
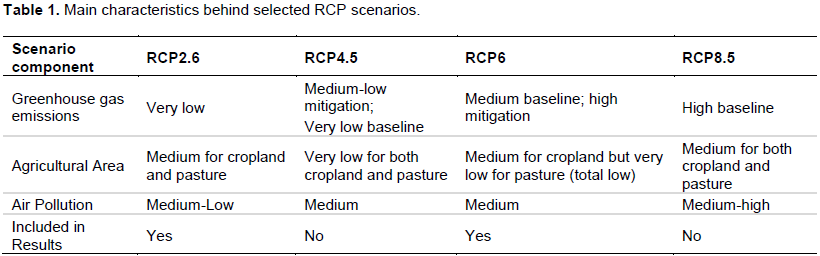
We used data sets of WBGT from the Potsdam Institute’s Intersectoral Impact Model Intercomparison Project (ISI-MIP), from the four main Representative Concentration Pathway (RCP) scenarios of the Intergovernmental Panel on Climate Change (IPCC): RCP2.6, RCP4.5, RCP6.0, and RCP8.5. These scenarios describe a range of radiative forcing levels by the year 2100 given certain socio-economic, technological, and climate policy assumptions (Table 1).
The highest of these values (RCP8.5) corresponds to a “business as usual” where emissions levels continue to rise without preventive actions allowing radiative forcing to reach 8.5 W/m2 by the end of the century. Whereas the 2.6 W/m2 scenario represents a “best case” scenario where Global Temperature Change (GTC) stops at +1.6°C. RCP6.0 represents an intermediate scenario with stabilization of emissions and a projected increase in the GTC of about 2.7°C by the end of the century with radiative forcing reach as high as 6.0 W/m2 (van Vuuren et al., 2011). For this study, we analyze both the RCP6.0 and RCP2.6 scenarios. These RCP values act as parameters for all the models included in the ISI-MIP climate models: HadGEM2, NORES, GFDL, IPSL, and MIROC. We use HadGEM2 and GFDL based on previous findings that showed HadGEM2 to produce results close to the upper limit of models and GFDL to produce results close to the lower limit of IPCC projections (Collins et al., 2013). Additionally, the mid-point estimates of these two models were close to averages of all IPCC models (Collins et al., 2013; Kjellstrom et al., 2018).

These models use climate data that were obtained from Health and Environment International Trust (HEIT) through their website www.climatechip.org, an online database that comprises historical climate data and future estimates for different climate scenarios. ClimateCHIP provides monthly averages of the daily recorded Maximum and Mean WBGT for all locations across the world. We derive another WBGT variable to represent the midpoint between the Maximum and Mean WBGT values: Mid WBGT.
These variables allow us to use the “4 + 4 + 4” method to approximate a worker’s total hours of WBGT exposure for a month. This method assumes 12 h of daylight each day, each variable is normally distributed, and each variable corresponds to a set of time slices (totaling four hours of the day). The Maximum variable corresponds to the hottest time of day (10 am – 2 pm). The Mean variable is the midpoint between the daily Maximum WBGT score and the daily minimum score (coldest at night). For this reason, we divide the Mean variable times slice into the two-hour timeslots at
the beginning and end of each day (6 am – 8 am, 4 pm – 6 pm). The Mid variable then accounts for the time slots 8 am – 10 am and 2 pm – 4pm. We assume a normal distribution for each of these variables with a standard deviation of 2°C. The area under the curve for each variable represents total amount of time spent near that WBGT score. We partition each distribution into 1°C bins (25-25.99°C) and then use the area under the curve to approximate the amount of time each day is spent at that temperature. We then sum the number of hours in each bin across all distributions which approximates the total hours of exposure.
In addition to WBGT, the intensity of physical exertion during exposure period-generating internal body heat-contributes to the risk of heat stress. We consider three intensity classes: 200, 300, and 400 Watts (W) of metabolic rate. Each one of these levels correspond to increasing levels of exertion from light clerical work at 200 W to construction labor or agricultural work at 400 W. We use the sums of hours and the intensity of the labor activity to calculate productivity the work loss at each intensity using exposure response curves of the general form (cumulative Gaussian distribution):
Productivity loss (y) = 0.5[1 +erf(x-µ/σ √2)]
where µ and σ are the mean and standard deviation of the associated normal curve. The output is a percent of work lost for the duration of exposure. We aggregate that percent loss for each hour spent in that bin and summarize our results by aggregating decadal averages of productivity loss through the end of the century (2099).
Selected population and employment data
When calculating productivity losses for a country, we use gridded population projections to weight how much productivity loss can be attributed to a given grid cell. Just as in the International Labour Organization report, "Working on a warming planet" (ILO, 2019), we combined population data from Columbia University’s Gridded Population of the World and employment-to-population ratios ILOSTAT database to generate estimates for employment numbers for specific economic sectors in each country: agriculture, construction, industry and services. Based on the country-specific proportion of these economic sectors, and assumed metabolic rates for each industry, we estimate productivity losses in each country up until 2099 (Kjellstrom et al., 2018). Our estimates show the effects on individual workers depending on work intensity in Watts.
Selection of cities
For each country we selected two cities to investigate. We picked the capital of each country and a city with distinct geographical characteristics (climate classification or elevation) to explore intra-country work loss variation (Table 2).
For all our results, we use the midpoint between GFDL and HadGEM2 projections. Under both emission scenarios, RCP2.6 and RCP6.0, work losses varied by region. There were greater work losses in RCP6.0 than in RCP2.6 scenario for each country. In general, cities at higher elevations experienced fewer work losses.
Selected countries
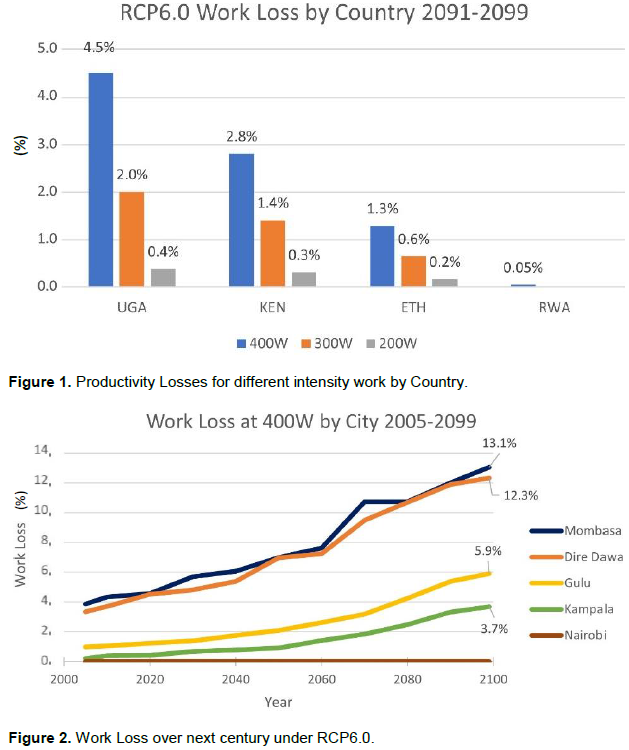
All our projections for productivity losses of low-intensity work (200W) were less than 1% for every country throughout the end of the century. Our projections for moderate work intensity (300W) showed no losses in Rwanda and less than 1% loss in Ethiopia but Kenya and Uganda may experience up to 1.4 and 2% work loss, respectively, by year 2095. Figure 1 show productivity losses for different intensity work by Country for (2091-2099) for RCP6.0 using midpoint between GFDL and HadGEM2 using population data from Columbia University’s Gridded Population of the World and employment-to-population ratios ILOSTAT database
According to the Central Intelligence Agency World Fact Book, Rwanda and Ethiopia have the 11th and the 16th highest mean elevation out of all the countries in the world, respectively. These high mean elevations may mean fewer days of extreme heat and thus fewer losses in productivity. Even for high-intensity work, we project Rwanda will lose <1% of work productivity through the year 2095. While large swathes of Ethiopia are semi-arid or desert climate zones, much of the country is at high elevation, and we find only ~1.3% productivity loss by the end of the century for high-intensity work (Figure 1). Kenya and Uganda will experience greater losses under the same scenarios. According to our model, Uganda will experience the greatest total work loss out of the countries studied losing as much as 4.5% productivity by 2099 at 400W intensity (metabolic rate) whereas Kenya will lose 2.8% productivity.
Selected cities
Using the midpoint between HadGEM2 and GFDL as well, we provide some highlights of the city-level data. Work loss levels varied from city to city, even between cities in the same country. For example, even at 400W intensity, Nairobi, Kenya may not experience any loss in productivity by the end of the century, whereas Mombasa, Kenya is projected to lose 13% productivity. Like Nairobi, the cities Gisovu, Kigali, and Addis Ababa are located above 1500 meters in elevation and showed almost no productivity loss by the end of the century under our model. All other locations showed rising trends in productivity losses from the 2005 to 2099 (Figure 2). Since both Addis Ababa and Mombasa span two grid cells, results for these cities are presented as the midpoint between the grid cells for convenience. Work loss over next century under RCP6.0 for high intensity work; Nairobi, Kigali, Gisovu, and Addis Ababa had 0% work loss over the period, the latter three of which were excluded from Figure 2.
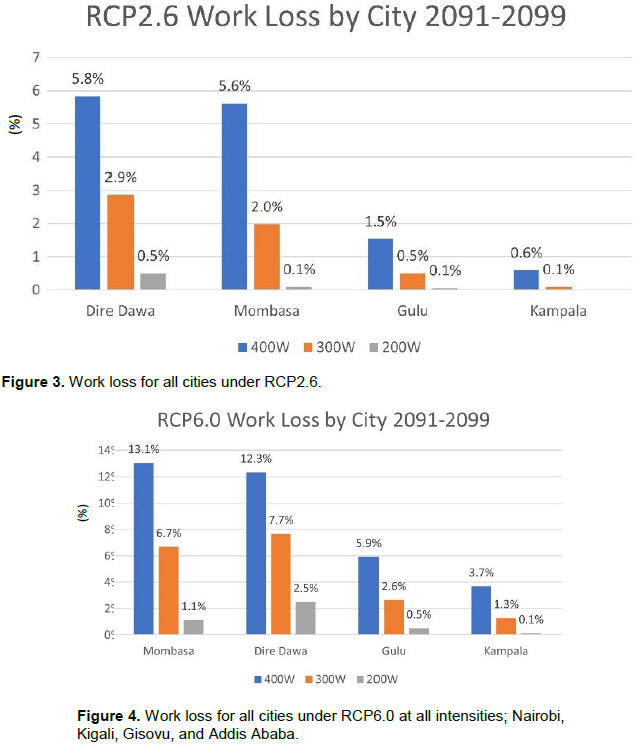
We project fewer work losses under the RCP2.6 scenario (Figure 3) for each city than in the RCP6.0 scenario (Figure 4). Even so, both Mombasa and Dire Dawa still may lose more than 5% of work productivity by the end of the century under RCP2.6 scenario. We project that Mombasa will experience the greatest productivity losses out of the selected cities; its elevation is just 50 meters above sea level. For high intensity labor, we see as much as 13% work loss by the end of the century. In Dire Dawa, we project 12.3% productivity loss by the end of the century. For the same period, Gulu can expect as much as ~6% and Kampala, ~3.7%. Work loss for all cities under RCP2.6 at all intensities; Nairobi, Kigali, Gisovu, and Addis Ababa had 0% work loss over the period, the latter three of which were excluded from Figure 3. Work loss for all cities under RCP6.0 at all intensities; Nairobi, Kigali, Gisovu, and Addis Ababa had 0% work loss over the period, the latter three of which were excluded from Figure 4.
Our findings for worker productivity in East Africa are consistent with prior climate change studies in other global regions. Our results further show work loss variance across areas with markedly diverse geography, particularly varying by elevation and climate zone classification. In every country except Rwanda, we see large intra-country variation in projected work loss (Figure 5). The frequency and intensity of these extreme heat stress days are projected to increase with climate change. While this may result in a reduction in worker productivity, it also may lead to higher rates of morbidity and mortality with the rate of increase varying by region (Hoegh-Guldberg et al., 2018). Even with highly variable local effects, rising global mean surface temperatures (GST) has been noted to be the most predictable impact of anthropogenic emission-induced climate change (Collins et al., 2013). Areas at high elevation like Addis Ababa and Kigali enjoy temperate climates with relatively low mean monthly temperatures even during the hotter parts of the year. Subsequently, losses in work productivity in these high elevation areas, even for the heavy intensity work groups under a more extreme emission scenario (RCP6.0), showed a minimal decrease in productivity (Figures 6 and 7).
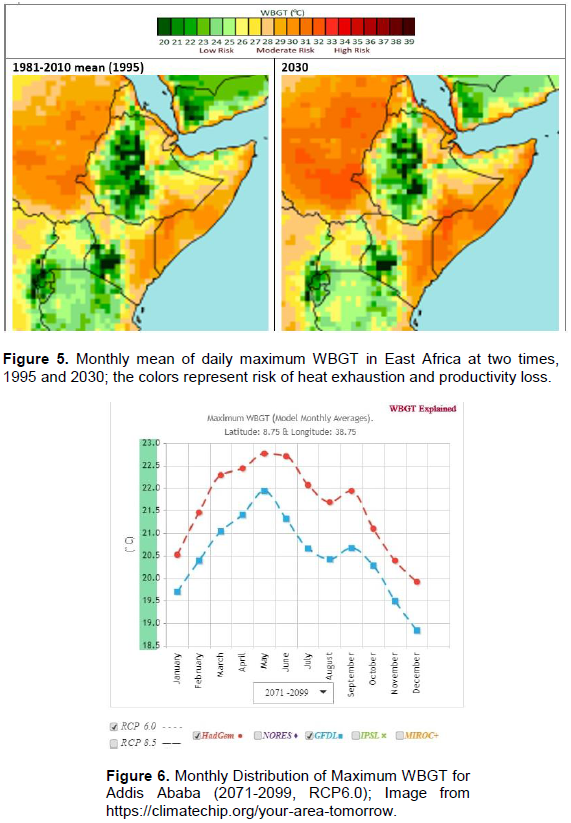
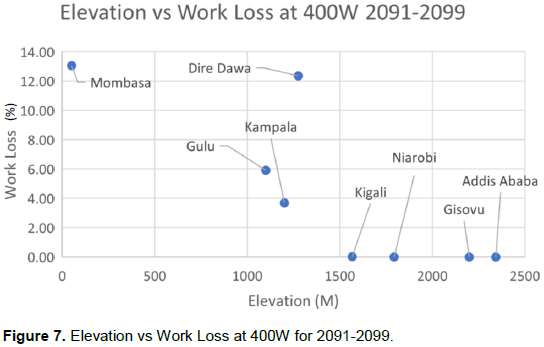
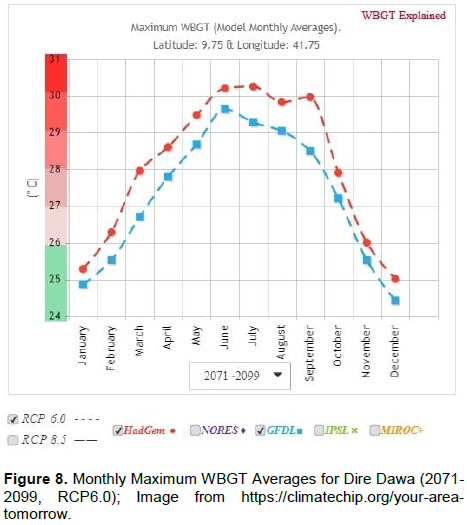
Of the four countries studied, three of their capitals (which are their largest cities by population) are elevated 1,500 m above sea level (Figure 7). These cities experienced almost no work loss under any scenario. Figure 7 suggests a relationship between work loss and elevation but further research with more locations and data is needed to better understand a possible relationship. Any further research examining the relationship between elevation and work loss in this region should consider climate classification as another variable of interest. For example, Dire Dawa has a higher elevation than Kampala but we project almost 3 times more work loss in Dire Dawa. Its relatively high mean monthly temperatures (Figure 8) and its comparatively high work loss for its elevation may be explained its warm semi-arid (Csa) climate classification.
One limitation of our country-wide work loss projections is the reliance on population data in each grid cell to weight each grid cell’s contribution to overall productivity loss. As certain effects of climate change intensify, migratory patterns may shift in unexpected ways. Extreme weather events (drought, storms, floods, and etc.) will occur with greater frequency with GTC (Cattaneo et al., 2019). Assessment of adaptive strategies, such as scheduled time away from work during peak temperature months, switching work to night-shifts, or other typical extreme heat interventions would involve a full suite of adaptation scenarios (and associated uncertainties) that are beyond the scope of this manuscript addressing altered risk levels from climate change in the region.
Climate change is expected to increase WBGT in Eastern Sub-Saharan Africa which will, in turn, decrease labor productivity in parts of the region. Some large cities like Mombasa may experience significant labor productivity losses under RCP6.0 scenario. The impact of climate change on workers in these countries varies significantly across different climate zones and elevations. Further research is needed to establish a quantitative relationship between climate classification, elevation, and productivity loss. Although populations in areas of high elevation appear to be relatively spared from productivity loss, a significant proportion of the population in other regions will be directly affected by climate change. To mitigate productivity losses induced by spikes in WBGT, we must keep average global temperatures from surpassing +1.6°C. This will require significant and immediate reductions in global greenhouse gas emissions.
The authors have not declared any conflict of interests.
Funding support for this research came from NIH Fogarty, grant #0123456789, "Global Environmental and Occupational Health (GEOHealth) Hub for East Africa."
REFERENCES
|
Asefi-Najafabady S, Vandecar KL, Seimon A, Lawrence P, Lawrence D (2018). Climate change, population, and poverty: vulnerability and exposure to heat stress in countries bordering the Great Lakes of Africa. Climatic Change 148(4):561-573.
Crossref
|
|
|
|
Cheung SS, Lee JKW, Oksa J (2016). Thermal stress, human performance, and physical employment standards. Applied Physiology, Nutrition, and Metabolism 41(6):148-164.
Crossref
|
|
|
|
|
Collins M, Knutti R, Arblaster J, Dufresne JL, Fichefet T, Friedlingstein P, Gao X, Gutowski WJ, Johns T, Krinner G, Shongwe M (2013). Long-term Climate Change: Projections, Commitments and Irreversibility. In: Climate Change 2013: The Physical Science Basis. Working Group I to the Fifth Assessment Report of the Intergovernmental Panel on Climate Change. Cambridge University Press pp. 1029-1136.
|
|
|
|
|
Cattaneo C, Beine M, Fröhlich CJ, Kniveton D, Martinez-Zarzoso I, Mastrorillo M, Millock K, Piguet E, Schraven B (2019). Human Migration in the Era of Climate Change. Review of Environmental Economics and Policy 13(2):189-206.
Crossref
|
|
|
|
|
Engelbrecht F, Adegoke J, Bopape MJ, Naidoo M, Garland R, Thatcher M, Gatebe C (2015). Projections of rapidly rising surface temperatures over Africa under low mitigation. Environmental Research Letters 10(8):085004.
Crossref
|
|
|
|
|
Fairbridge RW, Oliver JE (1987). Lapse rate. In: Climatology. Encyclopedia of Earth Science. Springer, Boston, MA.
|
|
|
|
|
Hoegh-Guldberg O, Jacob DM, Taylor M, Bindi S, Brown I, Camilloni A, Diedhiou R, Djalante KL, Ebi F, Engelbrecht J, Guiot Y, Hijioka S, Mehrotra A, Payne SI, Seneviratne A, Thomas R, Warren G, Zhou (2018). Impacts of 1.5ºC Global Warming on Natural and Human Systems. In: Global Warming of 1.5°C. An IPCC Special Report on the impacts of global warming of 1.5°C above pre-industrial levels and related global greenhouse gas emission pathways, in the context of strengthening the global response to the threat of climate change, sustainable development, and efforts to eradicate poverty [Masson-Delmotte, V., P. Zhai, H.-O. Pörtner, D. Roberts, J. Skea, P.R. Shukla, A. Pirani, W. Moufouma-Okia, C. Péan, R. Pidcock, S. Connors, J.B.R. Matthews, Y. Chen, X. Zhou, M.I. Gomis, E. Lonnoy, T. Maycock, M. Tignor, and T. Waterfield (eds.)]. In Press.
|
|
|
|
|
Kjellstrom T, Briggs D, Freyberg C, Lemke B, Otto M, Hyatt O (2016). Heat, Human Performance, and Occupational Health: A Key Issue for the Assessment of Global Climate Change Impacts. Annual Review of Public Health 37:97-112.
Crossref
|
|
|
|
|
Kjellstrom T, Freyberg C, Lemke B, Otto M, Briggs D (2018). Estimating population heat exposure and impacts on working people in conjunction with climate change. International Journal of Biometeorology 62(3):291-306.
Crossref
|
|
|
|
|
Kjellstrom T, Gabrysch S, Lemke B, Dear K (2009). The 'Hothaps' programme for assessing climate change impacts on occupational health and productivity: an invitation to carry out field studies. Global Health Action 2(1):2082.
Crossref
|
|
|
|
|
Kovats RS, Hajat S (2008). Heat Stress and Public Health: A Critical Review. Annual Review of Public Health 29(1):41-55.
Crossref
|
|
|
|
|
Lapse rate (2016). In Encyclopaedia Britannica. Encyclopædia Britannica.
View
|
|
|
|
|
Nilsson M, Kjellstrom T (2010). Climate change impacts on working people: How to develop prevention policies. Global Health Action 3(1):5774.
Crossref
|
|
|
|
|
Parsons K (2014). Human Thermal Environments. Boca Raton: CRC Press.
Crossref
|
|
|
|
|
Patz JA, Campbell-Lendrum D, Holloway T, Foley JA (2005). Impact of regional climate change on human health. Nature 438(7066):310-317.
Crossref
|
|
|
|
|
Peel MC, Finlayson BL, McMahon TA (2007). Updated world map of the Köppen-Geiger climate classification. Hydrology and Earth System Sciences 11(5):1633-1644.
Crossref
|
|
|
|
|
Sahu S, Sett M, Kjellstrom T (2013). Heat exposure, cardiovascular stress and work productivity in rice harvesters in India: implications for a climate change future. Industrial Health 51(4):424-431.
Crossref
|
|
|
|
|
Spector JT, Sheffield PE (2014). Re-evaluating Occupational Heat Stress in a Changing Climate. The Annals of Occupational Hygiene 58(8):936-942.
|
|
|
|
|
van Vuuren DP, Edmonds J, Kainuma M, Riahi K, Thomson A, Hibbard K, Rose SK (2011). The representative concentration pathways: An overview. Climatic Change 109(1-2):5-31.
Crossref
|
|