ABSTRACT
Landslide hazards have in the last 10 years become more prominent on the Mt. Elgon ecosystem in Uganda often culminating into disasters. In this study, the community was assessed on their vulnerability to landslide hazards and the efficacy of existing institutional mechanisms with a view of improving resilience and disaster risk reduction. The study area was selected based on historical information of landslide occurrence from Manafwa District Disaster Management Committee during site reconnaissance. Household interviews were conducted on 255 respondents using a pretested questionnaire to capture the community perceptions and elicit data on some vulnerability. The household interviews were enriched with Focused Group Discussions (FGDs) and Key Informant Interview guide. Also information on elements at risk to landslides in the catchment was captured and mapped out using GIS techniques and a Global Positioning System (GPS) receiver. Vulnerability to landslides was determined by considering the combined results of the thirteen weighted indicators and five weighting scores. Results revealed that the communities in the study area are highly vulnerable to landslide hazards (95%). Landslide hotspots are largely found on slopes: (45%) steep slope, medium slope (30%) and low lying (23%), and this was categorized into; low, moderate and high. Within the landslide hot spots, the major elements at risk to landslides was; agricultural land (36%), houses (22%), population (20%), livestock (13%) and infrastructure (9%). There were 6 households, 19 households and 91 households within very high, high and moderate hazard zones respectively.
Key words: Landslide vulnerability, elements at risk, hazard.
Landslide hazards are increasingly becoming prominent on the Trans-boundary Mt. Elgon ecosystems particularly on the Ugandan side (Yao et al., 2013; Mugagga, 2011; Kitutu et al., 2009; Kitutu, 2010). The government of Uganda is grappling with the challenge of sustainability addressing the landslide related disasters on Mt. Elgon. The initial intervention of throughresettlement of people from the landslide prone sites on Mt. Elgon to Kiryandongo in the South-western part of the country has not been very successful. An investigation as to the cause of this reveals that people are not very willing to move to new areas due to change in socio-economic regimes, loss of political power, productivity differences and strong socio-cultural ties. Alternative policy paradigms have advocated for intra development of urban centers within the mountain ecosystem were communities can be safely resettled however this may prove to be very expensive to the government as the initial establishment of the urban setting will need lump sum capital investment. In Uganda, property worthy million USD has been lost due to landslides, although a precise quantitative national monetary estimate of losses attributed to landslides is lacking. A synthesis of recent landslide hazards reveals a gigantic loss of life and property. It is estimated that the loss of lives due to landslides between 1964 and 2006 was at 130 compared to 2007 to 2011 which stands at 956 deaths; in total 1086 deaths have been recorded (online Uganda DisInventor, 2012). It is therefore important to undertake measures to reduce landslide related disasters.
Effective disaster risk reduction requires information on hazards dynamics and community knowledge on vulnerability to landslide hazard. Previous studies on landslides on Mt. Elgon (Claessens et al., 2007; Kitutu et al., 2009; Knapen et al., 2006) focused on hazard zonation. However scientific research covering the risk suite of both landslide hazard vulnerability, that informs disaster occurrence on Mt. Elgon is lacking.
In this study, community was assessed on their vulnerability to landslide hazards and the efficacy of existing institutional mechanisms with a view of improving resilience and disaster risk reduction. The study area was selected based on historical information of landslide occurrence from Manafwa District Disaster Management Committee during site reconnaissance. Household interviews were conducted on 255 respondents using a pretested questionnaire to capture the community perceptions and elicit data on vulnerability.
The general objective of the study was to contribute to improved resilience of mountain communities to natural hazards. This was achieved through identifying elements at risk and assessing the community vulnerability to landslide hazards and evaluating the existing institutional mechanisms for landslide risk reduction in Manafwa District.
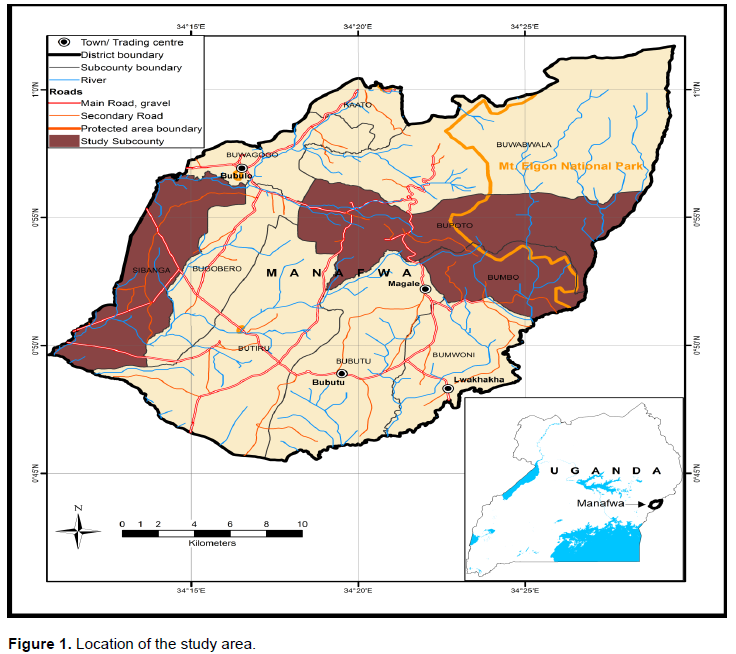
Description of the study area
The study was conducted in Manafwa District covering three Sub-Counties namely; Bumbo, Bupoto and Sibanga (Figure 1). Manafwa District is bordered by Bududa District to the north, the Republic of Kenya to the east and south, Tororo District to the southwest and Mbale District to the west. The center geographical coordinates is at approximately 0º 58’ 49.2’’ N, 34 º 58’ 49.2’’ E (UTM Zone 36, WGS 84 Spheroid with 7 m accuracy). The geology of the study area is associated with the caldera volcanoes. Mt. Elgon is the oldest solitary volcano in East Africa (Bamutaze et al., 2009; Scott, 1994), it rests on dissected peneplain of Precambrian bedrock of the Trans Nzoia plateau; Precambrian Basement Complex (MCEP, 1997).
Research design
Interactive interviews were held with key informants (KIs) (District Environment Officer and Local Chairperson) consisting of opinion leaders from the study area. The interview guide were sought to identify the causes of landslides, specific areas that are mostly affected, impact of landslide, community resilience capacity, potential sign of occurrence of landslide, institutions involved in combating landslide, and institutional framework for landslide risk reduction. Interview with the secretary for Manafwa District Disaster management committee was vital in reviewing the current policies that purportedly support communities for disaster mitigation, their strength and weaknesses analyzed and recommendation for improvement were captured too.
Observation checklist was constructed and systematic observations were made in the villages with the help of a checklist. They focused on household vulnerability factors, land use, human activities, location of settlements, landslide scars and their location, landslide resilience and mitigation related activities in the area. Other information gathered by field observation of land degradation particularly soil erosion and landslides in relation to slope angle. The primary reason for using the observation method was to check for the accuracy of the information got from the interview method (Mulhall, 2003). Field observation were undertaken to get an insight into the spatial distribution, characterize landslides and identify the landslide hotspots.
Vulnerability assessment
Social vulnerability
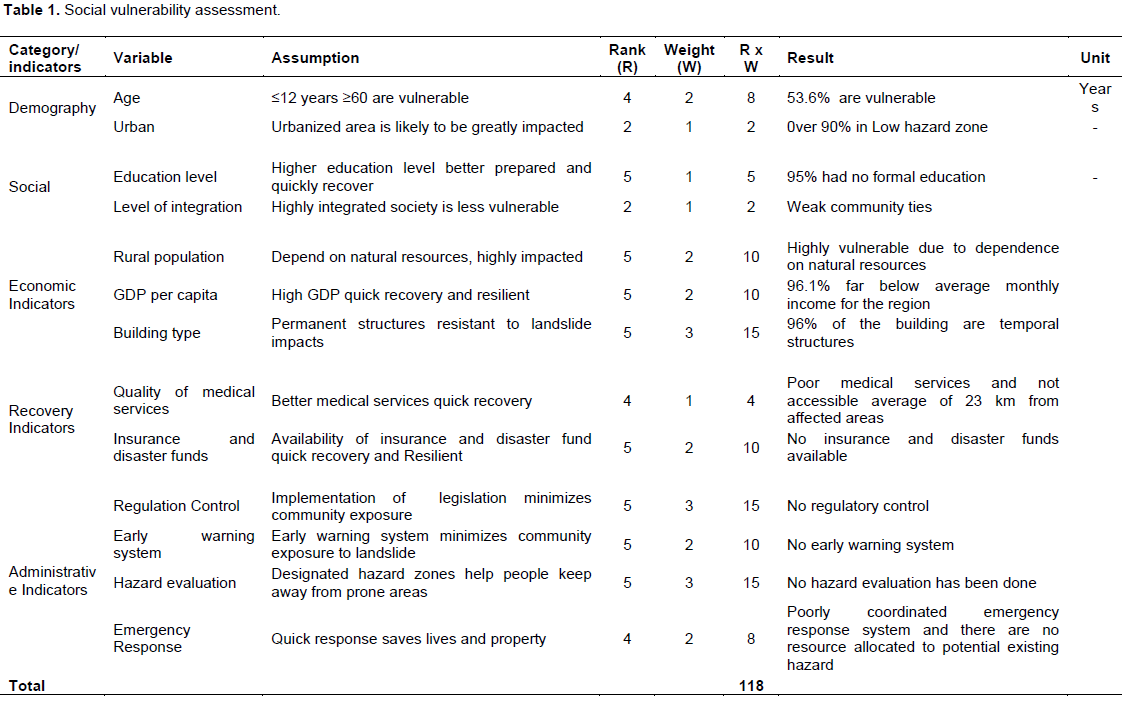
Social vulnerability to landslide was determined was done by considering the existing socio-economic characteristics of the study area. This was incorporated in the landslide vulnerability model indicator ranking and weighting parameters namely: Age, nature of the population density, education level, rural population, income levels, nature of building materials and type, availability of medical services, availability of insurance cover and disaster funds, regulatory control available, hazard mapping, early warning system, and emergency respond. The above variables were divided into five indicators; each indicator was then ranked and assigned a rank value based on the level of vulnerability the area faces. The rank values ranged from 1 to 5, where 1 indicates the lowest level of vulnerability and 5 indicates the highest level of vulnerability. This range (that is, five possible rank values) was selected arbitrarily (it was normalized to the range 0 to 1 later).
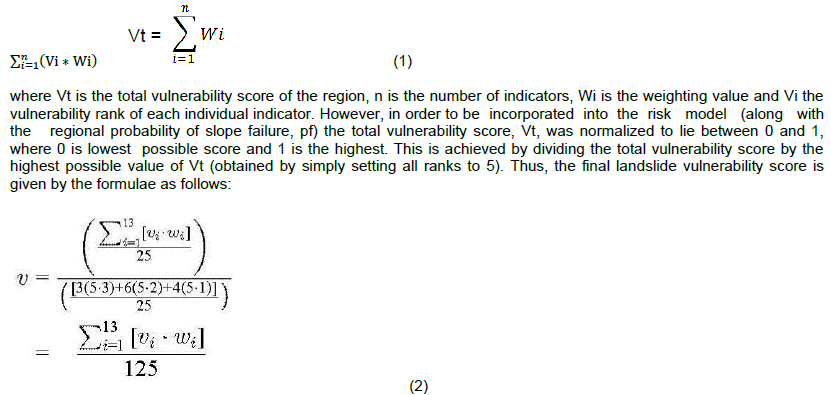
The landslide vulnerability model considers the combined results of the thirteen weighted indicators (socio economic data identified above) by use of the formulae as follows:
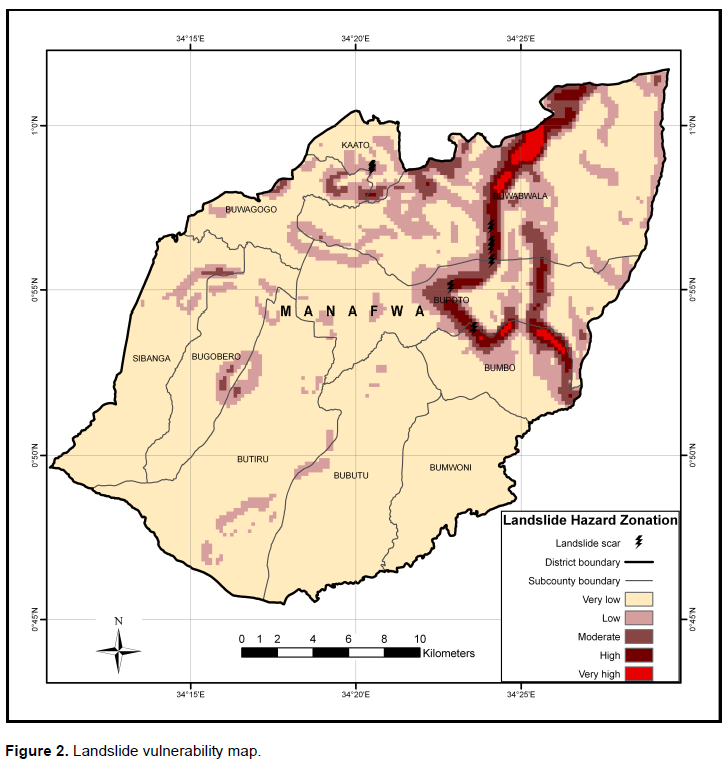
The ranking metric used for each of the vulnerability indicators is shown in Figure 2.
Social vulnerability ranking
Each of the indicators was individually weighted, on a scale of 1 to 3, based on their degree of relevance to the assessment. A score of 3 indicates the highest level of relevance to the vulnerability assessment. The total vulnerability score is computed as the sum of the weighted indicators (that is, the indicator rank, from Table 1, times the weighting value) divided by the sum of the weights. For this model the weights have been assigned based on educated judgment and extensive literature review. The indicators deemed most influential include: (3c) building type, (5a) regulation control and (5c) hazard evaluation, and so they have each been assigned the highest weight of 3. The indicators: (1a) age, (3a) rural population, (3b) GDP per capita (personal income), (4b) insurance and disaster funds, (5b) early warning systems and (5d) emergency response were considered moderately influential and assigned weights of 2. Finally the remaining indicators: (1b) urban population, 2a) education level, (2b) level of integration and (4a) quality of medical services were regarded as least influential and each assigned a weight of 1 (Table 1).
Physical vulnerability
Geospatial techniques were used to identify and map the elements at risk of landslide hazard in Manafwa. The elements at risk included roads, schools, trading centers, health centers, churches and mosques, housing units, agricultural fields, livestock, community water points and people. The dimensions of the landslides were obtained by participatory GIS method with the help of ground measurements and truthing using GPS. For settlement areas a topographical map of Manafwa District (Uganda Bureau of Statistics (UBOS, 2012) at a scale 1:25,000 was obtained and geo-referenced, settlements and road were then digitized using ArcGIS 9.3 software. Houses were digitized as point map showing the distribution of housing units in the study area, land use cover (agricultural fields) was obtained from National Biomass Land use cover 2005 by slicing them off the general land use map. The slope gradient was derived from a Digital Elevation Model obtained from National Forest Authority. This was re-classified into the following percentage rise of slope gradient: 0 - 15°: very low, 15 - 25°: low, 25 to 35°: moderate, 35 - 45°: high, 45 - 60°: very high. Once these were obtained, they were crossed over with the landslide hazard map in a GIS environment to obtain the map showing the elements at risk to landslides in Manafwa District. In addition to this, community social map on landslide area coverage was prepared with the help of the local people; a number of houses that were within the landslide scar were mapped out and characterized. During the group discussions the participants were asked to show and delineate the areas susceptible to landslide hazards. The investigator further explored if the local people had the knowledge of coping, adaptation and mitigation strategies before the previous landslides.
Spatialization of vulnerability
This was done by considering the elements at risk occurring within the landslide prone areas and the accrued loses. The degree of losses was associated with human injuries, material damages and monetary losses and structural dysfunctions. The study region is characterized by permeable and impermeable alternating sedimentary rocks, monoclinal geological structure and hilly relief with higher precipitation of about 1500 mm/year, rising to 1,700 m and even more in some rainy season. The study area was associated with high population density coupled with increasing human pressure on lands especially within the encroached boundaries of Mt. Elgon National Park. The spatial background consisted in the Digital Elevation Model and all derived maps (slope, aspect, shading), realized based on the topographical plans and maps (1:5000). The second step was to realize the spatial inventory of elements at risk (vector format), based on the topographical map of the study area (1:5000) and field investigations. All elements have been classified using attribute databases: Residential buildings (single or multiple dwellings), other buildings according to their functionality, main and feeder secondary roads.
Determining elements at risk
Transect walk, field survey, interview coupled with observation were used in determining element at risk. Transect walk was done staring from the point of origin of the landslide for the landslide scar and from the existing land cracks outwards in for direction (where possible) covering a radius of 1 km. This was done after spatialization of the vulnerability. A number of infrastructures were identified within the landslide prone areas, namely: Houses, community access roads, churches, mosques, maize mill and store, community wells, spring and water tanks.
Statistical analysis
We obtained the geo-referenced household vulnerability status from procedures explained previously. The indicators were entered in a GIS environment and overlayed with the layers of the 5 physical parameters.
The spatial data collected over coverage of landslide and the elements at risk was done using ArcGIS (Version 9.3). This was done to generate and characterize landslides and identify and map potential elements at risk; hence facilitating in the understanding of key aspects landslide vulnerability within Manafwa District. In addition GIS environment was used to map landslide prone areas and come up with landslide hazard map. The geospatial analysis entailed a range of overlay analysis and spatial modelling to derive the elements at risk and map the vulnerability hotspots. The social economic information gathered from field in regard to people and institutional perspectives of occurrence of landslides were coded and fed in social scientist statistical package (SPSS Version 16) for analysis. Regression analysis was done to determine the major determinant of people’s willingness to be moved to safe area and what is the major factor that influences people’s choice of coping strategies to reduce landslide hazards. Descriptive statistics including the mean, percentages, coefficient of variation were also used in the analysis. Frequency distribution and cross tabulation tables, charts and bar graphs were generated from the frequency distribution using Ms Excel software.
Community vulnerability assessment by weighting and indicator ranking
Vulnerability determination by weighting system using age, nature of the population density, education level, rural population, income levels, nature of building materials and type, availability of medical services, availability of insurance cover and disaster funds, regulatory control available, hazard mapping, early warning system, and emergency respond (Table 2) revealed that the community in the study area are highly vulnerable to landslide hazards (95%).
=118/25
=4.7 (i)
= 118/125 (normalized equation)
= 0.95 or 95% (ii)
This result is expected since the majority of the societal and physical indicators are either not available at all. The areas is characteristically rural area with high number of less educated (97%) for example 22 and 75% attained no education at all and primary education respectively. In addition there is no early warning systems, no emergency response procedures, no coverage of insurance, no regulatory enforcement; no hazard evaluation has ever taken place and poor housing materials due to low income in the area (60 and 37% of the people earn less than 50,000 and 100,000 UGX per month respectively).
Physical vulnerability
Using five classes of percentage increase of slope gradient (0 - 15, 15 - 25, 25 - 35, 35 - 45 and 45 -60°) and in relation to elevation, a hazard map (Figure 2) revealed the presence of very highly vulnerable areas (mostly encroached forest land) on altitude ranging from 1800 to 2000 m above sea level. This zone was characterized with a number of landslide events in the past years. Research finding indicates those areas with slope gradient ranging between: 35 - 45, 25 - 35 and 15 - 25º to be highly, moderately and lowly vulnerable to landslide, respectively. However, there were human settlements on both very high and highly vulnerable areas; this may be attributed to the presence of fertile volcanic soils and the accessibility to the protected forest land for community harvesting of natural resources specifically “Malewa” (a delicacy of bamboo shoot) and firewood.
Elements at risk to landslide
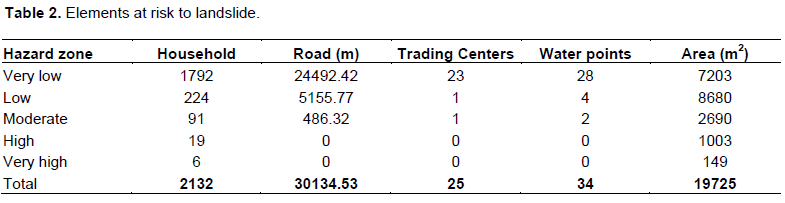
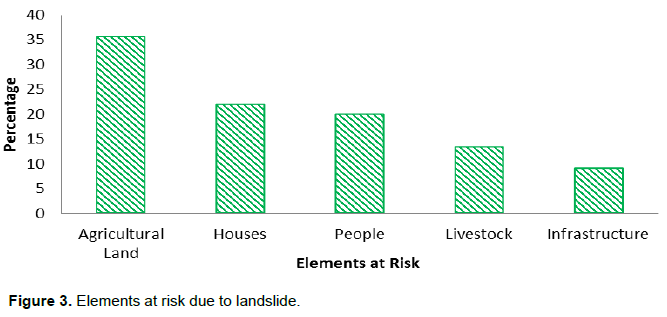
The identified elements at risk to landslides in Manafwa District were; agricultural land (36%), houses (22%), people (20%), livestock (13%) and infrastructure (9%). Their quantitative and spatial extent is illustrated in Figures 3 and 4, respectively. Agricultural land is the most affected due to cultivation on the steep slopes of Mt. Elgon coupled with other anthropogenic factors. Houses and People accounted for almost the same count due to the correlation existing between the two elements at risk, whenever houses are affected, people are equally affected. The community members within the study area mainly cultivate crop with limited number of livestock (31% of the sampled population had livestock). Infrastructures in the study area are poorly developed and or not available in some area. They include: Community access roads, churches, mosques, maize mill and store, community wells, spring and water tanks. All sampled house had no piped water or electricity. The access roads to the study area are poor and in many areas it is totally non-existence hence less affected by landslides.
Detailed evaluation of the Land use cover revealed that small scale farmland accounts for 75.4% (35,355 ha of land) followed by wood land 10.2% (6,612 ha of land), other land use cover were too small.
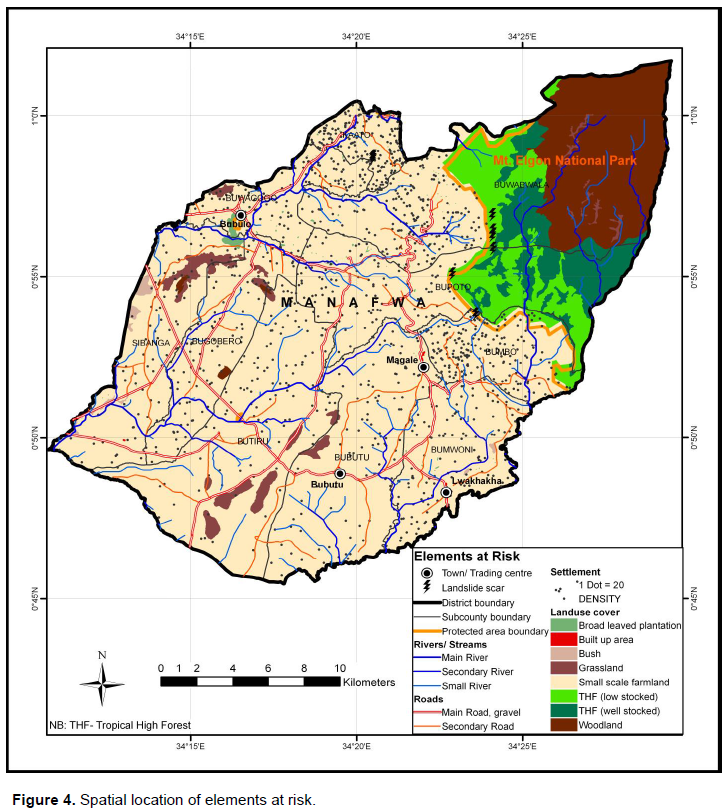
In order to show the vulnerability level of community members to landslide hazard, a map showing elements at risk was overlaid with a hazard map to form an integrated map (Figure 4). Areas bordering Mt. Elgon National Park were identified as landslide prone areas; these areas were zoned out as “high and very high” zone. Different elements at risk within the study area (Table 1) revealed that there were no Trading Centres, water points and road within high and very high hazard zone. However, there were 6, 19 and 91 households within very high, high and moderate hazard zones respectively.
Interaction of social and physical vulnerability
Community vulnerability to landslides is increased due to; (a) construction of houses along the hazard path way/slop/below rock fall; (b) occurrence of vulnerable group; (c) cultivation on landslide prone area; (d) loosely held soil type; (e) interference with slope angle; (f) destruction of vegetation cover. Field observations indicated that where many houses in the study area is constructed on sites which are arguable in the paths of slope failure. The area is also characterized by many vulnerable groups such as the children, youth, women and aged people who constitute approximately 70% of the population. Research further revealed that, community members have encroached on the forest land leading to the destruction of vegetation cover. Vegetation cover plays a crucial role of holding firm the loosely held soil in landslide prone areas. When loosely held soil is subjected to cultivation any triggering factors for example rainfall will lead to occurrence of landslide. Many farmers in the study area accept that houses are constructed on steep slopes. House construction involves creating a flat surface on the slope, which disrupts the slope and forms a hanging wall without support. During seasons of intense rainfall, the soil above the slope of the house collapses on the houses. 96% of the respondents were categorized as low income earners; they earn below the eastern regional average monthly income for rural area of 151,400 (UBOS, 2010). From the monthly income, one can deduce that high income earners are less vulnerable since they can affect the degree to which protection can be built for example constructing preventive measures and building strong homes. The low or medium income earners cannot afford to protect themselves to the same degree. Majority of the women interviewed were housewives who depended on their husbands’ monthly income.
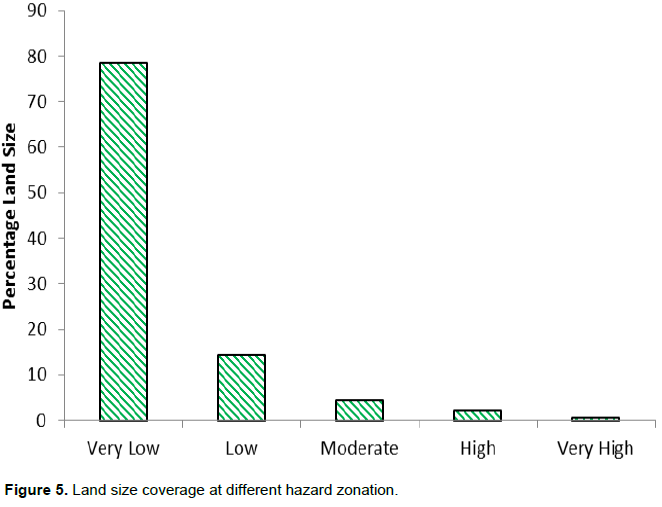
Evaluation of the percentage coverage of the land area (hazard zonation) revealed that the large percentage of the area is very lowly (78.4) vulnerable to landslide, followed in the sequence from low, moderate, high and very high with percentage coverage of 14.4, 4.5, 2 and 0.6% (Figure 5). However, the lowly vulnerable areas are less congested (population) compared to high and very high areas.
The vulnerability of elements at risk is high due to topographical position of elements at risk along hazard path (Glade, 2003) and poor or lack of land use planning. Most of the affected areas were occurring between 1500 and 2100 ma.s.l; this is evident by the landslide scars along this area. Knapen et al. (2006) observed that the effect of settlement on slopes of Mount Elgon in Uganda had increased the load on the deeply weathered basements thereby altering the balance of forces operating on the slope. The high population in the area attracted by the fertile agricultural soils and high rainfall has resulted in increased pressure on land and other resources causing instability on the slope (Ekotu, 2012).
The total landslide vulnerability assessment for the study area had a score of 95%, this is quite higher compared to a research done by Amanda Mclean in Norway (2010), in two areas Skien and Strada was at 20.4 and 39.3%, respectively. This is due to the fact that whereas there is no well-prepared landslide mitigation measures in Uganda; Norway is well prepared with institutions actively involved on landslide hazard mitigation. Ranging from early warning systems, emergency response procedures, coverage of insurance, regulatory enforcement, well documented hazard evaluation and use of quality materials in the construction industry. Lack of early warning system has led to the death of many people in entire Mt. Elgon region (Ekotu, 2012). He further observed that, early warning systems could reduce damage to property and minimize loss of lives.
High vulnerability of the communities to landslides may be attributed to a high income dependency ratio that is a function of income and the total number of dependents and level of education (Babirye, 2010). The study areas had a high income dependency ration of income less that 100,000 UGX but supporting large family of more than six dependents. This concurs with UBOS (2010) statistics which show that 55.8% of rural population depends on the productive work force. This situation is worsened by the fact that 60% of the respondents were peasant farmers dependent entirely on agricultural produce as a source of livelihood. According to UBOS (2010) community member in the study area earn (monthly income) much lower than eastern regional average monthly income for rural area of 151,400 UGX hence making them to entirely depend on natural environment and become more vulnerable.
The study has shown that agricultural land, houses and human population are most vulnerable elements at risk compared to livestock and other social infrastructures. The study further revealed that 95% of community in Manafwa District are vulnerable to landslide hazards. Community vulnerability to landslide hazard is high due to occurrence of houses along the landslide path, use of poor construction material (mud, tree poles and banana fibres) for houses, modification of slope angles, poor farming activities, lack of early warning system and lack of adequate resources. Community members attributed heavy rainfall and deforestation as the major cause of landslides in Manafwa District. The predominant coping mechanisms to landslides implemented at household level albeit with limited success are afforestation (57%) and relocation (28%) on a short timescale. Institutional structures both at policy level and community level were found to be weak in reducing the risk to landslides.
The authors have not declared any conflict of interests.
REFERENCES
|
Babirye GP (2012). Analyzing changes in landslide vulnerability and perception using a Participatory GIS Approach.
|
|
|
|
Bamutaze Y, Tenywa MM, Majaliwa MJM, Veerle V, Bagoora F, Magunda M, Obando JEW (2009). Infiltration characteristics of volcanic sloping soils on Mt. Elgon, Eastern Uganda, Catena.
|
|
|
|
Claessens L, Knapen A, Kitutu MG, Poesen J, Deckers JA (2007). Modelling landslide hazard, soil redistribution and sediment yield of landslides on the Ugandan foot slopes of Mount Elgon. Geomorphol. 90:23-35.
Crossref
|
|
|
|
Ekotu JJ (2012). Landslide hazards: household vulnerability, resilience and coping in bududa district, eastern Uganda. Submitted in partial fulfilment of the requirements for the degree Masters in Disaster Management.
|
|
|
|
Glade T (2003). Vulnerability assessment in landslide risk analysis: Die Erde, v. 134(2):121-138.
|
|
|
|
Kitutu MG, Muwanga A, Poesen J, Deckers JA (2009). Influence of soil properties on landslide occurrence in Bududa District, Eastern Uganda. Afr. J. Agric. Res. 4:611 - 620.
|
|
|
|
Kitutu MG (2010). Landslide occurrences in the hilly areas of Bududa District in Eastern Uganda and their causes
|
|
|
|
Knapen A, Kitutu MG, Poesen, J, Deckers J, Muwanga A (2006). Landslides in a densely populated county at the footsteps of Mount Elgon (Uganda): characteristics and causal factors.
|
|
|
|
MCEP (1997). Mount Elgon National Conservation and Development Project (MECDP). Final Report, Ministry of Natural Resources, Kampala, Uganda.
|
|
|
|
Mclean A (2011). Landslide Risk Assessment Using Digital Elevation Models Department of Engineering Mathematic.
|
|
|
|
Mulhall A (2003). In the field: notes on observation in qualitative research. J. Adv. Nurs. 41(3):306-313.
Crossref
|
|
|
|
Mugagga F (2011). Land use change, landslide occurrence and livelihood Strategies on Mount Elgon slopes, Eastern Uganda.
|
|
|
|
Scott P (1994). An Assessment of Natural Resource use by communities from Mt. Elgon National Park, Conservation and Development Project, UNDP/ Technical report No. 15. Mbale, Uganda.
|
|
|
|
UBOS (2010).Uganda National Household Surveys Findings 2009/2010).Uganda Bureau of Statistics (2002), National Population and Housing census.
|
|
|
|
UBOS (2012). Uganda National Household Surveys 2012. Uganda Bureau of Statistics (2012), Topographical Sheet for Manafwa District, 2012.
|