ABSTRACT
Groundwater is an important freshwater resource in Tanzania. However, rapid urbanization, informal/unplanned settlements and agricultural intensification in major basins threaten its sustainability. Most groundwater aquifers in the country are not monitored or managed, thus exposing them to potential contamination and overexploitation. This paper is based on a research conducted in the months of February and March, 2014, to assess how hydrogeological parameters and human activities impact on groundwater resources in Hombolo catchment. Thirty water samples collected from boreholes and shallow wells in the catchment were found to have high nitrate concentrations of 51.35 and 37.91 mg/L, respectively. Nitrate concentration varied by land use types with agricultural areas being the largest contributor (exceeding 154 mg/L) while wells in residential areas had relatively low concentrations (about 2.97 mg/L). However, the nitrate results do not represent the whole year; it is limited to two (2) months of field study. Using DRASTIC overlay and index method, 37.5 and 6.6% of the catchment were classifed as moderate and high vulnerability, respectively. However, when DRASTIC governing equation was explicitly integrated with human activities rating, areas with high vulnerability increased from 6.6 to 17.5%. Increased human activities, changed groundwater vulnerability over time and moderate areas in 1987 had changed to high vulnerability by 2014. Integrating human activities in the methodology is more suitable for groundwater vulnerability assessment.
Key words: Groundwater contamination, risk assessment, vulnerability, human activities.
Groundwater is an important freshwater resource in Tanzania. It is extensively being relied upon to meet water demand for irrigated agriculture, and domestic water supply. With many rivers in the country drying up due to over abstraction and increased rainfall variability, water users (for example, cities, large scale commercial agriculture etc.) are turning to groundwater. However, rapid urbanization, informal/unplanned settlements, and agricultural intensification in the Tanzania’s basins such as Pangani, Rufiji, Wami-Ruvu, and Hombolo present major groundwater management challenges. As exploitation increase, determination of groundwater vulnerability through identification of the potential sources of the contaminants and prediction of susceptibility of a particular aquifer to contaminants is of vital importance for the reliable pollution control in the country. However, most groundwater aquifers in the country are not being managed, protected or monitored, thus exposing them to potential contamination and overexploitation hence unsustainable utilization. Responsible basin water boards lack the necessary technical and human resource capacity for groundwater management (Baumann et al., 2005; Tularam and Krishna, 2009).
There is a need to explore potential options for groundwater vulnerability assessment, and leading to proper management. Several studies have been done in different regions of the world to assess groundwater pollution risk by applying varied methods. Most vulnerability assessment studies are carried out with the idea that the physical environment can provide the groundwater resource with some degree of protection from the contaminants (Liggett et al., 2009). The main three methods, which are normally used in vulnerability assessment are index/overlay, process based and statistical methods (Ligget et al., 2009). General techniques followed in these three mentioned methods involve study of physical, chemical and biological processes occurring between the aquifer parameters and contaminants. Such parameters affect and control groundwater flow into, through and out of the aquifer across the vertical profile of an area (Rahman, 2008; Voudouris, 2010). Although major groundwater contaminants are related to human land use activities, in many cases though, human activities are not considered as a direct and potential factor in groundwater vulnerability assessments methods.
One popular method is the DRASTIC method developed by United States Environmental Protection Agency (US EPA) to assess vulnerability of groundwater to pollution (Aller, 1987; Babiker, 2005; Al-adamat et al., 2006; Al-Hanbali and Kondoh, 2008; Rahman, 2008; Wang et al., 2010; Javadi et al., 2011). The original DRASTIC method only “involves combining maps of parameters that affect contaminants transport from the surface to groundwater, then assigning an index value to those parameters; the results are a spatially oriented vulnerability index (Siham et al., undated)”. However, several studies have shown that the degree of groundwater vulnerability to contamination and its associated risks would be best understood by integrating both the functions of physical environmental factors and anthropogenic factors in the assessments (Wendland, 2005). A modified DRASTIC method that combines geological and human factors to assess groundwater contamination risk have been proposed and tested in several basins. This study intended to examine the potential of using an integrated method that directly considers human dimension as a major influential factor for groundwater vulnerability assessment in an African catchment. The paper applies a modified DRASTIC method that combines geological and human factors to assess groundwater contamination risk in Hombolo catchment, Tanzania.
Study area location
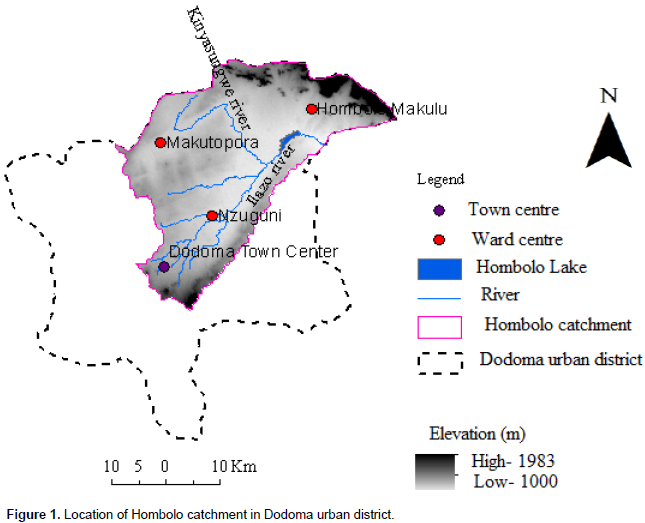
Hombolo catchment is a part of Dodoma Urban District situated 20 Km, along the road from Dodoma town to Dar-es Salaam. The catchment lies between latitudes 05° 056´S to 06° 09´S and longitudes 35°48´E to 35°58´E (Nkotagu, 1996a;
Soka et al., 2013). The north-eastern margin of the catchment is occupied by Lake Hombolo (Figure 1). The catchment contains two main sub-catchment areas; which are the northern and southern catchments (Rubwagisa, 2008). The river Kinyasinguwe drains the northern part, including the western sides of the Chenene hills down south to Makutopora. The second major catchment area drains Dodoma town southern hills to River Ilaso, which in turn drains into Lake Hombolo.
Climate
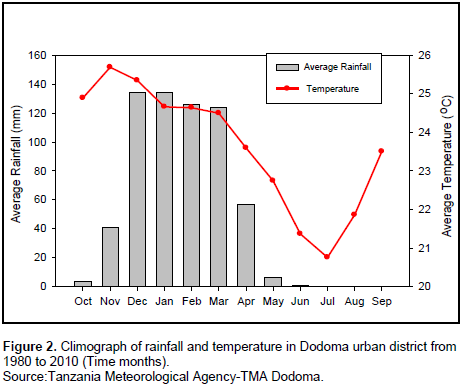
Hombolo Catchment is in a semi-arid region with average annual rainfall of 550 mm, annual potential evapotranspiration of 2000 mm, mean monthly maximum temperature of 26°C and mean monthly minimum temperature of 21°C (Rubwagisa, 2008). The region has unimodal rainfall pattern (Adosi, 2007) with the hydrological year starting in October and ending in May of the following year (Hamza, 1993). For the three last decades (1980 to 2010), this rainy season is followed by a dry spell that extends from June to September (Figure 2). The area experiences low river flow and drying of water reservoirs during the prolonged dry period (Sandstorm, 1995; Taylor et al., 2012;
Soka et al., 2013).

Soil and geology
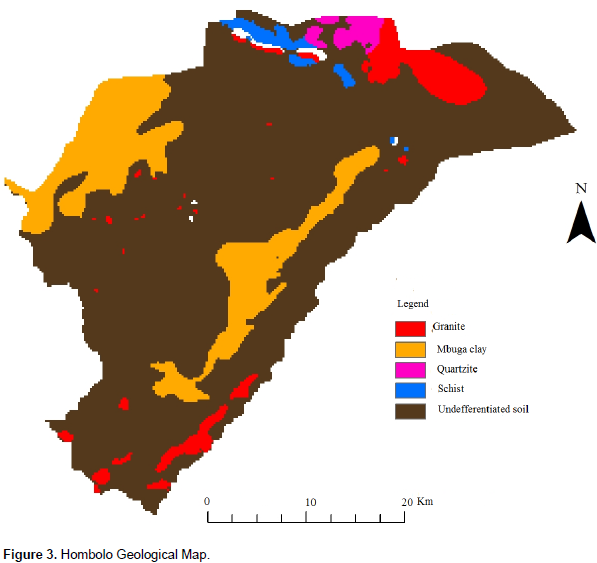
The area has three principal soil types; white sandy soil, red loamy soil, and poorly drained black clay soil called 'mbuga' (Rwebugisa, 2008). Geologically, Hombolo catchment is dominated by metamorphic rocks generally metamorphosed to green schist facies as other parts of Tanzania Craton (Figure 3). The common metamorphic rocks are quartzites, ironstones, micaceous quartzites, quartzo-feldspathic schists and ferruginous quartzites (Shindo, 1994; Rwebugisa, 2008). The groundwater is mostly found in fractured formation. Despite these fractured aquifers, groundwater is also found in the upper regolith part of the catchment (Hamza, 1993).The groundwater recharge occurs primarily through the fracture zone (Kashaigili, 2010), and the main recharge zone include the upper highland of Chenene mountainous forests with annual precipitation of about 850mm (Rwebugisa, 2008).

Water quality analysis
Water samples were collected between 25th February and 11th March 2014 from 30 boreholes and shallow hand dug wells. Borehole locations were recorded by using hand-held Global Positioning System (GPS). The GPS locations were recorded in line with land use type so as to identify the relative position of the well and the proximite land use categories. Samples were taken to Dodoma water laboratory, and kept in the refrigerator for nitrate analysis procedures. Laboratory analyses of the collected water samples was conducted at the Dodoma Urban Water laboratory (DUWASA Lab) by using DR/890/calorimeter procedures (Hach, 1997), the results were recorded and analysed.
Mapping vulnerability using the DRASTIC index
Groundwater vulnerability is expressed in terms of DRASTIC index after synthesizing of complex hydrogeological information of the region (Aller, 1987; Ducci, 1999; Babiker et al., 2005; Rahman, 2008; Liggett, 2009; Wang et al., 2010; Javadi et al 2011). Data collection involved observation, measurement and recording of water depth from the ground surface by using water level. Recording of borehole locations was done by using hand held GPS. Boreholes data was provided by Dodoma Urban Water Supply Authority (DUWASA) and rainfall information was obtained from Tanzania Meteorological Agency (TMA).The final DRASTIC Vulnerability index was calculated by combining all prepared map layers of seven parameters using the raster calculator in ArcGISsoftware as a computing tool (DRASTIC governing Equation 1):
Where DI is vulnerability index, D is depth to groundwater, R is net rainfall recharge, A is aquifer media, S is soil media, T is general topography/slope, I is vadose zone, C is hydraulic conductivity of the aquifer (these hydrogeological parameters are further described in the following section), while r and w are parameter rating and weighting respectively (Aller et al., 1987).
DRASTIC method input data set and analysis
Depth to groundwater level (D) is depth from ground surface to water table for unconfined aquifer to the bottom of the confining layer in confined aquifer. It determines the distance through which the contaminant must pass before it reaches the water table (Breaban and Paiu, 2012). Deeper water table levels imply lesser chance for contamination to occur (Babiker, 2005). Data for water level were collected from the field through direct measurement using groundwater level deeper and borehole report from DUWASA. Depth to water table map layer was prepared using an interpolation function in ArcGIS® software. Inverse distance weighted (IDW) is a simplistic interpolation method that does not account for physical properties. It explicitly implements the assumption that points closer to one another are more alike (Lin, 2008), and thus it is used to predict a value for any nearest unmeasured location.
Net recharge (R) is the amount of water that penetrates the ground and reaches the water table. This amount of water acts as a transport vehicle to carry contaminants to the groundwater (Rahman, 2008). Rainfall data for the study area were obtained from the regional meteorological department (MDT), and a map showing mean annual rainfall distribution for the study area was produced through digitization and spatial interpolation. Recharge factor was generated as a map through linear combination of the three factors (soil, slope and rainfall amount), which were considered to be important to the recharge amount in Hombolo catchment. Each factor was assigned a rating value based on its capacity to increase potential recharge value and were combined as defined by Piscopo (2001). Recharge value = slope% + rainfall + soil permeability. The recharge map was then classified into ranges and assigned ratings, the maximum recharge value was assigned 6 and minimum value was assigned 1.
Aquifer media (A) is the saturated zone material properties which control the contaminant attenuation process. The aquifer material depends on the type of rock formation of the area. Geological information was obtained from Geological Survey of Tanzania. Most of the aquifer materials are formed by weathered granite, quartzite and schist. Soil media (S) refers to the upper most portion of the vadose zone characterized by significant biological activities. It influences the surface and downward movement of water and contaminants. Data for soil variable were obtained from the world soil database (www.isric.org), and additional information on soil properties was derived from empirical literature. The soil media type was then assigned ratings between 1 and 10 according to their permeability (Babiker, 2005). Coarse fine media were assigned high rates while fine soil media have low rates.
Topography (T) is the slope of the land surfaces that influences infiltration of water and contaminants. Steep slope reduces the rate of infiltration by speeding up surface runoff while flat plain increases the rate of infiltration by reducing surface runoff. The slope percent map layer was prepared from digital elevation model of Advanced Space-borne Thermal Emission Radiometer (ASTAR DEM) accessed from United States Geological Survey (http://gdex.cr.usgs.gov/gdex). The rating values from 1 to 10 were assigned depending on the slope percent, flat areas scored high rates and steep areas scored low rates. Impact of vadose zone (I) is defined by vadose zone material. Vadose zone refers to the ground portion found between the aquifer and soil cover in which pores are unsaturated. Vadose zone material controls the passage and attenuation of the contaminant to the saturated zone (Babiker et al., 2005). Vadose zone corresponds to rock type and so coarse rock media was assigned a high rating value compared to fine media.
Hydraulic conductivity (C) is the ability of the aquifer formation to transmit water. Thus, it determines the flow rate of water and contaminants. An increase in hydraulic conductivity will increase speed at which contaminants are transported hence increases aquifer vulnerability. Hombolo catchment overlies a fractured aquifer with an average hydraulic conductivity of 10-5m/s (Nkotagu, 1996a). Based on rock type, areas with porous rock were defined as high conductivity zones and assigned high ratings while areas with impermeable rock were defined as low conductivity zones and were assigned low rates.
Weights and rating of the DRASTIC parameters
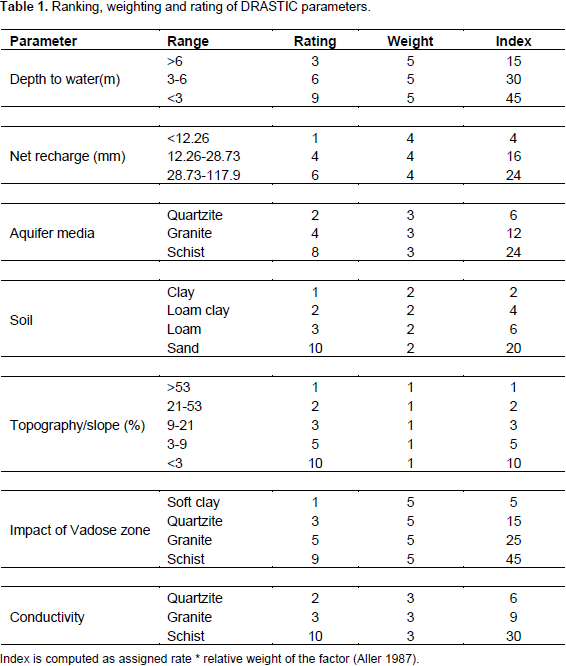
Each parameter was assigned a weight relative to each other (Table 1) in order of its pollution potential from 1 to 5; the most significant was assigned 5 and the least significant was assigned 1 (Piscopo, 2001). Ranges and ratings for each factor were devised based on its impact on pollution potential in the study area. Ratings were assigned a value between 1 and 10 to provide a relative assessment between ranges in each factor (Table 1). Rating of each parameter enabled the ranking of ranges in map layer of each DRASTIC parameter. The assigned rate for each factor was computed with relative weight of the factor to obtain the vulnerability index of a particular factor.

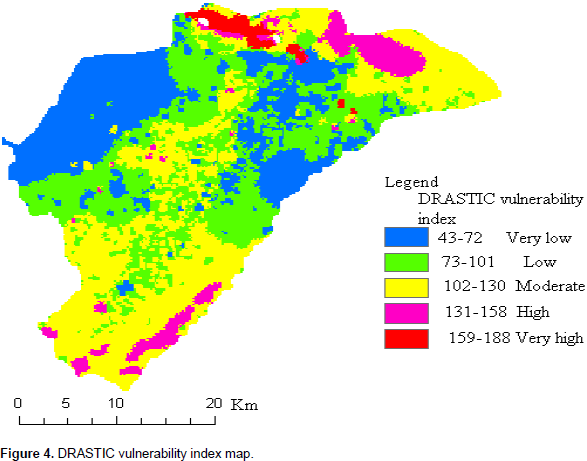
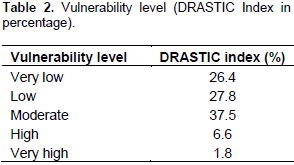
The overall DRASTIC index (Figure 4) was computed through linear combination of all map layers as illustrated in equation 1. A large part of the catchment was in the range of very low to moderate vulnerability (Table 2). The southern region showed moderate vulnerability while the northeastern part is characterized by both moderate and high vulnerability. Some parts of Northeastern region have shallow aquifers with more permeable rocks media (schist); likely the reason for high vulnerability in these regions. The region with the low vulnerability index dominates the central part of the region in which some parts are characterized by hard rock media (granite) and most of the deep boreholes are located in these regions. The central regions also have clay ‘mbuga’ soil, which has low soil permeability as compared to sandy soil.

Mapping hazard using the human activity index
Increased solute concentration in groundwater, especially nitrate,
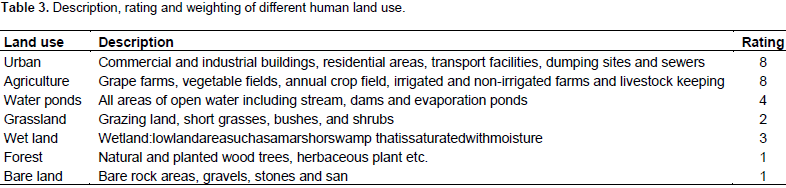
sulphate and potassium, indicates increased pollution resulting from urbanization and increasingly intensive agricultural activities (Schot and Van der Wal, 1992). To develop the human activity index map, seven land uses were categorized as human factors (Table 3 and Figure 5). Most of the nitrate in the study area is considered to results from urban (commercial areas) and agricultural areas, the highest value of 8 were assigned to urban and agricultural land use. The contaminants that may result from natural vegetation or bare land are considered very minimal in the study area and hence they were assigned the lowest value. The other land uses were assigned values based on their pollution potential as described in Table 3.

Development of human activity index
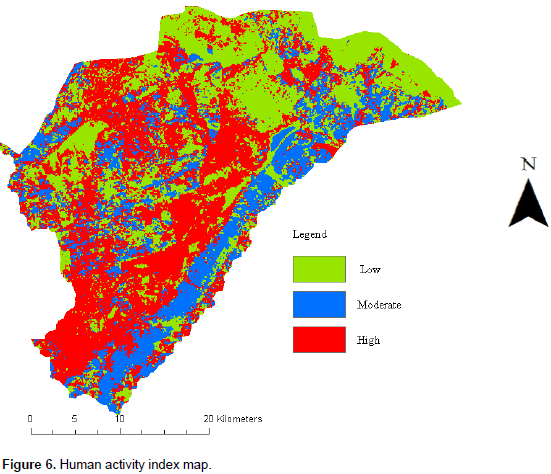
One of the overlay and index method assumptions was that the contaminant are introduced on the ground surface (Al-Zabet, 2002; Voudouris et al., 2010). Since land use activities are the potential sources of contaminant on the ground surface, the resultant land use map was subjectively considered as the potential parameter with high value of pollution risk, and thus was assigned the highest value of groundwater pollution risk weight of 5. Human activity index map (Figure 6.) was developed by assigning rating and weights to each landuse category subjectively and then reclassifing the map using reclassification tool in ArcGIS software. Places classified with high human activity index fell mostly in places with very low to moderate vulnerability.

Combining vulnerability and hazard to map risk
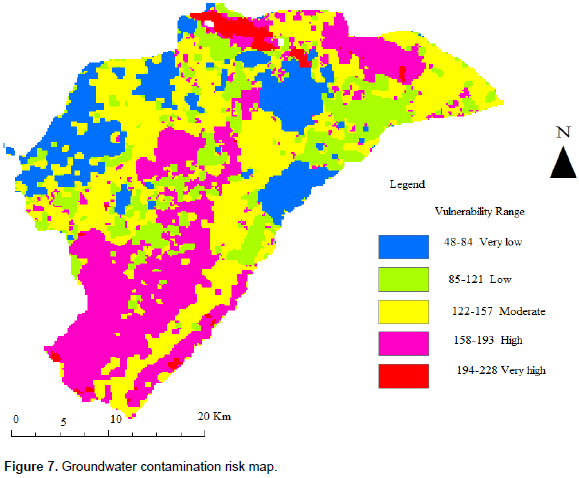
Human activity index map (Figure 6) was juxtaposed over the DRASTIC vulnerability index map (Figure 4) to generate a map showing groundwater contamination risk (Figure 7) as illustrated in Equation 2: Risk of groundwater contamination = DI + (LUCw*LUCr) (2) Whereby DI = DRASTIC vulnerability index, LUCw = weighting of land use map and LUCr = rating of land use parameters (Al-Hanbali and Kondoh, 2008). The resultant map indicate an increase in areaswith high risk of groundwater contamination.
Nitrate concentration in groundwater
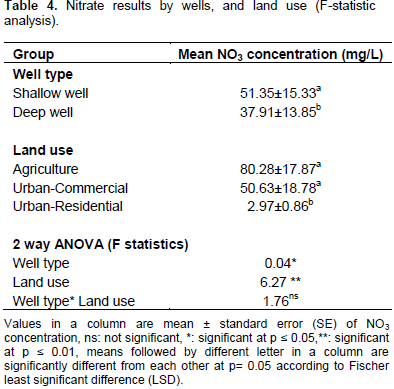
The results (Table 4) show that the well type such as deep well (mean nitrate concentration of 37.91 mg/L) and shallow well (mean nitrate concentration of 51.35 mg/L) in Hombolo catchment had significant statistical difference from each other on nitrate concentration (P<0.05). In addition, the nitrate concentration in the groundwater of the study area varied significantly (p<0.05) between agricultural sites (80.28 mg/L) and urban-residential areas (2.97 mg/L). The concentration of contaminants was observed to be high with a maximum value of 154.95 mg/L in areas with intense agricultural activities. Statistical analysis (F-statistic) showed that there was difference between the mean nitrate concentrations of shallow versus deep aquifers indicating that shallow aquifers are more suspectible to contaminants from the ground surface (Table 4). However, great variation was shown when comparing mean nitrate concentration in agricultural sites versus residential areas.
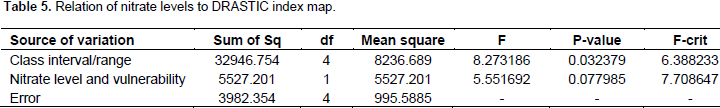
Relation of nitrate levels to DRASTIC index map
The DRASTIC index identifies areas, which are likely to be susceptible to groundwater contamination relative to one another. The DRASTIC index map (Figure 4) shows that, 37.5% of the study area fell under the moderate class and only 6.6% of the area was under the high vulnerable class. In addition, the analysis of variance supported that variation of nitrate levels correlate with vulnerability class for both DRASTIC and risk map. However the nitrate levels showed less correlation to the DRASTIC index map, since the P‒value for the nitrate level and vulnerability (0.07799) is greater than 0.05, and F-culculated (5.5517) is less than F-critical (7.7086). Therefore at 95% level of confidence, it can be concluded that there is no significance difference in drastic map between mean values of nitrate levels and vulnerability class. When considering the class interval, it shows definite impact to the drastic index map since the P‒value for the class interval (0.032379) is less than 0.05, and F‒calculated (8.2732) is greater than F-critical value (6.3882). So at 95% level of confidence, there is a significance difference in drastic map between the mean values of nitrate levels and vulnerability class (Table 5).
Relation of nitrate levels to Human Activity Impact (HAI) map
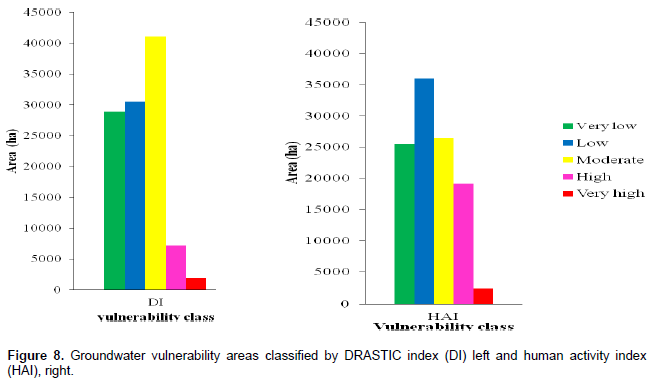
When human activity index map was integrated in the DRASTIC index map, there were changes on the size of vulnerability classes in which some areas with the moderate vulnerability category showed high vulnerability class, and some parts of the catchment with very low vulnerability class changed to low vulnerability class as presented in (Figure 8).

Relation of nitrate levels to risk map
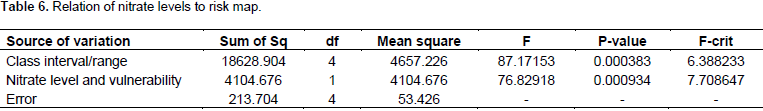
The correlation between risk map (Figure 7) and nitrate level showed significant difference since the P‒value for the nitrate concentration and vulnerability class (0.000934) is less than 0.05 and F‒calculated (76.82918) is greater than F-critical (7.708647) and so at 95% level of confidence there is a significance difference in risk map between the mean values of nitrate levels and vulnerability (Table 6). Consequently, the risk map provides more explanation of the variation in nitrate, making it a better predictor of the groundwater contamination risk.
However, the class interval showed an extent discrepancy to the risk map by increasing the variation between nitrate concentration and vulnerability class since the P‒value for the class interval/range (0.000383) is less than 0.05 while F‒calculated (87.17153) is greater than F-critical (6.388233) and so at the 95% level of confidence there is a significance difference in risk map between the mean values of nitrate levels and vulnerability level (Table 6). The p‒value is < 0.05 and so at the 95% level of confidence there is a significance difference between the nitrogen concentration and vulnerability level (Table 6.). Therefore, the HAI risk map provides more explanation of the variation in nitrate, making it a better predictor of the groundwater contamination risk.
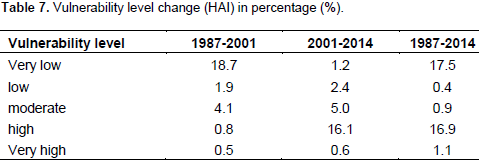
HAI changes from 1987, 2001 to 2014
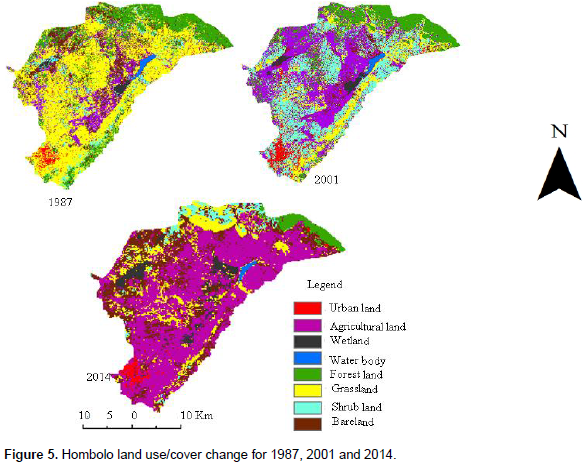
Human activity impact (HAI) derived from land use maps for the year 1987, 2001, and 2014 show a progressive increase of areas with high vulnerability level from 1987 to 2014 (Table 7). The changes make the areas, which were originally less vulnerable to become more vulnerable to groundwater contamination. The increasing groundwater contamination risk is directly linked to increased human population that has come about as a result of rapid urbanization, informal peri-urban settlement and extension of agriculture in the catchment. Different land use activities that contribute to high levels of nitrate concentration include intensive agriculture, urbanization, domestic, industrial wastes and feeding of livestock near water wells.
Agriculture is the major human activity conducted in most rural areas (Jalali et al., 2011) in which the application of fertilizers is still increasing. Urbanization in most part of developing countries is characterized by improper management of sewage effluent (Nkotagu, 1996b) from waste water systems, pit latrines and mismanaged solid wastes (Mato et al., 2000). Groundwater contamination risk map (Figure 8) indicates high pollution risk in areas that were originally considered not vulnerable. Population growth has increased development of urban and peri-urban settlements, which have led to utilization of land that was previously covered by natural vegetation such as shrubs and grasses, consequently increased groundwater contamination risk for some areas. HAI maps derived from land use maps for the year 1987, 2001, and 2014 (Figure 5) were used to determine the changes in the vulnerability level from the year 1987 to 2014.
There was progressive increase of areas with high vulnerability from 1987 to 2014 (Table 7). These changes in the vulnerability index are linked to Human activities impacts expressed by land use practices conducted in the region including extensive agriculture, expanding urbanization and human settlements. The changes are mostly linked to the move by the government to transfer the national capital from Dar es Salaam to Dodoma in 1973, fuelling its expansion from a small town of about 45,000 people in 1973 to 410,956 people in 2012 (Lupala and Chiwanga, 2014). Changing land use, particularly expansion in agriculture from 1987 to 2014 has increased demand for water supply and consequently causes overexploitation of the groundwater that has resulted in the decline of the underground water level (Mato et al., 2000; Kashaigili, 2010). As a result; discharge to other environmental systems like wetlands decreased and the contamination risk has increased. The increased water demand also has led to the numerous unknown groundwater abstractions mostly developed by the private sectors.
Consequently, many boreholes have been developed in unsurveyed areas without knowledge of aquifer potentials and water quality. According to the national water policy of 2009, the development of groundwater resources in the country have been done without sufficient information of the resource potential, in terms of quantity and quality. This is due to lack of data and sufficient environmental policy to monitor the groundwater management system. Therefore, a critical review of effectiveness and implementation of guidelines, procedures and policy scope is required for developing and managing groundwater. This validates the need for selection of appropriate groundwater monitoring and management approach that would properly take into consideration both biophysical environment and land use.
The analysis indicates that, groundwater pollution risk is better described as a function of vulnerability determined by hydrogeological parameters and the types of human activities. Not so much can be done about managing risk arising from the hydrogeology and climate of an area but groundwater contamination risk arising from human activities can be managed and contained through better land use planning implementation, and monitoring major development in a catchment.
In view of results obtained in this study, the HAI risk map that includes both hydrogeological factors and human impacts (land use) provides more explanation of the variation in nitrate levels of the Hombolo groundwater, making it a better predictor of the groundwater contamination risk. This implies that, significant improvement in risk assessment could be realized if both physical factors and human activities are included in risk assessment methods.The study used a simple but relatively effective representation of hazard (the land use map) in pollution risk assessment of groundwater aquifer, and it is relevant in regions with limited data like Tanzania. For this reason, the introduction of such relatively simple technique of risk analysis such as HAI approach, making land use information to be a root for setting plans towards groundwater protection and management can easily be applied to assess the vulnerability of such development. However, the nitrate results in this study does not represent the whole year, it is limited to 2 months of field study.
The study considered only the nitrate concentration as an indicator of human impact on the quality of groundwater in the catchment, further studies should be done using other posssible indicators like heavy metals in the groundwater that can adversely affect consumers’ health.Further studies ought to be conducted to assess the prevalence of the associated health risk (for example, ethemoglobinemia), that might exist among individuals who depend on groundwater in Dodoma. Regional climatic variations might have a range of impacts, including changing rainfall amounts and distributions and altering seasonal patterns. Studies ought to be done to assess the relationship between climatic changes and nitrate concentration in groundwater.
The authors have not declared any conflict of interests.
The authors would like to express their sincere gratitude to the government of Tanzania through the Nelson Mandela African Institution of Science and Technology (NM-AIST) for financial support. In addition, sincere thanks are conferred to the Director of Dodoma Urban Water Supply Authority for directives and cooperation offered during field work and data collection.
REFERENCES
|
Adosi J (2007). Seasonal variation of carbon dioxide, rainfall, NDVI and its association to land degradation in Tanzania, in Climate and Land Degradation. Springer pp. 373-389.
Crossref
|
|
|
|
Al-Adamat RD, Foster ID, Baban M (2006). Groundwater vulnerability and risk mapping for the Basaltic aquifer of the Azraq basin of Jordan using GIS, Remote sensing and DRASTIC. Appl. Geogr. 23(4):303-324.
Crossref
|
|
|
|
|
Al-hanbali A, Kondoh A (2008). Groundwater vulnerability assessment and evaluation of human activity impact (HAI) within the Dead Sea groundwater catchment, Jordan. Hydrogeol. J. 16:499-510.
Crossref
|
|
|
|
|
Aller L, Lehr JH, Petty R, Bennett T (1987). DRASTIC: standhrdized system to evaluate ground water pollution potential using hydrugedlugic settings. National Water Well Association, Worthington, Ohio, United States of America.
|
|
|
|
|
Al-Zabet T (2002). Evaluation of aquifer vulnerability to contamination potential using the DRASTIC method. Environ. Geol. 43:203-208.
Crossref
|
|
|
|
|
Babiker IS, Mohamed MA, Hiyama T, Kato K (2005). A GIS-based DRASTIC model for assessing aquifer vulnerability in Kakamigahara Heights, Gifu Prefecture, central Japan. Sci. Total Environ. 345:127-140.
Crossref
|
|
|
|
|
Baumann E, Ball P, Beyene A (2005). Rationalization of Drilling Operations in Tanzania. Review of the Borehole Drilling Sector in Tanzania. RWSN, Dar Es Salaam, Tanzania.
|
|
|
|
|
Breaban IG, Paiu M (2012). Application of DRASTIC model and GIS for evaluation of aquifer vulnerability: study case Barlad City area. In Water resources and wetlands, Conference Proceedings, Tulcea, Romania, ISBN. pp. 978-606.
|
|
|
|
|
Ducci D (1999). GIS techniques for mapping groundwater contamination risk. Natural Hazards. 20(2-3):279-294.
Crossref
|
|
|
|
|
Hach D (1997). 890 Colorimeter Procedures Manual. Orientation of Sample Cells, 25.
|
|
|
|
|
Hamza S (1993). Hydrogeological study of Makutupora basinsupported by groundwater flow modelling.Dodoma Tanzania, ITC, Enschede.
|
|
|
|
|
Jalali M (2007). Hydro chemical identification of groundwater resources and their changes under the impacts of human activity in the Chah catchment in western Iran. Environ. Monit. Assess. 130:347-364.
Crossref
|
|
|
|
|
Javadi S, Kavehkar N, Mousavizadeh M, Mohammadi K (2011). Modification of DRASTIC model to map groundwater vulnerability to pollution using nitrate measurements in agricultural areas. J. Agric. Sci. Technol. 13:239-249.
|
|
|
|
|
Kashaigili JJ (2010). Assessment of groundwater availability and its current and potential use and impacts in Tanzania. Unpublished Report prepared for the International Water Management Institute (IWMI). Sokoine University of Agriculture, Morogoro, Tanzania. pp. 4-60
|
|
|
|
|
Liggett JE, Talwar S (2009). Groundwater vulnerability assessments and integrated water resource management. Streamline, 13(1):18-29.
|
|
|
|
|
Lin J (2008). A review of spatial interpolation methods for environmental scientists, Geoscience Australia Canberra, 2008/23: 137pp.
|
|
|
|
|
Lupala J, Chiwanga P (2014). Urban Expansion and Compulsory Land Acquisition in Dodoma National Capital, Tanzania. J. Land Adm. East. Afr. 2(2):206-223.
|
|
|
|
|
Mato R, Janssen F, Katima J, Cramers C (2000). Groundwater deterioration in Dar es Salaam City, Tanzania. Paper presented at the A paper presented to the Groundwater: Present and Future Challenges Workshop, Cape Town, South Africa.
|
|
|
|
|
Nkotagu H (1996b). Original of high nitrate in groundwater of Tanzania. J. Afr. Earth Sci. 22:470-478.
Crossref
|
|
|
|
|
Nkotagu H (1996a). The groundwater geochemistry in a semi-arid fructured crystalline basement area of Dodoma. J. Afr. Earth Sci. 23:501-553.
Crossref
|
|
|
|
|
Piscopo G (2001). Groundwater vulnerability map explanatory notes: Lachlan Catchment, NSW. Department of Land and Water Conservation, Parramatta, NSW, Australia.
|
|
|
|
|
Rahman A (2008). GIS based DRASTIC model for assessing groundwater vulnerability in shallow aquifer in Aligarh, India. Appl. Geogr. 28:32-53.
Crossref
|
|
|
|
|
Rwebugisa RA (2008). Groundwater re-charge assessment in the Makutupora Catchment, Dodoma, Tanzania. Unpublished MSc. Thesis. International Institute for Geo-Information Science and Earth Observation, Ensched. pp. 43-54.
|
|
|
|
|
Sandstorm K (1995). Modeling the effect of rainfall variability on groundwater recharge in semi-arid Tanzania. Int. J. Nordic Assoc. Hydrol. 26:180-330.
|
|
|
|
|
Schot P, Van der Wal J (1992). Human impact on regional groundwater composition through intervention in natural flow patterns and changes in land use. J. Hydrol. 134: 297-313.
Crossref
|
|
|
|
|
Shindo S (1994). Study on the recharge mechanism and development of groundwater in the inland area of Tanzania. Progress report of Japan-Tanzania joint research, Chiba University 3:80. Siham B, Christina C, Ma'in Zaid A (undated). Groundwater Resources, the DRASTIC Method and Applications in Jordan. Available online
View
|
|
|
|
|
Soka G, Munishi PK, Mgina B (2013). Species diversity and abundance of Avifauna in and around Hombolo Wetland in Central Tanzania. Int. J. Biodivers. Conserv. 5:782-790.
|
|
|
|
|
Taylor RG, Todd MC, Kongola L, Maurice L, Nahozya E, Sanga H, MacDonald AM (2012). Evidence of the dependence of groundwater resources on extreme rainfall in East Africa. Nat. Clim. Chang. 3:374-378.
Crossref
|
|
|
|
|
Tularam GA, Krishna M (2009). Long term consequences of groundwater pumping in Australia: A review of impacts around the globe. J. Appl. Sci. Environ. Sanit. 4(2):151-166.
|
|
|
|
|
Voudouris K, Kazakis N, Polemio M, Kareklas K (2010). Assessment of intrinsic vulnerability using DRASTIC model and GIS in Kiti aquifer, Cyprus. European Water Resour. Assoc. 30:13-24.
|
|
|
|
|
Wang J, Yang J, Yu K, Lv F, Huang T, Gong Y (2010). Locality-constrained linear coding for image classification. Computer Vision and Pattern Recognition (CVPR), IEEE Conference, pp.3360-3367.
Crossref
|
|
|
|
|
Wendland F, Hannappel S, Kunkel R, Schenk R, Voigt H, Wolter R (2005). A procedure to define natural groundwater conditions of groundwater bodies in Germany. Water Sci. Technol. 51(3-4):249-257.
|
|