ABSTRACT
Surface water pollution poses a major risk to all biotic entities dependent on the water body. This study assessed the surface water quality of commodore channel, Lagos lagoon with respect to its heavy metals pollution level using indexing approach to determine the sources of heavy metal and its associated pollution risk. Samples were collected at a depth of 10-15 cm within a distance of 4 km from the shore line. Metal concentrations were evaluated using Atomic Absorption Spectrometry. The Concentrations of Pb (0.203-2.601 mg/L), Fe (0.253-1.049 mg/L), Cd (0.017-0.133 mg/L), and Co (0.000-0.226 mg/L) exceeded the recommended limits set by the World Health Organization, while Zn concentration (0.007-0.319 mg/L), was within acceptable limits for all locations investigated. Heavy metal pollution index (HPI) of the study area was found to be 3532.1, exceeding the critical pollution index value of 100. Similarly, the Metal Index (MI) of 150.5 of the study area was above threshold limit value of 1, suggesting that the area is seriously polluted with heavy metals. Sample t-test, confirms that there is a significant statistical different (with p value at p<0.05) between samples collected from the industrial areas and non-industrial area. The study revealed the sources of the heavy metals are primarily from anthropogenic source attributed to the untreated industrial discharge, and municipal solid waste disposed in the area. Prompt enforcement of environmental protection laws is needed to prevent continuous pollution of the area.
Key words: Water quality, heavy metals, atomic absorption spectrometry, surface water, heavy metal pollution index, metal index.
Water is exposed to numerous anthropogenic effects in the form of pollutants including toxic metals such as lead, cadmium and chromium. The impairment of water quality due to introduction of these pollutants is regarded as a Major problem faced by most industrial cities around the world. The uncontrolled discharge of waste effluents to large water bodies has and is still adversely impacting on both water quality and aquatic life (Das and Acharya, 2003). Heavy metals are bioaccumulated in several compartments across the food webs (Oyewo (1998). Metal bioaccumulation can be hazardous at all trophic levels, especially for human at the end of the food chain. Heavy metals are inorganic pollutants of great environmental concern as they are non-biodegradable, toxic and persistent with serious negative ecological ramifications on aquatic ecology (Jumbe and Nandini, 2009). Poorly planned urbanization and industrialization in some developing countries has been attributed to continuous pollution of the environment (Bhagure and Mirgane, 2010; Varalakshmi and Ganeshamurthy, 2010). Poor enforcement of environmental protection laws by government agencies in Nigeria has aided the discharge of untreated effluent and municipal waste into the water bodies (Oludayo (2012). Various industries and refineries discharge their effluent without treating it and these unhealthy practices have the tendency of deteriorating water quality. Tsai et al. (2003) had established that the distribution of heavy metals in surface water can provide an evidence of the anthropogenic impact on aquatic ecosystems and therefore aid in the assessment of the risks associated with the discharged waste. Heavy metal pollution index (HPI) and Metal Index (MI) had been widely deployed as an effective tool for the assessment of heavy metal risk in surface water bodies (Ameh and Akpah 2011; Goher et al., 2014, Ojekunle et al., 2016) and ground water (Kumar et al., 2012, Tiwari et al., 2016) Philips et al. (2012) has identified Commodore channel as an essential part of Lagos lagoon intricate system which connects the Lagos lagoon to the Atlantic Ocean. Abiodun and Oyeleke (2016) assessment of sediment in the Lagos lagoon had observed discharge of industrial and domestic waste within the Commodore channel. To the best of the authors knowledge there is no published report on the heavy metal pollution of surface water of this area.
Hence, the overall objectives of this research work are to:
1. Evaluate the heavy metals concentrations of the surface water within Commodore channel;
2. Assess the associated pollution risk using indexing approach;
3. Determined the possible source of contamination.
Study area
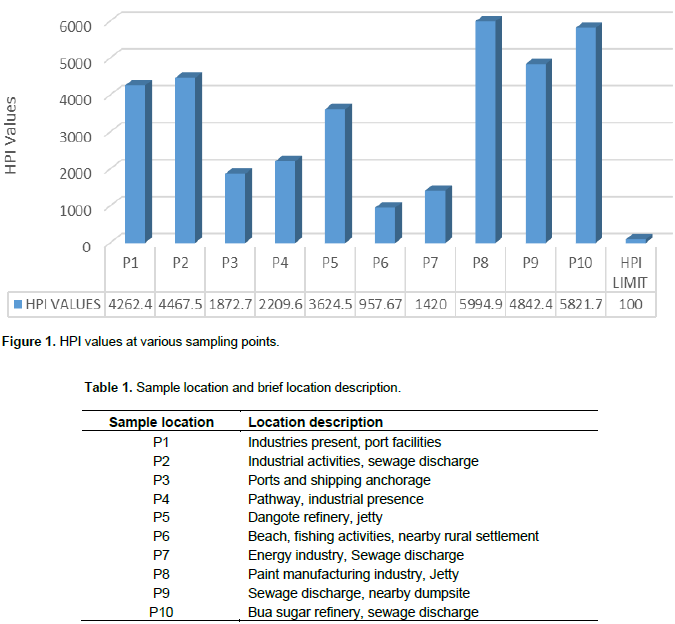
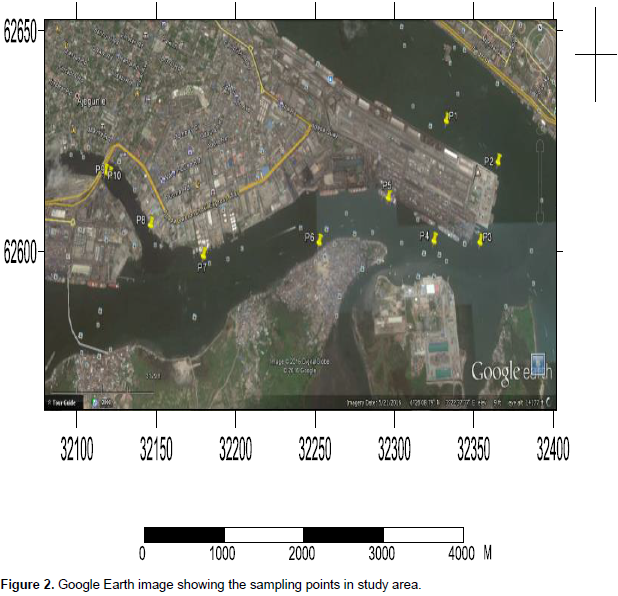
The study area is Commodore channel, Lagos State. It is situated within the Lagos lagoon (Figure 1). The brackish coastal lagoon lies within latitude 6°26'20.7” N and longitude 3°21'32.7” E. Lagos Lagoon empties into the Atlantic Ocean through Lagos harbour. The study area covers four kilometres (4 km) from the shore, and 500 m width. It is a tidal estuary with an average depth of 10 m. The area has a tropical climate and average annual rainfall is 1693 mm, the average temperature is 27.0°C. The fauna is composed of marine and brackish water species; depending on the season, among the fauna exploited for commercial purposes are finfish and shellfish. The channel is bounded by commercial offices, industries, ports and shipping companies (Table 1). The industries are mainly engaged in sugar refinery and paint production. There is visible discharge of sewage into the channel from the industries and shipping companies.
Sampling and sample treatment
Surface water were sampled in April, 2016 from ten sampling stations determined using the Global Position System (GPS); nine samples were collected from areas of industrial activities and one was taken from a non-industrious area (P6) Table 1. The samples were collected at 10-15 cm depth using decontaminated polypropylene bottles. Collected samples were acidified with concentrated nitric acid to a pH below 2.0 to minimize precipitation and adsorption on container walls. The samples were kept at 4ºC in an ice-container and transported to the laboratory for analysis. The samples of water were digested and then transferred into plastic bottles, labeled for analysis. They were analyzed for Pb, Zn, Fe, Cd and Co using atomic absorption spectrophotometer. The selected heavy metals are some of the major toxic metals as identified by USEPA (2002) in waste and water bodies. The analysis was carried out in accordance with the standard procedures specified in APHA 2005 and USEPA 3005 (USEPA 1987).
Digestion of sample and quality assurance
50 mL of each sample was digested with HNO3 as described by USEPA SW Method 3005 (USEPA 1987) procedure for the digestion of water sample: 50 ml HNO3 was added to sample in the beaker, covered and heated using hot plate placed in a fume cupboard until the volume has been reduced to 15-20 mL. Samples were allowed to cool and filtered using Whatman No. 42 filter paper. It was then transferred quantitatively to a 50 mL volumetric flask and made up to the mark with distilled water. Quality control measures and blanks were utilized in the course of the analysis. Sample blanks and replicate samples were analyzed along with samples to ensure precision and accuracy of analyses.
Data evaluation
Heavy metal pollution index (HPI)
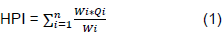
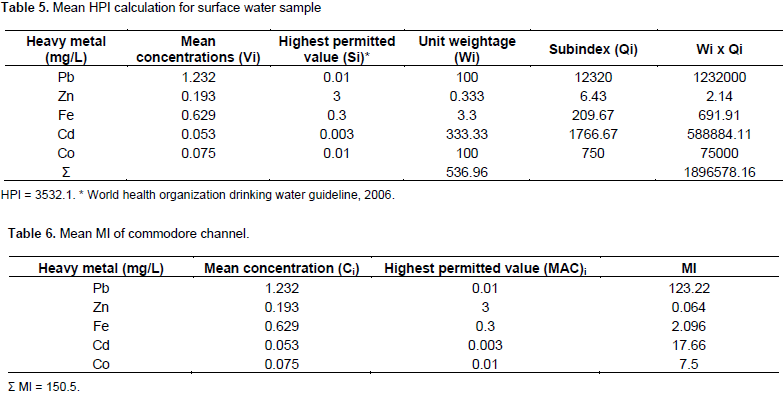
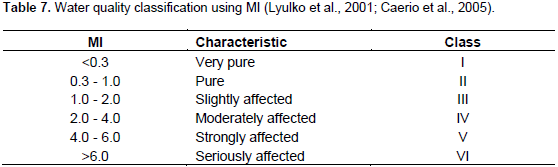
Heavy metal pollution index (HPI) was applied for the assessment of water quality on the basis of heavy metal concentration. Heavy metal pollution index (HPI) according to Mohan et al. (1996) is determined as thus:
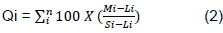
Where Qi represent Sub index of the ith parameter, Wi denote unit weight of the ith parameter and n is the number of parameters determined. The sub index (Qi) of each parameter is calculated as:
Where Mi is the evaluated value of heavy metal of the ith parameter, Ii denoted the ideal value of the ith parameter, Si represent standard value of ith parameter.
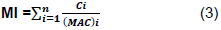
Where MI is the metal index, C is the concentration of each element in solution, MAC is the maximum allowed concentration for each element, and the subscript i is the ith sample.
Heavy metal concentrations
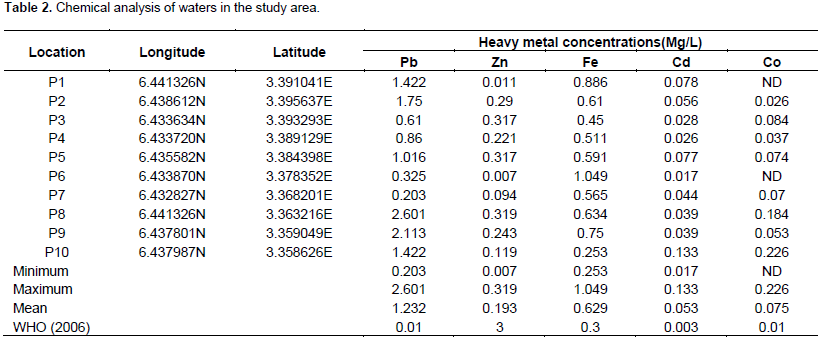
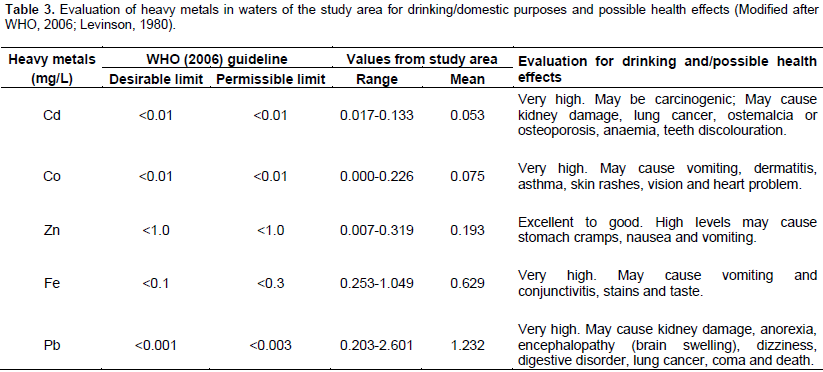
Heavy metals concentrations (mg/L) of samples investigated is shown in Table 2. The ranges of the heavy metal concentrations varied widely: Pb (0.203-2.601), Zn (0.007-0.319), Fe (0.253-1.049), Cd (0.017-0.133), and Co (0.0000-0.226). The mean concentrations of Pb, Zn, Fe, Cd, and Co are 1.232, 0.193, 0.629, 0.053 and 0.075 mg/l, respectively. Mean concentrations of Pb, Fe, Cd, and Co exceeded the permissible limit for portable water set by World Health Organization (WHO, 2006) While Zn was within the desirable limit. This could be attributed to the poor content of zinc in the discharge effluent or municipal waste and its low content within the sampling area. The relative abundance of the heavy metals were in the order Pb>Fe>Zn>Co>Cd. The elevated heavy metal concentrations of the study area could pose serious health challenges to most dwellers within the areas that largely depend on the water for agricultural and domestic uses. The possible effects of these heavy metals in humans and animals are presented in Table 3.
Assessment of metal contamination
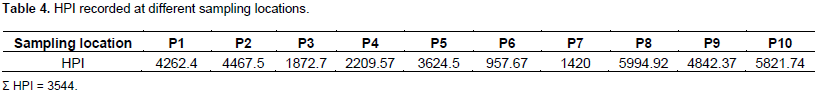
Two quantitative methods were used in assessing the risk level of heavy metal concentrations contamination in the samples: Heavy metal pollution index (HPI) and metal index (MI). The heavy metal pollution index for the study area was calculated using the mean concentration values of the selected metals (Pb, Zn, Fe, Cd and Co); the mean HPI was found to be 3532.1 (Table 4) which exceeds the critical pollution index value of 100. This implies that the study area (commodore channel), is critically polluted with very high concentrations of heavy metals. HPI for all sampling point were found to be greater than acceptable (HPI> 950) with the highest value (5994.92) recorded at P8 and the lowest value (957.67) recorded at P6 (Figure 2 and Table 5). Although P6 is characterized by non-industrial activities in the area, this outcome could be linked to dilution effect from discharge point towards the area (Kithiia, 2006). This shows that concentration of metals decreased with increasing distance from the pollutant emission sources. Metal index for the study area revealed very poor water quality with MI value of 150.5 (Table 6) which is above the threshold limit of MI value >1(Table 7). This observation buttress the initial observation that the channel has high burden of heavy metals concentration (Lyulko et al., 2001; Caerio et al., 2005).


This findings is higher than index values reported by Manoj et al. (2012) for Subarnarekha River (India) in which HPI value is 49.12, Reza and Singh (2010) for river water Angul-Talcher region, India in which the HPI value is 36.19 in summer and 32.37 in winter seasons. The findings are in agreement with research by Kumar et al. (2012), in which heavy metal pollution index was utilized to evaluate contamination in Chennai city, India. His result showed the sources of contamination were primarily anthropogenic had a common origin. To determine if the presence of industrial activities played any role in concentration of heavy metal in the study area, a statistical tool (Sample t-test) was utilized, mean concentration of each heavy metal from areas of industrial activities were tested against each heavy metals from an area of non-industrial activity (P6); results showed that there is significant difference in concentration of heavy metals between the industrial areas and the non-industrial area with P value (p<0.05), using a 95% confidence level for a 2-tailed test and degree of freedom (n-1) 8. The location of non-industrial activity (P6) recorded fairly low concentrations of all investigated heavy metals except for Fe concentration which was found to be very high (1.049 mg/L) compared to other sampled locations This could be associated to iron mobility in water bodies. According to Kabata-pendias (2001), iron is relatively immobile under most environ-mental conditions mainly due to the very low solubility of iron (III) hydroxide in its various form. Its solubility is strongly influenced by redox conditions; his findings recorded highest concentration of iron in regions of base-poor buffering capacity and he further suggested that the non-degradable nature and possible slow rate of dispersion may be responsible for higher levels observed near the shore region.
The study revealed that Zn concentration was fairly low and within recommended limit, while levels of Pb, Fe, Cd and Co in water samples exceeded the World Health Organization (WHO, 2006), standard limits portable water. Heavy metal indexing approach is a very useful tool in evaluating overall pollution of water bodies with respect to concentrations of heavy metals. The HPI and MI models indicated a high degree of heavy metal pollution in the study area which could be traced to primarily anthropogenic sources from untreated industrial discharge, refuse dumping, municipal waste and processing activities in the area. Using the sample t-test, it was confirmed that the industrial activities around the study area could play a major role in the increased level of heavy metal concentration observed. Prompt enforcement of environmental protection laws is needed to prevent continuous pollution of the area. These findings represent the first reported assessment of the study area.
Companies discharging effluent into the commodore channel should be made to put in place waste water treatment plant capable of effectively trapping potential heavy metals in the generated effluents. Further research is needed to assess the direct impact of the pollution on human and plant health within the area.
The authors have not declared any conflict of interests.
REFERENCES
|
Abiodun OA, Oyeleke PO (2016). Analysis and seasonal distribution of some heavy metals in sediment of Lagos lagoon using environmental pollution indices. Phys. Sci. Int. J. 10(2):1-11.
Crossref
|
|
|
|
Ameh EG, Akpah FA (2011). Heavy metal pollution indexing and multivariate statistical evaluation of hydro geochemistry of River PovPov in Itakpe Iron-Ore mining area, Kogi State, Nigeria. Adv. Appl. Sci. Res. 2(1):33-46.
|
|
|
|
|
American Public Health Association (APHA) (2005). Standard Methods for the examination of water and wastewater. Donelley RR and Sons Company, U.S.A. P 547.
|
|
|
|
|
Bhagure GR, Mirgane SR (2010). Heavy Metals Contaminations in groundwater and soils of Thane Region of Maharashtra, India. Environ. Monit. Assess. 173 (4):643-652
|
|
|
|
|
Caerio S, Costa MH, Ramos TB, Fernandes F, Silveira N, Coimbra A, Painho M (2005). Assessing heavy metal contamination in Sado Estuary sediment: An index analysis approach. Ecol. Indic. 5:155-169.
Crossref
|
|
|
|
|
Das B, Acharya C (2003). Hydrology and Assessment of Lotic Water Quality in Cuttack City, India. Water, Air and Soil Pollution 150:163-175.
Crossref
|
|
|
|
|
Jumbe AS, Nandini N (2009). Heavy metals assessment of wet-lands around Peenya industrial area, Bangalore. Res. Environ. Life Sci. 2:25-30.
|
|
|
|
|
Kabata-pendias A (2001). Trace elements in soils and plants. CRC Press, LLC.
|
|
|
|
|
Kithiia SM (2006). The effects of land use types on hydrology and water quality of Upper Athi River basin, Kenya. University of Nairobi.
|
|
|
|
|
Kumar PJ, Delson PD, Babu PJ (2012). Appraisal of Heavy Metals in Groundwater in Chennai City Using a HPI Model. Bull. Environ. Contam. Toxicol. 89:793-798.
Crossref
|
|
|
|
|
Levinson AA (1980). Introduction to Exploration Geochemistry. (2ndedn.) Applied Publisher Ltd, Wilmettene Illnois. 314 p.
|
|
|
|
|
Lyulko I, Ambalova T, Vasiljeva T (2001). To integrated water quality assessment in Latvia, MTM (Monitoring Tailor – Made) III, Proceedings of International Workshop on Information for Sustainable Water Management, Netherlands. pp. 449-452.
|
|
|
|
|
Manoj K, Kumar P, Chaudhury S (2012). Study of Heavy Metal Contamination of the River Water through index Analysis Approach and Environmetrics. Bull. Environ. Pharmacol. Life Sci. 1(10):7-15.
|
|
|
|
|
Mohan SV, Nithila P, Reddy SJ (1996). Estimation of heavy metal in drinking water and development of heavy metal pollution index. J. Environ. Sci. Health. 31:283-289.
Crossref
|
|
|
|
|
Oludayo GA (2012). Environmental Pollution and Challenges of Environmental Governance in Nigeria, Br. J. Arts Soc. Sci. 10(1):26-30.
|
|
|
|
|
Ojekunle OZ, Ojekunle OV, Adeyemi AA, Taiwo AG, Sangowusi OR, Taiwo AM, Adekitan AA (2016). Evaluation of surface water quality indices and ecological risk assessment for heavy metals in scrap yard neighborhood. SpringerPlus. 5:560
Crossref
|
|
|
|
|
Oyewo EO (1998). Industrial Sources & Distribution of Heavy Metals in Lagos Lagoon and Their Biological Effects on Estuarine Animals. PhD Thesis, University of Lagos. 274 p.
|
|
|
|
|
Philips OA, Falana AO, Olayiwola MA (2012). Assessment of Environmental impact on Benthic foraminifera distribution in Lagos Lagoon, Nigeria. J. Min. Geol. 48(1):68-78.
|
|
|
|
|
Reza R, Singh G (2010). Assessment of ground water quality status by using Water Quality Index method in Orissa, India. World Appl. Sci. J. 9(12):1392-1397.
|
|
|
|
|
Tamas G, Cini R (2004). Heavy metals in drinking waters from Mount Amiata (Tuscany, Italy) Possible risks from arsenic for public health in the province of Siena Sci. Total Environ. 327:41-51.
Crossref
|
|
|
|
|
Tiwari AK, Singh PK, Singh AK, De Maio M (2016). Estimation of heavy metal contamination in Groundwater and development of a heavy metal pollution index by using GIS technique. Bull. Environ. Contam. Toxicol. 96(4):508-515.
Crossref
|
|
|
|
|
Tsai LJ, Yu KC, Chen SF, Kung PY (2003). Effect of Temperature on Removal of Heavy Metals from Contaminated River Sediments via Bioleaching," Water Res. 37(10):2449-2457.
Crossref
|
|
|
|
|
U.S. Environmental Protection Agency (USEPA) (1987). SW Method 3005. Acid digestion of waters for total recoverable or dissolved metals for analyses by flame atomic absorption spectroscopy. Method study 35, U.S. Gov. Print Office, Washington DC.
|
|
|
|
|
U.S. Environmental Protection Agency (USEPA) (2002). Region 9, preliminary remediation goals.
View
|
|
|
|
|
Varalakshmi LR, Ganeshamurthy AN (2010). Heavy Metal Contamination of Water Bodies, Soils and Vegetables in peri urban areas of Bangalore City of India, Division of Soil Science & Agricultural Chemistry, Indian Institute of Horticultural Research, Hessaraghatta Lake Post, Karnataka, India. pp. 37-40.
|
|
|
|
|
World Health Organization (WHO) (2006). World Health Organization Guidelines for drinking water. (3rd edn.) World Health Organization of the United Nations, Rome, Italy. 1:68.
|
|