ABSTRACT
The objective of this work was to analyze the spatial variability of soil aggregates, porosity and density under five different land-uses and management conditions (degraded substrate - SD; degraded substrate with sewage sludge and Eucalyptus crop - SDLE; soil under pasture SP; capoeira under regeneration - SR; and soil under cerrado - SC). Total porosity (m3.m-3) and density (Mg m-3) of the soil; the mean weight diameter (MWD, mm) of the aggregates; and the percentage of aggregates resistant to rainfall were evaluated. The date of soil was analyzed with descriptive statistics for initial exploration and geostatistics, to analyze the spatial variability. There was spatial dependency and the parameter adjust range varied from 8 to 12 m under the treatments SD and SR for the aggregates and SR for macroporosity, total porosity and soil density. There was spatial dependency also under SP, for the aggregates, microporosity, and total porosity; under SC, for the aggregates; and under SDLE, for microporosity. Soil data with spatial dependence in the field were characterized both by high and low values in the same area. Therefore it is not adequate to consider these areas as homogeneous for future experiments and agricultural activities.
Key words: Spatial variability, soil aggregates, geostatistics.
At the Northwest region of the Brazilian state of São Paulo, large pasture areas are used for bovine cattle breeding and often show a history of degradation of their physical, chemical and biological soil features. The same goes for other uses which are poorly carried, such as the building of fills, cut-offs for the construction of roads, and mining activities, which cause the removal of thick soil layers, and consequently increase the deterioration of the system and cause stronger impacts to the environment.
This study has given special attention to the changes in physical soil attributes caused by moving large and thick volumes of soil for the construction of hydroelectric power dams (Alves et al., 2012). The construction of the hydroelectric power station of Ilha Solteira (SP, Brazil), in 1967, required excavating over 8 m off the left margin of the Paraná River (at the city of Selvíria, MS, Brazil), and left a compacted and impoverished substrate with scarce, low-height vegetation. Neighboring areas, which are also susceptible to the traffic of heavy machinery, were transformed into pastures or natural secondary vegetation (capoeira). A small part of the area, contiguous to the remainder Experimental Farms located in Ilha Solteira, SP, remained intact, and its natural cerrado vegetation was maintained.
The analysis of physical attributes of the afore-mentioned management systems comes from knowledge of the variability of soil attributes across space and time (Grego and Vieira, 2005). According to Andrade et al. (2005), modeling the spatial dependency of soil variables, allows estimation points in unsampled locations, thus making it possible to produce maps and zonings of the variable under study with better accuracy. For that purpose, geostatistics, more specifically semivariogram analysis, is the tool mostly used to characterize spatial variability.
Another aspect analyzed in this study was soil aggregation. Carvalho et al. (2002) calls attention to the direction given in the study of aggregation of soil that mostly relate to the determination of the distribution of pore size and aggregates. Thus, it is believed that studies that verify the spatial variability of soil aggregation become important to the management of agricultural practices, once soil aggregation attributes are strongly associated with soil quality (Grego and Vieira, 2005).
The hypothesis in this study is that taking spatial variations into consideration when analyzing the soil physical attributes enhances the knowledge on the use of the soils across the whole study area. Thus, the objective in this work was to analyze the spatial variability of the structure (soil aggregates), porosity (macro and micro) and density of the soil under different use conditions.
Study area
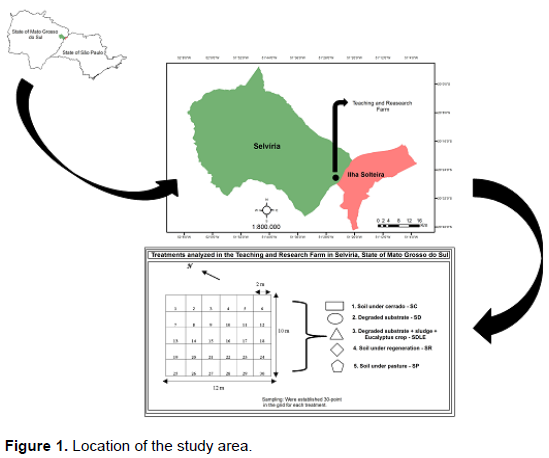
The study area is located within Universidade Estadual Paulista's (Unesp) experimental farm at Selvíria, Mato Grosso do Sul state, Brazil (51°22' West, 20°22' South – Figure 1), at a 355 m above sea level and a plain to slightly sloped relief. The Climate of the region is Aw, according to the Köppen classification system.
During the year, according to Demattê (1980), the average regional temperature is 23.7°C, with an average of 25.7°C during the warmest months (January and February) and of 20.6°C during the coldest months (June and July). The rainfall regime present an average annual rainfall rate of 1,300 mm, and the average relative humidity varies from 60 to 80% during the rainy months (from October to March), and from 50 to 60% during the dry months.
The experimental area is located at former construction sites of the hydroelectric power station of Ilha Solteira (SP, Brazil). Therefore, since 1967, the area has undergone deep excavations, which reached up to an estimated height of approximately 8 m at some spots. As a consequence, the soil became impoverished and compacted.
Some of the degraded plots were left as natural secondary vegetation (capoeira), others were kept preserved, with no further excavation, and part of the native cerrado vegetation was transformed into pasture. These land-use situations have been monitored over time with the aim of evaluating several processes related to their environmental recovery, thus becoming study sites for professors and students, among them are Colodro and Espindola (2006), Campos and Alves (2008), and Rosa et al. (2014).
Sampling
The soil samplings were made in July, 2004. Soil uses and managements were analyzed across five treatments employed in 12 x 10 m plots:
· Degraded soil, decapitated in 1967, with no traces of regeneration of its plant cover and with no treatments to promote recovery.
· Degraded soil treated with a single rate of application (60 Mg ha-1) of sewage sludge in August 2003, and planted with Eucalyptus.
· Degraded soil with presence of plant cover (capoeira) naturally recovered since 1967.
· Soil with pasture, with no use of chemical supplies, formed onto a natural plant cover (cerrado) since 1993.
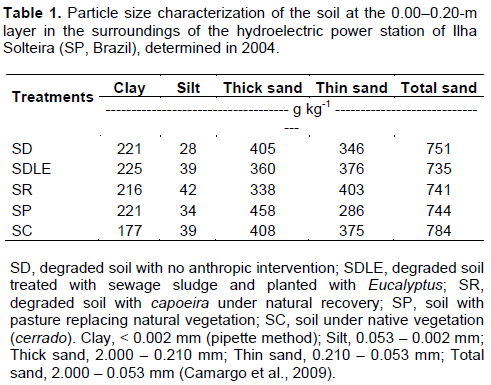
Soil covered by native cerrado. In this area the primitive soil is an Oxisol (Soil Survey Staff, 2010), corresponding to a Latossolo Vermelho by the Brazilian classification system (Santos et al., 2013), of medium texture, and very deep and rich in Fe and Al oxyhydroxides (Carvalho et al., 2015). For the particle size analysis, five soil samples, one for each experimental plot, were sampled using a 30-point grid (Table 1) at 0.00 to 0.20 m layer. These areas exhibit two texture classes (Demattê, 1980; Santos et al., 2013),which showed less expressive maximum differences in total clay and total sand content (≤ 48.50 and ≤ 48.23 g kg-1, respectively) under native soil in comparison to the other treatments.
The structure of the soils was analyzed using the Kemper and Chepil (1965) method, which evaluates the stability of soil aggregates and the mean weight diameters (MWD’s) by means of a mechanical agitator containing a set of sieves with different diameters. Thus, the 30 samples were analyzed at 0.00 to 0.20 m depth using duplicate samples of 25 g each, which were sieved in 9.52, 7.93, 6.35, 4.00, 2.00, 1.00, 0.50 and 0.50 mm mesh sieves.
The soil aggregates were also evaluated using the rainfall-simulation method, in which the hydraulic load used was enough to maintain constant dripping (Boyle-Mariotte's principle), as described by Roth (1985). This author verified simulator as the model used in this study, where precipitation of 64 mm/h represent a kinetic energy equivalent of about 60 to 80% of energy of the natural rainfall.
For the rainfall-simulation method, duplicates of 3 g of soil aggregates were sampled for each treatment, and an average rainfall of 60 mm h-1 was applied onto them during 20 m to produce three classes of aggregate sizes: 9.52 to 6.35, 9.52 to 4.00 and 9.52 to 2.00 mm. Then, the aggregates were transferred to aluminium crucibles with the aid of a wash bottle which were dried in the oven (105°C). The relative amount of stable aggregates under simulated rainfall (SAUSR) was obtained after reaching constant weight.
The density of the samples was determined according to Blake and Hartge (1986), and the porosity (microporosity was obtained using 6-kPa tension) according to Camargo et al. (2009). For each of the treatments, the soil samples were obtained using 100 cm3 volume rings and collected using 30 point grids at an equal distance of 2 m and at 0.00 to 0.10 m depth.
Statistical analyses
For an exploratory analysis of the data, descriptive statistics calculations were performed (mean, variance, coefficient of variation, skewness and kurtosis) using the STAT program (Vieira et al., 2002). Coefficients of skewness and kurtosis with values near zero (0) indicate data with normal distribution. If the data do not show normal distribution, some kind of transformation may be applied, such as logarithmic transformation. Normality is necessary when the hypothesis used is data randomness, to which classical statistics is applied. However, for geostatistics non-normality is not limiting for further analysis.
To verify if there was spatial dependence among the variables, geostatistical analysis was employed (Vieira, 2000; Vieira et al., 2008). The semivariograms were created based on the intrinsic stationarity assumption and the semivariance calculation γ(h) was estimated using Equation 1:
N (h) is the number of pairs of the measured Z(xi), Z(xi + h) values, separated by an h vector. According to Vieira (2000), it is expected that measurements taken near one another are more similar than those separated by large distances, that is, that the value of g(h) increases along a distance of h, up to a maximum value, at which it stabilizes at a level that corresponds to the limit of the spatial dependence distance, the range. Measurements taken beyond the range will show random distribution.
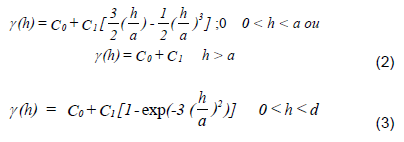
The semivariograms showed spatial dependence which was fitted using a mathematical model. Most of the semivariograms were fitted to the spherical model, whereas some fitted to the gaussian model (Equations 2 and 3). The models of the semivariograms were chosen according to the distribution of their points and were validated from the models adjusted according to Vieira et al. (2014). This method allowed the obtaining of Determination Coefficient (R2) and the Degree of Dependency (RD):
The semivariogram parameters were defined: C0 = nugget effect, which is the value of g (h). When h = 0; a = range, which is the distance beyond which g (h) remains rather constant after increasing along with h; C0 + C1 = sill, the value of g (h) beyond the range that approaches data variance; and C1 = structural variance, that is, the difference between the sill and the nugget effect.
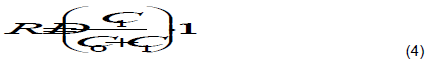
The spatial dependence ratio was also calculated (RD), which is the percentage proportion between the structural variance (C1) and the sill (C0 + C1), in Equation 4. According to Zimback (2001), (a) strong dependence > 75% (b) moderate dependence from 26 to 75% and (c) weak dependence < 25%.
The semivariograms' adjustment parameters (C0, C1, a) were obtained for the soil variables which showed spatial dependence. In these cases, the neighboring values will be so similar which will be possible to estimate values using kriging for any place, where variable has not been measured.
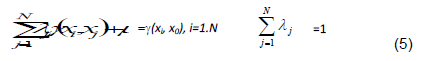
According to Vieira et al. (2002), the method estimates values using estimation conditions with no trend and with minimum variance towards the known values, that is, with minimum variance (Equation 5):
Where g(xi, xj) is the semivariance estimated using the model fitted to the semivariogram, which corresponds to the distance between the points located at xi and xj positions; g(xi, x0) is the semivariance that corresponds to the distance between the points located at xi and x0 positions; l-weight values and m is a Lagrange multiplier. Using the li values, (Z) can be estimated in the sampled space for any x0 position. Also, using the estimated values (Equation 6), isoline maps based on the geographic coordinate using the Golden Software (1999) software can be built.
Through the aggregate stability analysis (Table 2), MWD’s revealed aggregation states in direct proportion to the degradation degree of each treatment. Thus, soils which had no layers removed (soil under cerrado and soil with pasture) are composed by a different group of aggregates, when compared to the remaining treatments, which showed degraded soils (degraded substrate, degraded substrate + sludge + Eucalyptus, and soil developing natural secondary vegetation (capoeira).
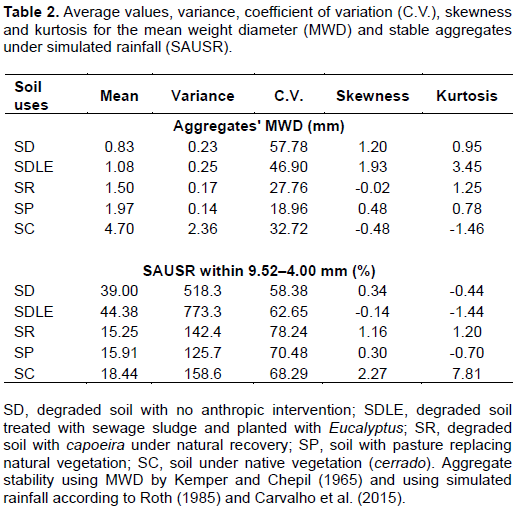
This situation may be expressed by MWD’s of the aggregates obtained: 4.70 mm for soil under cerrado; 1.97 mm for soil with pasture; 1.50 mm for soil recovered with capoeira; 1.08 mm for degraded substrate with application of sludge and Eucalyptus crop; and 0.83 mm for degraded substrate (Table 2). According to Kiehl (1979), low stability is connected with a MWD index lower than 0.5 mm, above which the aggregation index is considered resistant to raveling and dispersion, this help to understand the values obtained in this study for the degradeted areas.
Thus, the most adequate conditions for plant development were those seen on soil aggregates under cerrado and pasture. This is because of their capacity in conserving their structure when subjected to the water action. In this sense, in the study of Rodrigues et al. (2007), which was carried out at experimental farm at the UNESP of Ilha Solteira, the cerrado and pasture MWD’s also showed high indices when compared to the farm's degraded soils.
Tropical soils are subject to increased erosion and soil organic matter loss, thus studies that evaluate the effects of incorporating organic materials into soil aggregation are important. In this sense, Spaccini et al. (2002) evaluated MWD of aggregates of Ethiopian tropical soils. MWD was higher in forest soil than treated soils (crop residues and manure), regardless of location.
The quality of the structure of a degraded Oxisol was also evaluated by Bonini and Alves (2011) in order to detect its degree of recovery after 17 years of treatment with green fertilizers, chalk, gypsum and grass Brachiaria. In this work a higher average MWD value for native cerrado plant cover was also obtained, followed by an increase in aggregate size in the treatments featuring an increase in the aforementioned supplies.
The treatment with sludge and Eucalyptus cultivation showed a small increase in percentage of aggregates in comparison to the degraded soil with no improvement. It is known, based on the analyses made by Galdos et al. (2004) and Barbosa et al. (2002), that the addition of sludge significantly increases the percentage of organic matter, which consequently increases aggregate stability.
The increase in average MWD values was also detected by Maria et al. (2007) when analyzing a clayed Oxisol subjected to two rates, 10 and 20 Mg ha-1, of sewage sludge. As detected in this and other studies (Baldock and Kay, 1987; Silva and Mielniczuk, 1997; Wohlenberg, et al., 2004) which evaluated the stability of soil aggregates under that same condition, a kind of land cover offers a continuous supply of organic matter produced by root exsudates, by the renovation of the root system, and by the shoots or harvest residues, which cause stronger agglutination of soil particles.
The coefficients of variation for the MWD parameter indicated a strong difference between treatments, especially between SP (18.96%) and SD (57.78%). This is justified by the heterogeneities of the different use and management conditions to which the soils were subjected. In this same area, the soil aggregates in the pasture were strongly different from the other uses and management studied by Rodrigues et al. (2007) and Costa et al. (2014). These and other authors confirm that there is an effect of the permanent pasture root system on the macroaggregate formation process, especially the rhyzosphere, in aggregate formation and stability.
According to the classification proposed by Warrick and Nielsen (1980), the coefficient of variation is classified as low (< 12%), medium (from 12 to 60%) and high (> 60%). Most coefficients of variation detected in this study ranged from medium to high (> 20%) for the variables related to soil aggregates (Table 2), which indicates high variation between the minimum and maximum values. However, in the rainfall simulation method for the detection of soil stability the variation of the coefficients between treatments was low, which mean that the method translates a degree of homogeneity between the treatments.
The proven heterogeneity between the treatments when submitted to the method of stability through of a mechanical agitator with set of sieves, and homogeneity in the method of stability through the simulator-rainfall, can be understood by the particularities that each method presents.
In the stability by mechanical agitator, for example, the samples arranged in the set of sieves were immersed in a cylinder containing water, which provided the filling of the pores of the soil aggregates by the water, and compresses their internal spaces and, consequently, the cohesion between the particles which is overcome, added to that, there is a agitation of the sieves. This type of analysis aims to reproduce the phenomena of concentrated water and flood (Kemper and Chepil, 1965; Kemper and Rosenau, 1986).
In the method of stability of aggregates by simulator-rainfall, soil aggregate samples were not immersed in water before being submitted to dripping and agitation, which may explain a low rate of soil loss during the application of this method and, consequently, a low coefficient of variation between treatments. In accordance with the studies that used this method, its objective is to reproduce the action of the raindrops on the aggregates of the soil (Meester and Jungerius, 1978; Benito Rueda and Diaz-Fierros Viqueira, 1989).
Because of inadequate management arid, the Spanish Mediterranean has undergone desertification. Thus, the stability of soil aggregates by rainfall simulator was evaluated for these soils. It was verified that stable aggregates increased in the management in which oats straw was introduced to the soil when compared with the "control" (abandoned land), herbicide, plowing and plowing + oats. The authors noted that two main factors protect soil against erosion: vegetation cover, which can reduce rainfall energy and aggregate stability, strongly related to soil organic matter content (García-Orenes et al., 2012).
Brazilian Oxisols of the Cerrado biome with unsustainable management have also processes similar to desertification that justify the use of practices such as those mentioned in this study. Other statistical parameters were tested for skewness and kurtosis. It was verified that most treatments showed compatible with the normal distribution (values near 0), except for the MWD under SDLE, and the aggregate percentage under SC. However, according to Souza et al. (2014), geostatistics, are more important than normality because the semivariograms shows well-defined sills, thus enabling the hypothesis of the neighboring points which show more similarity than points further from one another.
Porosity and density are soil physical attributes which enable inferring soil-water-plant relations, soil compaction state and prospects of root expansion, and therefore are very useful for management plans (Reichert et al., 2007). In this work, as shown in Table 3, the macroporosity average was higher at the native plant cover (cerrado) area, followed by the area with a degraded substrate grown with Eucalyptus and onto which sewage sludge was applied, which indicates at least an initial recovery of the structural conditions due to the organic matter input, despite the short period (one year) of that management practice. Jorge et al. (1991) also observed an increase in macroporosity in a clayed Oxisol to which 40 or 80 t ha-1 of sewage sludge were applied in one single application. The behavior of the soil density (Table 3) suggests that the available land cover has some sort of effect onto soil density, at least within the first 0.10 m. It is interesting that, in absolute values, the density of Eucalyptus areas is higher than that of the material under exposed soil and under cerrado, which may be associated with higher contents of sand in it (Rodrigues et al., 2007), as shows Table 1.
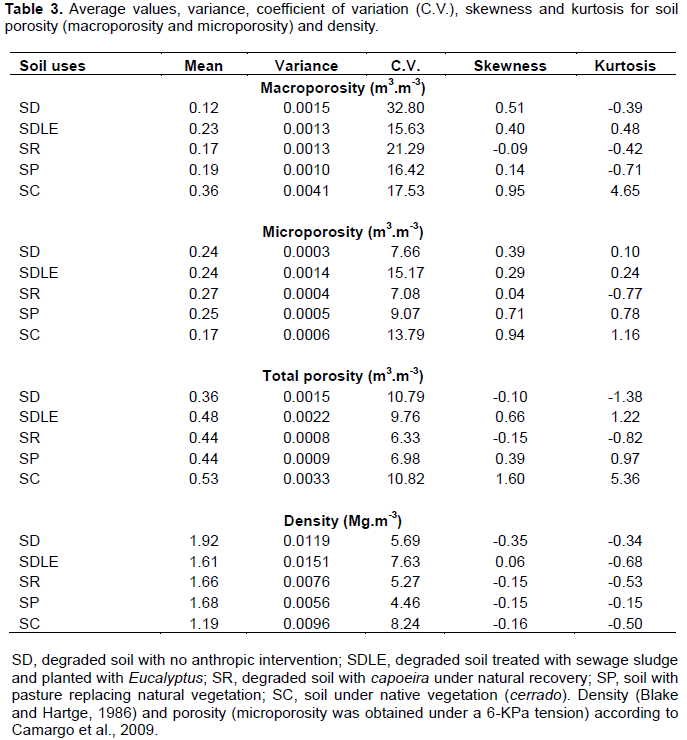
Soils presenting pastures and capoeira reflect the effects of soil compaction to which they were subjected, and showed macroporosity values of 0.19 and 0.17 m3.m-3, respectively. Although grasses favor porosity, a cattle stepping significantly contributes to soil compaction (Courtney and Trudgill, 1984). The degraded substrate, due to its high densification degree, showed the smallest macroporosity value (0.12 m3.m-3), similar to that obtained by Bonini and Alves (2011) for that same area (0.10 m3.m-3).
The microporosity values ranged from 0.24 to 0.27 m3.m-3. Thus, there was no expressive reduction in microporosity, even after the treatments applied at the surface (incorporation of sewage sludge and Eucalyptus crops). Moreover, at the soil covered by cerrado, which features a rougher texture and a greater supply of organic matter, the values obtained were not much different from those of the degraded substrates.
The soil under cerrado, which presents a thicker plant cover, showed the highest total porosity value, 0.53 m3.m-3, in spite of its rougher particle size distribution (Carvalho et al. , 2015), probably due to is high sand content.
Since density is inversely proportional to porosity, the degraded substrate showed the highest value for density among all treatments (1.92 Mg.m-3), due to the aforementioned removal of a thick layer of soil followed by its compaction by heavy machinery. The degraded substrate with Eucalyptus crop and sludge application showed a reduction in soil density (1.61 Mg.m-3), and consequently an increase in macroporosity, which is similar to what was observed by Colodro and Espindola (2006). However, as these authors adequately evaluate, it should be considered that this reduction may have also been caused by the mechanical effect of soil tillage using a rotating hoe, added to the residue's action.
At the same degraded area studied here, Campos and Alves (2008) have observed an improvement in density values, which decreased from 1.68 to 1.48 Mg.m-3 after the application of biosolids (sewage sludge). The coefficients of variation for total porosity and soil density showed the smallest values, which are considered average to low (< 20%).
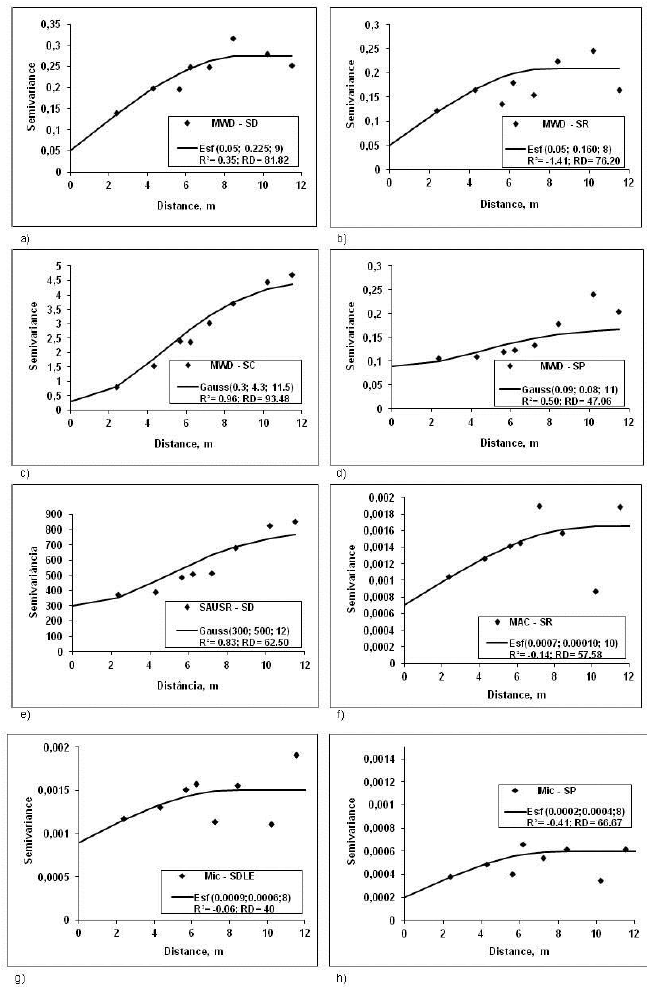
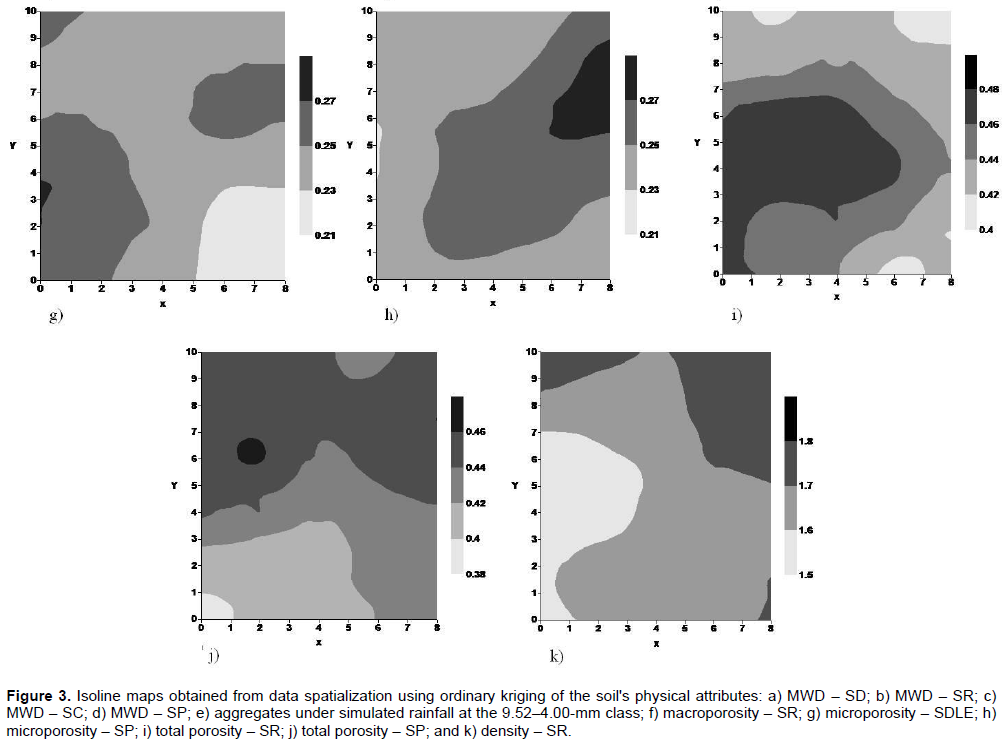
For the variables that showed dependence, with a range between 8 and 12 m, the semivariograms were created and fitted (Figures 2). The remaining attributes showed pure nugget effect, that is, no spatial dependence. Thus, the soil aggregates MWD were spatially dependent under SD, SR, SC and SP, but not under SDLE, which may result from the form of distribution of the sludge within the area, at short distances, and also resulted in discrepant values and hampered the identification of the spatial dependency. Under SD there was also spatial dependence for the percentage of aggregates analyzed using the rain simulator, which may indicate an intrinsic spatial variability of soil that features horizons that are remnants of degradation processes, once spatial dependence was also detected for this treatment during the MWD analysis.
The removal of the part of soil profile created an environ-ment where spatial variability depends on the distance that separates the samples. The intrinsic differences to the most surface and subsurface soil horizons enabled the spatial dependence of the structure, porosity and density under the degraded and regenerated land uses, probably due to the removal of soil at different depths for the construction of the hydroelectric power station.
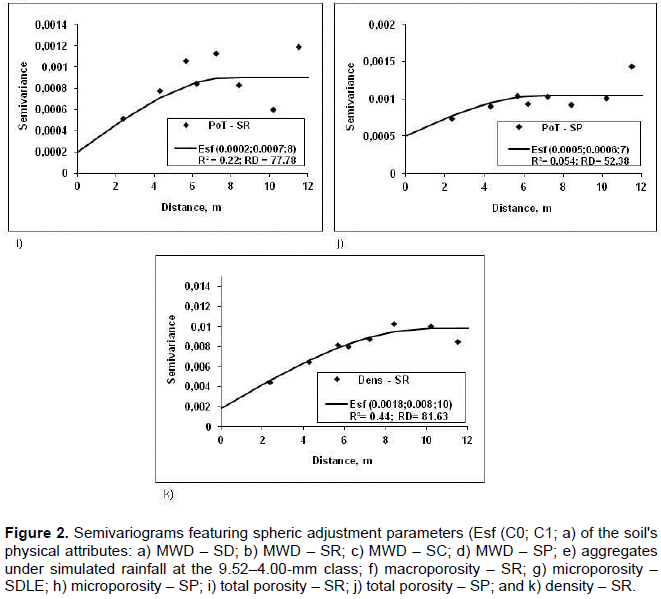
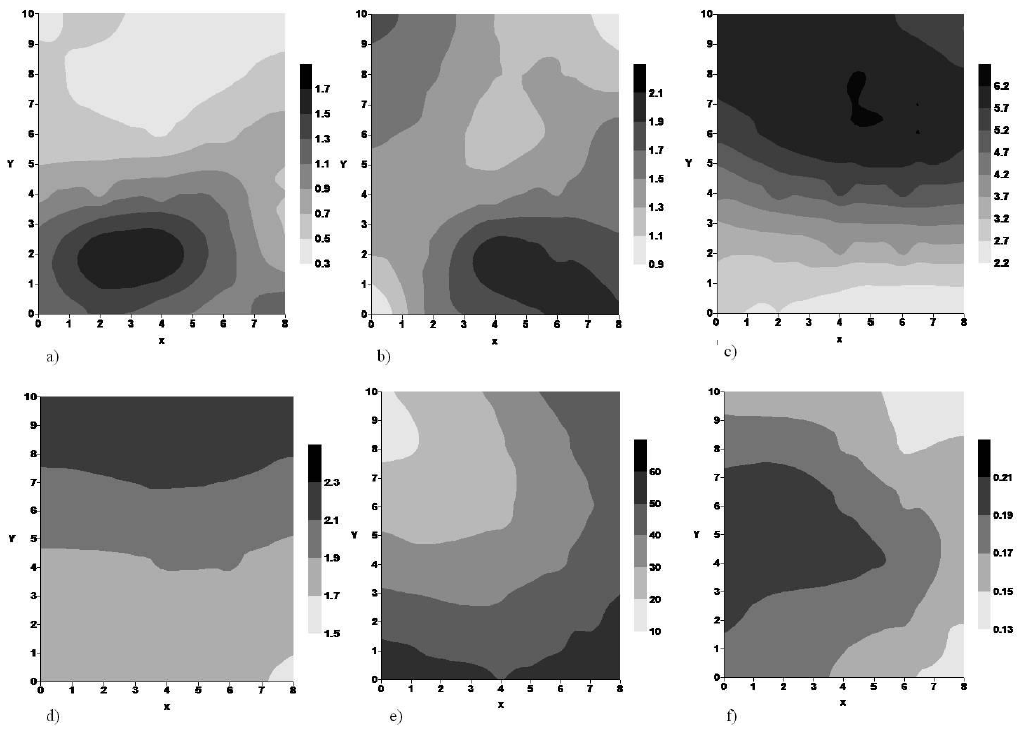
Areas delimited using spatially dependent data were identified in the maps of soil attributes, which indicates differences in their physical potential for plant develop-ment. Therefore it is not correct to consider these areas as homogeneous for future experimental agricultural activities. It can be stated that two methods used to evaluate the state of aggregation of the different managements are not equivalent. But both contribute to verify the state of aggregation under the differentiated action of water.
The authors have not declared any conflict of interests.
REFERENCES
|
Alves MC, Nascimento V, Souza ZM (2012). Recuperação em área de empréstimo usada para construção de usina hidrelétrica. Revista Brasileira de Engenharia Agrícola e Ambiental 16:887-89.
Crossref
|
|
|
|
Andrade ARS, Guerrini IA, Garcia CJB, Katez I, Guerra HOC (2005). Variabilidade espacial da densidade do solo sob manejo da irrigação. Ciência e Agrotecnologia 9:322-329.
Crossref
|
|
|
|
|
Baldock JA, Kay BD (1987). Influence of cropping history and chemical treatments on the waterstable aggregation of a silt loam soil. Can. J. Soil Sci. 67:501-511.
Crossref
|
|
|
|
|
Barbosa GM, Tavares Filho J, Fonseca ICB (2002). Avaliações de propriedades físicas de um Latossolo Vermelho Eutroférrico tratado com lodo de esgoto por dois anos consecutivos. Revista Técnica da Sanepar 17:94-101.
|
|
|
|
|
Benito Rueda E, Diaz-Fierros Viqueira F (1989). Estudio de los principales factores que intervienen la estabilidad estructural de los suelos de Galicia. Anales de Edafolgia y Agrobiologia, Madrid, 48:229-253.
|
|
|
|
|
Blake GR, Hartge KH (1986). Bulk density. In: Klute A, ed. Methods of soil analysis - Physical and mineralogical methods. Madison: ASA-SSS. pp. 363-375.
|
|
|
|
|
Bonini CSB, Alves MC (2011). Estabilidade de agregados de um Latossolo Vermelho degradado em recuperação com adubos verdes, calcário e gesso. Revista Brasileira de Ciência do Solo 35:1263-1270.
Crossref
|
|
|
|
|
Camargo AO, Moniz AC, Jorge J A, Valadares JMAS (2009). Métodos de análise química, mineralógica e física de solos do Instituto Agronômico de Campinas. Campinas: Instituto Agronômico (Boletim técnico, 106).
View
|
|
|
|
|
Campos FS, Alves MC (2008). Uso de lodo de esgoto na reestruturação de solo degradado. Revista Brasileira de. Ciência do Solo 32:1389-1397.
Crossref
|
|
|
|
|
Carvalho JRP, Silveira PM, Vieira SR (2002). Geoestatística na determinação da variabilidade espacial de características químicas do solo sob diferentes preparos. Pesquisa Agropecuária Brasileira, 37:1151-1159.
Crossref
|
|
|
|
|
Carvalho JCB, Espindola CR, Alves MC, Figueiredo GC, Dechen SCF (2015). Recovery of an oxisol degraded by the construction of a hydroelectric power plant. Revista Brasileira de Ciência do Solo 39:1776-1785.
Crossref
|
|
|
|
|
Colodro G, Espindola CR (2006). Alterações na fertilidade de um Latossolo degradado em resposta à aplicação de lodo de esgoto. Acta Scientiarum. Agron. 28:1-15.
Crossref
|
|
|
|
|
Costa CDO, Alves MC, Sousa AP (2014). Aggregate Stability in Two Soils Under Different Uses and Managements. Int. J. Sci. 2:61-68.
|
|
|
|
|
Courtney FMS, Trudgill T (1984). The soil: An introduction to soil study. London: Edward Arnold.
|
|
|
|
|
Demattê JLI (1980). Levantamento detalhado dos solos do Campus Experimental de Ilha Solteira (SP). Departamento de Solos, Geologia e Fertilidade ESALQ/USP. Piracicaba, 131 p.
|
|
|
|
|
Galdos MV, Maria IC de, Camargo OA (2004). Atributos químicos e produção de milho em um Latossolo Vermelho Eutroférrico tratado com lodo de esgoto. Revista Brasileira de Ciência do Solo 28:569-557.
Crossref
|
|
|
|
|
García-Orenes F, Roldán A, Mataix-Solera J, Cerdà A, Campoy M, Arcenegui F, Caravaca F (2012). Soil structural stability and erosion rates influenced by agricultural management practices in a semi-arid Mediterranean agro-ecosystem. Soil Use Manage. 28:571-579.
Crossref
|
|
|
|
|
Golden Software. Surfer 7.0 (1999). Contouring and 3D surface mapping for scientist's engineers. User's Guide. New York, Golden Software. 619 p.
|
|
|
|
|
Grego CR, Vieira SR (2005). Variabilidade espacial de propriedades físicas de solo em uma parcela experimental. Revista Brasileira de Ciência do Solo, 29:169-177.
Crossref
|
|
|
|
|
Jorge JA, Camargo OA, Valadares JMAS (1991). Condições físicas de um Latossolo Vermelho-Escuro quatro anos após aplicação de lodo de esgoto e calcário. Revista Brasileira de Ciência do Solo (Impresso) 15:237-240.
|
|
|
|
|
Kemper WD, Chepil WS (1965). Size distribution of aggregates. In: Black CA, Evans DD, White JL, Ensminger LE, Clark FE (Eds.). Methods of soil analysis – physical and mineralogical properties, including statistics of measurement and sampling. Madison: Am. Soc. Agron. pp. 499-510.
|
|
|
|
|
Kemper WD, Rosenau RC (1986). Aggregate stability and size distribution. In: KLUTE, A (Ed.). Methods of soil analysis. Madison: Am. Soc. Agron. 1:425-441.
|
|
|
|
|
Kiehl EJ (1979). Manual de edafologia. São Paulo, Agronômica Ceres, 262 p.
|
|
|
|
|
Maria IC de, Kocssi MA, Dechen SCF (2007). Agregação do solo em área que recebeu lodo de esgoto. Bragantia 66:291-298.
Crossref
|
|
|
|
|
Meester T, Jungerius PD (1978). The relationship between the soil erodibility factor K (Universal Soil Loss Equation), aggregate stability and micro - morphological properties of soils in the Hornos area, S. Spain. Earth Surface Processes, Wiley 3(4):379-391.
Crossref
|
|
|
|
|
Reichert JM, Suzuki LEAS, Reinert DJ (2007). Compactação do solo em sistemas agropecuários e florestais: identificação, efeitos, limites críticos e mitigação. In: Ceretta, CA, Silva, LS, Reichert, JM. Tópicos em Ciência do Solo, Viçosa: Sociedade Brasileira de Ciência do Solo 5:49-134.
|
|
|
|
|
Rosa PAL, Alves MC, Videira LML, Bonini CBS (2014). Recuperação de um solo de cerrado após 19 anos: ocorrência espontânea de espécies arbóreas. Revista de Agricultura Neotropical, 1:44-57.
|
|
|
|
|
Rodrigues GB, Maltoni KL, Cassiolato AMR (2007). Dinâmica da regeneração do subsolo de áreas degradadas dentro do bioma Cerrado. Revista Brasileira de Engenharia Agrícola e Ambiental, 11 (1):73-80.
Crossref
|
|
|
|
|
Roth CH (1985). A portable rainfall simulator for studying factors affecting runoff, infiltration and soil loss. Catena 12:79-85.
Crossref
|
|
|
|
|
Santos HG, Jacomine PKT, Anjos LHC, Oliveira VA, Lubreras JF, Coelho M R, Almeida JA, Cunha TJF, Oliveira JB (2013). Sistema brasileiro de classificação de solos. Brasília, Embrapa, 306p.
|
|
|
|
|
Silva IF, Mielniczuk J (1997). Ação do sistema radicular de planta na formação e estabilização de agregados do solo. Revista Brasileira de Ciência do Solo 21:113-117.
|
|
|
|
|
Soil Survey Staff (2010). Keys to soil taxonomy. 12th ed. Washington, DC: USDA-Natural Resources Conservation Service.
|
|
|
|
|
Souza ZM De, Souza GS De, Marques Junior J, Pereira GT (2014). Número de amostras na análise geoestatística e na krigagem de mapas de atributos do solo. Ciência Rural 44:261-268.
Crossref
|
|
|
|
|
Spaccini R, Piccolo A, Mbagwu JSC, Zena Teshale A, Igwe CA (2002). Influence of the addition of organic residues on carbohydrate content and structural stability of some highland soils in Ethiopia. Soil Use Manage. 18:404-411.
Crossref
|
|
|
|
|
Vieira SR, Dechen SCF (2010). Spatial variability studies in São Paulo, Brazil along the last twenty five years. Bragantia 69:53-66.
Crossref
|
|
|
|
|
Vieira SR (2000). Geoestatística em estudos de variabilidade espacial do solo. In: Novais RF, Alvarez VH, Schaefer GR (Eds.). Tópicos em Ciência do solo. Viçosa: Sociedade Brasileira de Ciência do solo pp. 1-54.
|
|
|
|
|
Vieira SR, Millete J, Topp GC, Reynolds WD (2002). Handbook for geostatistical analysis of variability in soil and climate data. In: Alvarez VVH, Schaefer CEGR, Barros, NF, Mello, JWV, Costa, LM (Eds). Tópicos em Ciência do Solo. Viçosa: Sociedade Brasileira de Ciência do solo pp. 1-45.
|
|
|
|
|
Vieira SR, Xavier MA, Grego CR (2008). Aplicações de geoestatística em pesquisas com cana-de-açúcar. In: Dinardo-Miranda LL, Vasconcellos ACM, Landell MGA. (Eds). Instituto Agronômico, pp. 839-852.
|
|
|
|
|
Vieira SR, Grego CR, Topp GC, and Reynolds WD (2014). Spatial Relationships between Soil Water Content and Hydraulic Conductivity in a Highly Structured Clay Soils. In: Teixeira WG, Ceddia, MB, Ottoni, MV, Donnagema, KG (Eds.). Application of soil physics in environmental analyses: measuring, modelling and data integration. New York: Springer pp. 75-90.
Crossref
|
|
|
|
|
Warrick AW, Nielsen DR (1980). Spatial variability of soil physical properties in the field. In: Hillel D, (Ed.) Applications of soil physics. New York, Academic Press pp. 319-344.
Crossref
|
|
|
|
|
Wohlenberg EV, Reichert JM, Reinert DJ, Blume E (2004). Dinâmica da agregação de um solo franco-arenoso em cinco sistemas de culturas em rotação e em sucessão. Revista Brasileira de Ciência do Solo 28:891-900.
Crossref
|
|
|
|
|
Zimback CRL (2001). Análise espacial de atributos químicos de solos para fins de mapeamento da fertilidade do solo. Tese (Livre-Docência em Levantamento do solo e Fotopedologia) - Universidade Estadual Paulista, Botucatu,114.
|
|