ABSTRACT
This study is aimed at assessing ambient air quality in city centres, in Minna metropolis, Niger State, North-Central part of Nigeria. Thirty points of commercial transportation locations within the city centre were considered, three thousand observations of CO, CO2, LEL, H2S and O2 were collected at different West African time (6 am, 8 am, 10 am, 12 noon and 6 pm) during the wet season in 2018 and analysed. Instruments including RKI GX-2009 and BW Technologies GasAlert® Multi-Gas, AMPROBE CO2-100, gas detection instrument with self-calibration capability of ±30 ppm, ±5%rdg (0–5000) accuracy and Garmin CX60 handheld global positioning system were used to obtain the Universal Transverse Mercator coordinates. The results showed higher mean CO2 emission values of > 499 ppm and < 551 ppm. It was also observed that these values were contrary to and exceeded the American Society of Heating, Refrigerating and Air-Conditioning Engineers and Occupational Safety and Health Administration normal outdoor level standards of 350 to 450 ppm. These higher CO2 values were found to have displaced O2 and increased its value to 22.5% above the standard (20.9%). The results also showed emission of H2S in the commercial city centres; if these pollutants are not monitored and controlled they will have adverse effects on human health and impact on the environment. This scenario would be in contrast to the Sustainable Development Goals (SDGs), especially SDG 11. Effective city planning and development control with emphasis on transportation planning, improving the soft landscaping component of the city through planting of trees to sequestrate the CO2 and environmental awareness campaigns by relevant state authorities and non-governmental organisations.
Key words: Air quality levels, carbon emissions, transportation, green-cities, pollution.
There are growing concerns of ambient air pollution in developed and developing countries with more emphasis on the commercial city centres with little or no emphasis on the rural settlements and ambient air quality is now a global challenge. Most developed countries are working on mitigation strategies and policies in reducing ambient outdoor emissions but are challenged with data inventories, funding and technologies in handling mitigation strategies and policies implementation are faced with enforcements. Human habitation and global population are said to be increasing “with the world’s population having crossed the fifty percent threshold of global population, it has become increasingly clear that the future is urban” (UN-Habitat, 2015) with all the attendant consequences. Urban residents are looking at more convenient means of transportation, which has attracted the increasing global concerns on outdoor air pollution. The American Lung Association (ALA) reported in 2018 that nearly 134 million people in United States, which is over forty percent (40%) of the population, are at risk of disease and premature death because of air pollution. Air pollution is attributed to several sources originating from mainly anthropogenic activities (transportation, industries, generating plants, etc.) and natural causes (Abdullahi et al., 2012; Okobia, 2018). These anthropogenic activities remarkably and adversely affected the biodiversity and the functioning of ecosystems and thus affect society (Bradley et al., 2012; Baboo et al., 2017). Biodiversity loss might affect the dynamics and functioning of the ecosystem as well as its surroundings/environment (Bargali et al, 1992a, b, 1993; Joshi et al., 1997), and the supply of goods and services grew dramatically (Gosain et al., 2015; Mourya et al., 2019). To cope with this situation options are being discussed in social and scientific conventions. There are innovations and strategies to create green-cities globally; in rapidly growing cities such as Beijing and New Delhi, air pollution has become so severe that respiratory disease is predominant among residents; “In 2002, for every 100,000 women living in Beijing, 30 had lung cancer; by 2010, that number had also risen more than 50%, to 46” (Larson, 2014). It is observed that these effects emerge from long-term exposures owing to emissions from various sources including transportation, vehicles, trucks, motorcycles, etc., but there are short-term challenges and effects of air pollution, such as sneezing and coughing, eye irritation, headaches, and dizziness (USEPA, 2019). It was further stated that particulate matter smaller than 10 micrometres (classified as PM10 and the even smaller PM2.5 or PM1.0) poses higher health risk, as a result of it being inhaled deeply into the lungs and may cross into the bloodstream (Nunez, 2019). It is a more significant threat to human lives than smoking and even war (Greenstone and Fan, 2018).
There has been several research studies on ways to reduce air pollution but despite decades of progress, the ambient air quality in the United States has started to decline over the past few years, according to data provided in summer 2019 by the United States Environmental Protection Agency; The agency recorded 15% more days with unhealthy air in the country in 2018 and 2017 compared to the average from 2013 to 2016.
In Europe-Ireland, air pollution’s top sources are attributed to transportation and burning of fossil fuels most especially during winter, exceeding the European Union legal limits, it was further observed that transport-related emissions of nitrogen dioxide in urban areas in Ireland are close to the limit while it is consistently exceeding the more strict World Health Organisation (WHO) standards (Malekmian, 2019),
In Minna metropolis, the seat capital of Niger State and headquarters of Chanchaga Local Government Area, the dominant means of transportation is mainly by cars, motorcycles, trucks and tricycles. These means of transportation are powered by fossil fuels and they are said to affect humans through breathing of dirty air, which damages the lungs (Gibbens, 2019). However, research has shown (Saxena et al., 2013) that technical measures alone are insufficient to ensure the desired reduction of air pollution, as they are significant tools of any effective strategy for minimizing vehicular emission. Considering the agrarian environmental characteristics of Chanchaga Local Government Area (LGA), short-lived air pollutants from vehicular emission may also have ripple effects on agricultural produce, as the case in India, where ozone and black carbon, along with the changing climate, cut 2010 crop yields by half (Burney and Ramanathan, 2014). The issue of population growth is another angle to consider, as the 2006 census report data may have doubled or tripled in Chanchaga, causing increasing vehicular logistics that may increase air pollution.
Study area
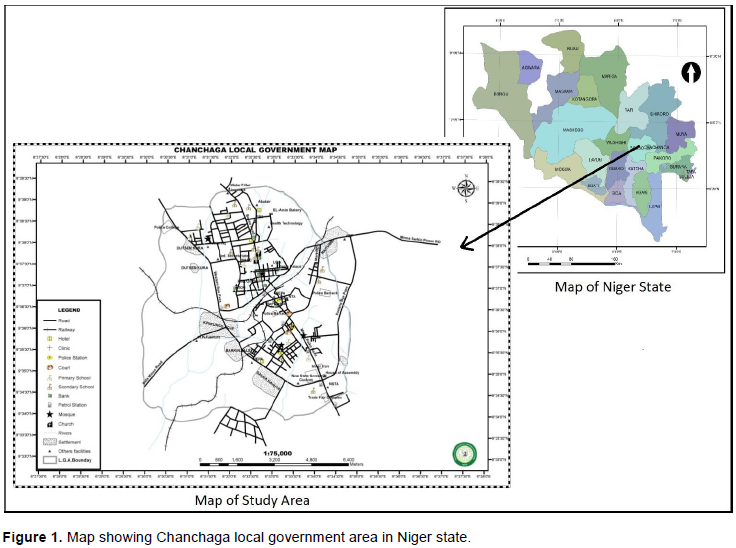
Chanchaga is the Local Government Area (LGA) where Minna the capital of Niger state is located. It is also enclosed by Bosso LGA Council. Niger state is bordered on the North by Kebbi and Zamfara states, to the East by Kaduna state and the Federal Capital Territory to the West by Benin Republic and the South by Kwara state. Chanchaga is located between latitudes 9°30′ to 9°40′ North of the equator and longitudes 6°30′ to 6°40′ East of the Greenwich meridian. Chanchaga LGA the main study area is completely encircled by Bosso LGA. It has a population of 202,151 according to the 2006 Nigerian census report (Federal Government of Nigeria Official Gazette, 2007), an increase of 71.2% compared to 143,896 of the 1991 population census report. Chanchaga LGA is amongst the most developed of the 25 LGA councils and is densely populated. Figure 1 shows the location of the study area.

Climate
The climate of the Chanchaga is hot, humid, and tropical.
It is such that its major elements (temperature, humidity, rainfall, wind speed, etc.) have regimes that are transitional from those of the southern and the northern parts of the country. It has a “mean daily temperature” during the dry season of 38°C during December to March and a “mean daily minimum temperature” of 25°C during the wet season April to October. It is mainly sunny from October to April with a high precipitation of 25 days in the month of August. It has a maximum temperature of 40°C recorded during the dry season, in the months of February to April (Meteoblue, 2019).
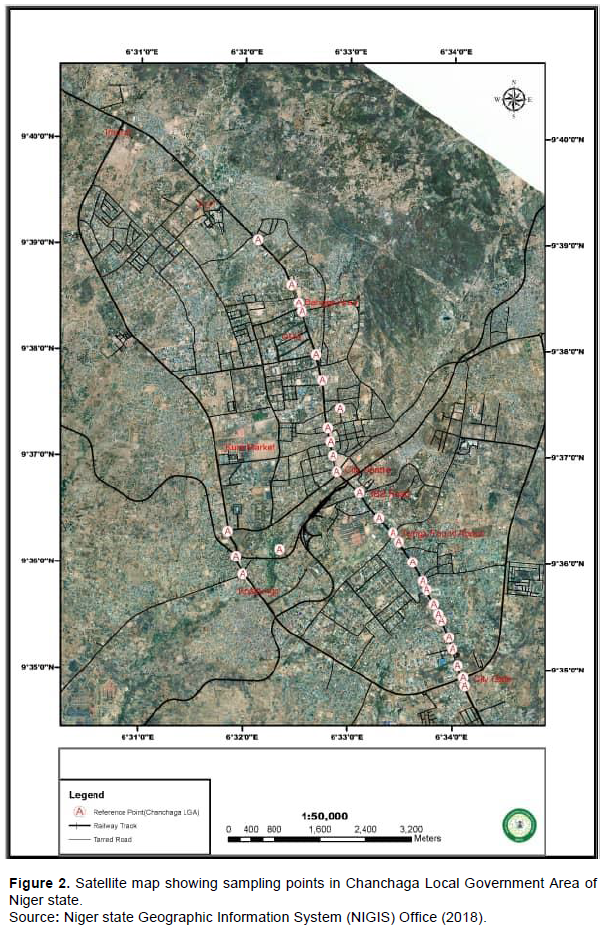
The transportation routes within Minna Metropolis were considered from the Doko International Hotel, city gate in the South to the Northern exit gate and the Western by-pass Kpagungu exit to Bida were considered in the study using a purposive sampling technique to guide the data acquisition. The primary field data (CO, H2S, LEL, O2 and CO2) were acquired in year 2018 within 4 days of the week, during the wet season directly from 30 specific transportation commercial locations in the study area at 6.00 am, 8.00 am, 10.00 am, 12.00 noon and 6.00 pm with 3000 datasets observations. The following instruments were used an RKI GX-2009 Hand-held Multi-Gas monitoring, GasAlert® MicroClip multi-gas monitoring, AMPROBE CO2-100, CO2 gas detection instrument with a self-calibration capability of ±30 ppm ±5%rdg (0–5000) accuracy (which meets European, American, Australian, and Nigerian standards), combined with a Garmin CX60 handheld global positioning system to obtain the Universal Transvers Mercator coordinates of each point. The field observations were done in compliance with local and global regulations. Spatial point data of CO, H2S, LEL, O2 and CO2 readings were collected in the morning, afternoon, and evening, constructively in 2, 4 and 6 h time bands in the Minna commercial metropolitan centre along transportation routes in Chanchaga LGA.
The mean wet season ambient air quality results for Minna metropolis are shown in the geospatial locations map as presented in Figure 2. The coordinates of each emission points and time of data collection are shown in Tables 1 and 2, while the pollutants emission levels, data acquisition times and analyses are presented in Figures 3 to 6. The emission patterns are also discussed in subsequent pages.
Air quality data along transport route in Chanchaga, Minna metropolis
The data were collected along the traffic route in Minna metropolis from the city gate entrance, near Doko Hotel, through the main Paiko road. Table 1 shows the precise locations of the study area, while Table 2 as presented gives details of the mean ambient air pollutants emission levels during the various time intervals from 6.00 am in the morning to 6.00pm in the evening.
Emission patterns of pollutants
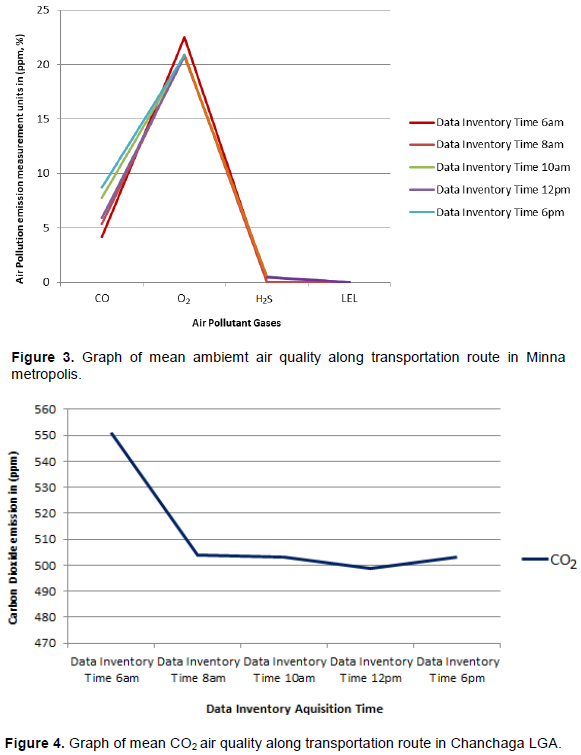
The results of pollutants during the various times reveals their emission patterns. Spot pollution data were obtained and the mean results analysed. The graph in Figure 3 as presented, shows that Low Explosive Limit (LEL) gases were zero (0), which indicated that LEL were not emitted at all locations during the recorded times.
Interestingly, carbon monoxide (CO) emission were consistent during data acquisition at point GTbank (P12). The spot pollution emission values were high at this location at 11 ppm during the 6.00 to 8.00 am data inventory time, 20, 8 and 20 ppm during 10.00 am to 12.00 noon and 6.00 pm data inventory time at GTbank (P12). The locations, where the emission values were highest above standard limits during data inventory time(s) were at the following points: City Gate Minna (P1) - 43 ppm, IBB Roundabout (P13) - 21 ppm, Unity bank (P17) - 33 ppm, (P18), Central Mosque Roundabout (P19) - 25 pm, Sadauna Plaza - 30 ppm, during the 10.00 am data inventory time; 33 ppm during the 12.00 noon data inventory time at point P18, Central Mosque Roundabout; Doko International Hotel Roundabout (P2) - 36 ppm, Kpakungun roundabout (P30) - 20 ppm and GTbank (P12) - 20 ppm during the 6.00 pm data inventory time. The mean emission value of carbon monoxide (CO) were lower than Nigerian Air Quality Standard (NESREA) limit, which is 20 ppm at all time intervals as given in Table 2. This is presented in the emission pattern of Figure 3 with the highest CO value at 8.7 ppm during the 6.00 pm time.
There was variation of the mean oxygen (O2) value from NESREA Limit Standard of 20.9 or 21% during the 6.00 am data interval time. The spot data for O2 were above the standard at these locations P17 to P24 and P27 to P30, resulting in a mean value of 22.5%.
The emission value of hydrogen sulphide (H2S) were obtained at points; City Gate Minna (P1), New Falcon Hotel junction (P9), Star Times office (P11), David Mark Roundabout (P13), Railway Station Roundabout (P15) and Kpakungun roundabout (P30), during the 6.00am, 10.00am, 12.00 noon and 6.00pm data inventory times, from 0.0 to 0.5 ppm, excluding the 8.00am data inventory time.
The mean emission of carbon dioxide (CO2) is presented in Figure 4. The mean emission value was highest in the morning (6.00 am) and lowest during the afternoon (12.00 noon). However, the mean emission of CO2 is above the American Society of Heating, Refrigerating and Air-Conditioning Engineers (ASHRAE) and Occupational Safety and Health Administration (OSHA) standards of 350 to 450 ppm.
The bar chat as presented in Figure 5 shows the emission pattern during the difffrent inventory times. The CO emission was highest during the peak traffic time at 6.00 pm in the evening and lowest in the moring during off-peak time of 6.00 am. Oxygen was highest in the morning during the off-peak traffic time at 6.00 am and above the NESREA Standard of 20.9%. The bar chart also shows that H2S was predominant from the 10.00 am data inventory time until the peak period inventory time of 6.00 pm in the evening, while there was no evidence of LEL emission at all locations during the data inventory times. The mean emission pollutants data as presented in Figure 6 shows that CO2 was the highest pollutants in Minna metropolis, followed by CO and H2S.
The results shows the mean outdoor ambient air quality from 30 different locations within Minna metropolis at different times spaced from 6.00 am in the morning through to 6.00 pm in the evening. The data were aquired along a major transportation route from the Minna city gate through (school, banks, eatery, roundabouts, religious centre, etc.) the commercial centre of the city to the popular Kpakungun roundabout. The emission of CO was lowest (4.16 ppm) in the early hours of the day (6.00 am) and highest (8.7 ppm) during the peak periods but did not exceed the National Ambient Air Quality (NESREA) Limit of 20 ppm. The O2 mean data obtained was highest (22.5%) in the early hours (6.00am) of the morning, while the CO2 mean emission value was highest (551.16 ppm) and above the ASHRAE and OSHA standards of 350 to 450 ppm, also in the morning with H2S mean emission of 0.02 ppm. These results revealed high anthropogenic activities either as a result of people trying to get to work early or travelling outside Minna metropolis. The results further revealed higher emission of CO2 and H2S during the peak periods (10.00 am to 6.00 pm), which is due to motorcycle, vehicular and human activities. The data acquisition results before mean data analyses showed spot pollution with higher emissions at specific locations; City Gate Minna(P1), Doko Int’l Hotel Roundabout (P2), New Falcon Hotel junction (P9), Star Times office (P11), GTbank (P12), David Mark Roundabout (P13), Railway Station Roundabout (P15), Unity bank (P17), Central Mosque Roundabout (P18), Sardauna Plaza (P19) and Kpakungun roundabout (P30). These locations have higher human activities and a higher population, which resulted in the high concentration of pollutants during peak traffic periods.
The outcome of the study shows that more attention needs to be given to urban planinng. It also reveals that population and motorcycles are contributing factors of ambient air pollution in Minna with a mean carbon dioxide emission above the ASHRAE and OSHA standards of 350 to 450 ppm as early as 6.00 am in the morning and throughout the day, which also affects the O2, mean data. It was also observed that H2S was evident in Minna metropolis between 10.00 am in the morning through to 6.00 pm in the evening. The anthropogenic activities observed in the study as sources of emission of pollutants should be addressed by behavioural policy change and enforcement. The traditional urban implemented planning, has to change quickly to addresss the economic and demographic growth, migration, climatic risks, distruptive technologies and social fragmenation (UN-Habitat, 2018). To be able to implement and achieve the New Urban Agenda, cities in developing countries need strategic environmental creative initiatives to reduce the emerging environmental challenges confronting cities such as ambient air pollution. Tree stocks within the urban centre should be increased through deliberate tree planting campaigns by government and a new greener transportation system be introduced to reduce outdoor ambient air pollution.
The authors have not declared any conflict of interests.
REFERENCES
|
Abdullahi ME, Okobia EL, Hassan SM (2012). Assessment of Ambient Atmospheric Concentration of Volatile Organic Compounds in Abuja - Nigeria. Journal of Chemical, Biological and Physical Sciences 2(3):1637-1647.
|
|
|
|
American Lung Association (2019).
View
|
|
|
|
|
Baboo B, Sagar R, Bargali SS, Verma H (2017). Tree Species Composition, Regeneration and Diversity within the Protected Area of Indian Dry Tropical Forest. Tropical Ecology 58(3):409-423.
|
|
|
|
|
Bargali SS, Singh SP, Singh RP (1992a). Structure and function of an age series of eucalypt plantations in Central Himalaya, I. Dry matter dynamics. Annals of Botany 69:405-411.
Crossref
|
|
|
|
|
Bargali SS, Singh SP, Singh RP (1992b). Structure and function of an age series of eucalypt plantations in Central Himalaya, II. Nutrient dynamics. Annals of Botany 69:413-421.
Crossref
|
|
|
|
|
Bargali, S.S, Singh RP, Joshi M (1993). Changes in Soil Characteristics in Eucalypt Plantations Replacing Natural Broad Leaved Forests. Journal of Vegetation Science 4:25-28.
Crossref
|
|
|
|
|
Bradley J, Cardinale, J, Emmett D, Gonzalez A, David UH., Perrings C, Venail P, Narwani A, Mace GM, Tilman D, Wardle DA, Kinzig AP, Daily GC, Loreau M, Grace JB, Larigauderie A, Srivastava DA, Naeem S (2012). Biodiversity Loss and Its Impact on Humanity. Nature 486(7401):59-67.
Crossref
|
|
|
|
|
Burney J, Ramanathan J (2014). Air pollution impacts on Indian agriculture. Proceedings of the National Academy of Sciences 111(46):16319- 16324.
Crossref
|
|
|
|
|
Federal Government of Nigeria (2007). Legal notice on publication of the details of the breakdown of the national and state provisional total 2003 census. Official Gazette No. 24(94):178-198.
|
|
|
|
|
Gibbens S (2019). Air Pollution Robs Us of Our Smarts and Our Lungs.
View Accessed 24/7/2019 10.45hours
|
|
|
|
|
Gosain BG, Negi GCS, Dhyani, PP, Bargali SS, Saxena R (2015). Ecosystem Services of Forests: Carbon Stock in Vegetation and Soil Components in a Watershed of Kumaun Himalaya, India. International Journal of Ecology and Environmental Science 41(3-4):177-188.
|
|
|
|
|
Greenstone M, Fan CQ (2018). Introducing the Air Quality Life Index Twelve Facts about Particulate Air Pollution, Human Health, and Global Policy By, Energy Policy Institute at the University of Chicago.
|
|
|
|
|
Joshi M, Bargali K, Bargali SS (1997). Changes in Physico-chemical Properties and Metabolic activity of Soil in Popular Plantations Replacing Broad Leaved Forests. Journal of Arid Environment 35:161-169.
Crossref
|
|
|
|
|
Larson C (2014). Rates of Lung Cancer Rising Steeply in Smoggy Beijing [online]
View Accessed on 11/8/2019 at 23.03hours GMT
|
|
|
|
|
Malekmian S (2019). Transport and solid fuels remain main source of air pollution [online]
View Accessed 11/08/2019 at 23.39hrs GMT
|
|
|
|
|
Meteoblue (2019). Minna Climate Report
View Accessed 11/5/2019@15:24hrs
|
|
|
|
|
Mourya NR, Bargali K, Bargali SS (2019). Effect of Coriaria Nepalensis Wall. Colonization in a Mixed Conifer Forest of Indian Central Himalaya. Journal of Forestry Research. 30(1):305-317.
Crossref
|
|
|
|
|
Nunez C (2019). National Geographic Climate 101: Air Pollution, [online]
View Accessed 24/7/2019 at 10:51hours
|
|
|
|
|
Okobia LE (2018). Geospatial Ambient Air Pollution Dispersion Analysis in Residential and Commercial Land Use Areas in the Federal Capital Terrritory Nigeria. An Unpublished Ph.D. Thesis, University of Abuja.
|
|
|
|
|
Saxena N, Shrivastava RK, Gautam G (2013). Air Pollution due to Road Transportation in India: A Review of Assessment and Reduction Strategies. Journal of Environmental Research and Development 8(1).
|
|
|
|
|
United Nations Human Settlement Programme (UN-Habitat) (2015). International Guidelines on Urban and Territorial Planning.
|
|
|
|
|
United Nations Human Settlement Programme (UN-Habitat) (2018). Leading Change: Delivering the new Urban Agenda through Urban and Territorial Planning.
|
|
|
|
|
USEPA (2019). United States Environmental Protection Agency.
|
|