ABSTRACT
Sharps waste is part of infectious waste generated in health facilities, management of which is critical. This study aimed at assessing the sharps waste management practices in a referral hospital. The study was conducted at Muhimbili National Hospital (MNH) in Dar es Salaam, Tanzania. Data on sharps waste containers (SWCs) management in generation rates was collected for 60 days, while waste incineration data was collected from 65 randomly selected days. This study gives a picture on how sharps wastes are managed from generation to final disposal. The average weight per used safety box observed in this study (1.54 kg/box) was far above the average weight of a normally filled safety box (0.79 kg/box) indicating that most of the safety boxes are overfilled at MNH. The overfilling of SWCs at MNH was at an average of 10.7% of all the SWCs collected, with a maximum value of 30%, indicating a problem in sharps waste management within the hospital. The sharps waste generation rate observed in a referral hospital (40.8 kg/day) was higher than values reported in district hospitals, but the sharps waste proportion in the infectious medical waste incinerated at MNH was low (at 4% on average). Increasing sharps waste proportion in the waste load increased the incinerator performance in terms of fuel effectiveness. The amount of ash collected from the incinerator per day was observed to be minimal compared to literature data. The final ashes were 5.4% of the total waste loaded, which indicates that the incinerator is more effective in weight reduction, rated at 94.6% efficient.
Key words: Sharps waste, sharps waste container, overfilled safety box, sharps waste proportion, infectious waste, incinerator ash, fuel effectiveness.
This paper presents a study conducted to assess the sharps waste management practices in a referral hospital. The study involved establishment of the sharps waste generation rate and the proportion of the sharp waste in the total infectious waste generated. Moreover, the effect of the sharps waste proportion on the incinerator performance was also studied. The study was conducted in different wards of Muhimbili National Hospital (MNH), located in Dar es Salaam, Tanzania.
MNH generates both infectious waste and non-infectious waste. Among the infectious waste category, sharps waste are the most hazardous because of the ability to puncture skin and cause infection. Sharps waste contain items that could cause puncture wound, cuts which include needles, syringes with needles, broken glass ampoules, scalpel and blades, infusion sets, etc. The sharps wastes are generated by nurses, laboratory technicians and doctors who are parts of waste management teams in the different areas of service delivery or waste generation points.
Sharps waste generated at MNH ranged between 30 and 50 kg while other infectious wastes generated range between 800 and 1000 kg per day based on literature data. Sharps waste is collected in sharps waste containers (SWCs) specifically designed for that purpose. The problem of overfilling the SWCs and mixing infectious waste with non-infectious waste is common at MNH.
Risks associated with over-filling the SWCs include creation of an occupational hazard for clinical staff and for waste management staff, whereby, the chance of needle picks increases during collection and handling, while spreading on the floor causes aesthetic conditions. The medical waste generated is treated by incineration within the premises (onsite treatment). Workers in service delivery areas, scavengers, and the public (specifically the children) are at risk from overfilled SWCs which lead to protrusion of needles and spreading of sharps on floors. Despite the high-tech incinerator (with automatic feeder, temperature control, automatic flame ignition burners, air pollution control device, etc.) the problem of air pollution caused by periodic operational problems of the incinerator (which leads to release of fumes and fine dusts into the surroundings) is also alarming.
Operational problems of the incinerator at MNH include sudden failure of burners and blower before a combustion cycle is completed, which leads to lower combustion temperature and release of toxic fumes, (Santoleri, 1985). Efficient loading of the incinerator include avoiding too much of wet waste in a single batch, proper mixing of sharps with other infectious waste, avoiding overloading the primary chamber, etc. Loading properly segregated waste (rid of food and fruit remains) is also a key performance factor towards improved incinerator performance.
Though sharps waste constitutes a small fraction of the infectious solid waste generated at MNH it can cause morbidity and death due to transmission of blood borne pathogens (BBPs). In this study, the proportion of the sharps waste to the total infectious waste was deter-mined by actual measurements. While former studies on the proportion of sharps waste was earlier determined and reported in district hospitals only (Manyele et al., 2011), this study will improve on this information as it provides data from a referral hospital. The information generated from this study will give an insight into understanding the hazards posed by improper sharps waste management and challenges facing collection, transportation and disposal of SWCs (Khan et al., 2005; Longe and Williams, 2006).
At MNH, the infectious medical waste (comprising of sharps and other waste) is treated by incineration while the non-infectious waste is disposed of in the municipal dumpsite. The hospital has engaged an environmental officer to oversee the safe management and disposal of medical wastes generated within the referral hospital. MNH has an incinerator (Model: Pyrotec No.8) installed with air pollution control devices, temperature control, flame ignition transformer and burners. Loading is carried out by manually filling the waste into a 120 L bin, operated by the machine. The lifting equipment has a maximum capacity of 120 kg, however, the loaded weight range between 70 and 120 kg. The capacity is greater than the maximum load due to the low density of medical waste, whose large volume fills the bin while its weight is low. In some cases, the bin is not filled to capacity due to fixed weights of waste bags which cannot be opened, leading to loads of down to 50 kg only. The machine produces pollution and choking smell due to type of wastes incinerated, for example plastic materials, drinking water bottles, catheters, infusion sets, waste bags and sharps waste, although the chimney is at a recommended height.
The main objective of this study was to assess the sharps waste management practices in a referral hospital. Specifically, the following key components of the sharps waste management were assessed: procedures and guidelines, sharps waste components, characteristics of SWCs used for waste collection, management of SWCs, sharps waste generation rate, treatment method for sharps waste. Moreover, the final ash disposal after treatment was also assessed. Statistical analysis (using histograms and linear graphs) were used to express the results.
Effective sharps waste segregation at the generating area and use of proper waste containers provides a most effective safeguard against the hazardous effects of sharps waste (Blenkharn and Odd, 2008). Disease transmission from used sharps to healthcare workers or patients requires critical attention during management of the sharps waste (Allsopp et al., 2001). Proper management of sharps prevent HIV and other infectious diseases from being transmitted from patients to health service providers. Improved engineering controls to minimize needlestick injuries (NSI) include safety locking devices that prevent needle re-use and sharps disposal containers that deter access of contents. This study assessed utilization and management practices of sharps safety disposal containers in a referral hospital.
While incineration performs high temperature decontamination and destruction of infectious medical waste, sharps waste effectively decontaminated using other methods, such as, steam autoclave or microwave irradiation, can be disposed of in special areas in the landfills. The acceptable treatment method in Tanzania according to the National Healthcare Waste Management Guidelines is incineration at high temperature based on cost consideration, efficacy of treatment method, skills requirements and availability of technology. Despite wide acceptance of incineration method, the fumes generated from incineration of sharps waste can be hazardous to human health if not well treated. Treatment methods for such fumes include combustion at higher temperature in the secondary chamber (800-950°C) and connecting wet scrubbers to the chimney for acid-gas removal (Santoleri, 1985; Powell, 1987; Singh and Prakash, 2007).
Sharps waste collection in hospitals is done by using SWCs. Such containers must conform to safety performance characteristics, which are divided into four areas, namely: functional, accessible, visible, and accommodation. Containers should remain functional during their entire usage time, that is, they should be designed to permit safe disposal of sharps. The SWCs should be durable, closable, leak proof and puncture resistant until disposal. They should be simple and easy to operate. The disposal opening should prevent spills of the contents while in use, during closure and during transportation of the waste within the health facility before treatment. In all areas where sharps are used, a sufficient quantity of containers should be available in the appropriate size. At minimum, one sharp container should be provided at each working station where sharps are predictably generated, so as to minimize the possibility of overfilling the SWCs, which would compromise the safe operation of the container.
Containers should be visible and accessible to workers who use, maintain, or dispose sharp devices. The SWCs should be placed in a location to ensure they are visible and within easy horizontal reach of the user. Where containers are fixed to the walls or other permanent sites, the vertical height should allow the health service providers (HSP) to see the opening of the container. The SWCs should be placed in an area that is unobstructed by obstacles between work station and the container. Unsafe locations may force workers to make unneces-sary movement while holding a used sharp that may result in injuries. Workers should be able to see the degree to which the container is full before sharps are placed in the container.
Sharps waste must be discarded at the point of use into SWCs. The latter should be sealed when full to avoid NSI (Henry and Campbell, 1995; Geberding, 1997). Improperly designed (provisional) and overflowing SWCs increase the risk of exposure to health workers, waste handlers and the community at large. Safe disposal of healthcare waste improves working conditions, reduces pollution and accidental injuries, increases public safety and reduces the chance of transmission of infectious diseases (Environment Canada, 2011).
According to a study reported by Manyele and Kagonji (2012), the district hospital incinerator at Temeke hospital was used to treat medical waste containing 25% sharps waste, the rest being other waste. During primary combustion process, some of the products of combustion are given off as combustible gases such as carbon monoxide. When combustible gases reach the secondary combustion chamber an additional supply of air to facilitating final combustion in the secondary chamber is supplied using burner and blower combination. The incoming gases burn and raise the secondary chamber temperature even higher, and reduce the gases to more stable compounds such as carbon dioxide. The waste composition fed into the MNH incinerator is not always the same. It was hypothesized that the amount of waste and composition contributes to the incinerator performance. In this study, the effect of the proportion of sharps waste on incinerator performance was studied.
Most of incineration plants can be operated in 24 h a day, whereas the incinerator at MNH operate for only 8 h per day due to nature of waste incinerated and fuel consumption costs. Fuel control is an important area to consider during incineration of medical waste containing sharps waste. High fuel consumption occurs when burning extremely moist waste or when there is a lot of air added to the system. For example, a placenta’s moisture must be evaporated before volatilization can occur. Since no heat can be released from such waste until it start to volatilize, the primary burner must supply extra energy, thus leading to higher fuel consumption than for dry waste. To reduce fuel consumption, the high moisture load must be reduced or mixed with more sharps waste to create quick combustion (Manyele and Kagonji, 2012). In case excessive moisture enters secondary chamber during incineration, the temperature will drop and the burner will need to operate much longer.
Air pollutants result from combustion constituents. This includes unburnt carbon, carbon monoxide, hydrocarbons, aldehydes, amines, organic acids, polycyclic organic matter and any other waste constituents or their partially degraded products that escape. Organic pollutants emitted as a result of incomplete combustion of waste material are often generated in the primary combustion chamber operating at low temperature. The control of the emission of these organic pollutants can be handled by continued combustion at high temperatures using afterburners (also termed secondary combustion chambers).
During incineration process, sharps waste plays a big contribution on the maximum temperature in the combus-tion chambers. This leads to effective destruction of organic waste into inorganic ashes, and hence high effi-ciency in terms of weight reduction and fuel effective-ness. The higher the temperature in the combustion chambers the shorter the incineration cycle time and the higher the fuel effectiveness (kg waste/L of diesel oil).
The final ash is removed daily after incineration and left to cool before transporting to the municipal dumpsite for final disposal (Giradakos et al., 2009; Zhao et al., 2010). Characteristics of incinerator ash are inherently related to the specific source and character of the waste fed to the incinerator. The dominant elements present are silicon, aluminium, iron, and calcium, much as normal soil (Walter, 2002), however, due to presence of sharps waste, in the incinerated waste, un-burnt sharps waste become visible, including broken glass, metals, un-burnt needles, and gravel/stones, indicating poor segregation of the waste at the source.
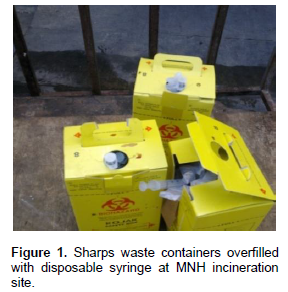
The study was conducted in a referral hospital located in Dar es Salaam city, in Tanzania, by assessing the sharps waste management practices, from initial disposal into SWCs to transportation and incineration, and ultimately to dumpsite after treatment. Data was collected starting with sources of sharps waste. The initial disposal of sharps waste was assessed by determining the fraction of the SWCs filled beyond the ¾-fill level (denoted as overfilled SWCs). The sharps waste generation rate was established based on needle and syringe consumption as well as from direct measurements of weight of each used SWC (kg/box). Figure 1 shows the type of safety boxes used in this study.

The number of SWCs used per day (normal filling and overfilled) was recorded, followed by determination of weight per safety box . The SWCs were collected from Sewaji, Kibasila, Mwaisela, Pediatric and Labour wards only, although the hospital comprise of several other patient treatment wards. Collected SWCs were stored tempeorarily at the incinerator house before treatment. The waste load comprised of sharps waste and other infectious waste, both categories of infectious waste were weighed separtely to determine the total waste loaded into the incinerator, and also to determine the composition of the waste load, that is the fractions of sharps waste and the other waste. During incineration the total incineration time (called cycle time), maximum temperatures reached and fuel oil consumed were recorded. After incineration, the ash was collected and weighed before final disposal to determine the ininerator efficiency in terms of weight reduction. In this study, data was collected for a period of 65 randomly selected days. Each load was recorded separately, and quantities totalled for the selected period. In this study daily quantities were determined, although weekly and monthly amounts can also be determined.
The daily sharps waste management data collection included number of SWCs used and collected, filling conditions (normal and overfilled SWCs), weight of each safety box collected, weights of sharps waste and other waste loaded into the incinerator for each cycle. The sharps waste components were mainly disposable syringes and needles. Incineration data included combustion temperatures for primary and secondary chambers, cycle times, ash generated, and fuel consumption per day. The composition and proportion of sharps waste were determined from the measured weights of sharps and other waste designated for incineration. Qualitative methods included: site visits, interviews and review of documents including guidelines and procedure. Data was managed with MS Excel. After cleaning, data was then transferred directly into SPSS for analysis using descriptive statistic and focusing on frequencies. The output contains graphical presentations (histograms, linear graphs and pie charts), as shown in Figures 2 to 6.
Based on the total weight of loaded waste into the primary chamber, and weight of sharps waste, the mass fractions of sharps and other waste, Y and X, respectively were determined. The fuel effectiveness, defined as total waste incinerated per litre of diesel oil consumed, forms an assessment criteria for incinerator performance which represents moisture content and composition, burner efficiency, cycle time, burner efficiency, cycle time and chamber size. Another measure of incinerator performance was the waste destruction efficiency, which was determined based on weights of ashes collected and the loaded waste. The ash was left to cool completely before loading into special plastic bags ready for transportation to the municipal dumpsite for final disposal. Assessment of treatment method for sharps waste included detailed analysis of the incineration process (such as weighing and loading of waste, temperature profiles, and incineration time), maximum temperatures reached, and incineration cycle time.
Sharps waste generation rate
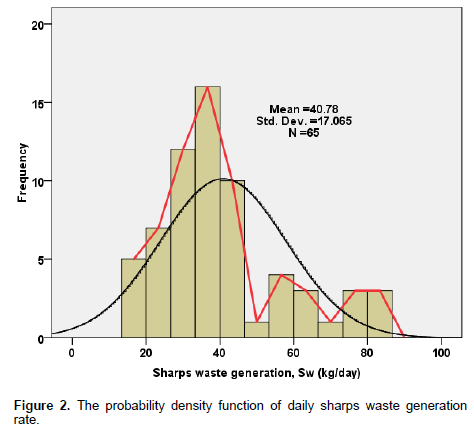
The sharps waste incinerated were collected from all generation locations within MNH. For the purpose of SWCs characterization (overfill percent and weight per safety box), data was collected from five wards. According to this study, the Labour ward generates highest amount of sharps waste followed by Paediatrics ward. Figure 2 shows the histogram of the daily sharps waste incineration rate (in kg/day) recorded for 65 days. All sharps waste generated at MNH is incinerated so that sharps waste generation is the same as sharps waste incinerated. The overall average sharps waste generation rate was established to be 40.8 kg/day, with wider daily variations between 10 and 90 kg sharps waste per day. Higher values of sharps waste generation observed indicates days with high demand on medical services due to emergency cases referred to MNH from Temeke, Amana, Mwananyamala and private hospitals located within the city and from the surrounding districts.

Together with measuring the sharps waste generated by weighing SWCs before and loading into the incinerator, the generation rate was further analyzed based on needles and syringes consumed in the referral hospital. The SWCs were being supplied from Medical Store Department (MSD) at approximately 1000 boxes/month while the disposable syringes with needles amounted to 55,000 pieces per month. Syringes of different sizes (2, 5, 10, 20, and 50 ml are used in the hospital at varying amounts and in this order of preference, with a total consumption rate of about 45,730 pieces per month.
Distribution of total consumption of syringes by size in the surgical stores, for example, in the period of three months, indicted that 5-mL syringes are the most used sizes (42% of the time) followed by 2, 10, 20 and 50 mL, at 32, 18, 5 and 2%, respectively. Knowledge of syringe sizes is important as some of the applications could be combined to minimize the consumption and waste generation rate. When the rate of syringes consumption is too high, it leads to high consumption rate of SWC, high demand for collection of SWCs and hence overfilling of the SWCs.
Sharps waste segregation
During the study, it was observed that sharps wastes are segregated from other infectious waste immediately after use. The sharps wastes are collected using a puncture proof container placed in each ward or clinic. Written standard operating procedures for handling sharp are not available in most areas putting the health service providers at risk of injury by sharps (Malkan, 2005; Almuneef and Memish, 2003). The sharps waste management booklets (English and Swahili version) from Ministry of Health and Social Welfare (MoHSW) aimed at providing guidance to the health service providers are available to each ward in-charge but not accessible to other members of staff. During an interview, the hospital management reported that they provide training to patients every day regarding waste segregation, so that patients do not mix the waste with remaining food materials, although adherence is minimal.
Filling level and weight of SWCs
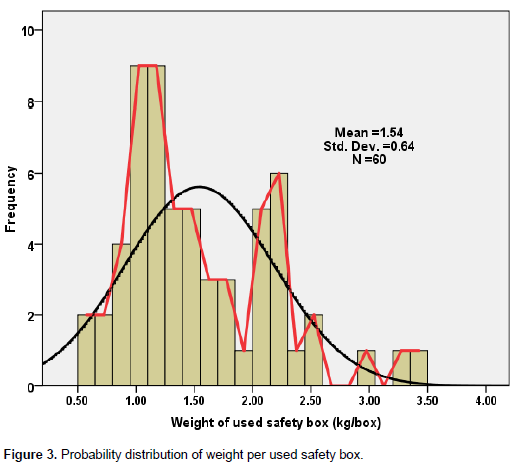
Figure 3 shows the histogram of the weight of the used or filled safety box. Several boxes were measured per day from which the average weight was recorded for a period of 60 days. The average weight per box when filled to ¾-level is about 0.79 kg while the average weight of overfilled sharps waste container based on overall data was determined to be 1.54 kg, indicating that a large number of safety boxes are filled beyond the mark. The histogram shows a bimodal behaviour, with peak frequencies at 1.1 and 2.2 kg per box, all peaks being in the weight range comprising of overfilled safety boxes. The causes of higher weight per safety box were attributed to the density of the materials dropped into the box and delays in collection of safety boxes from the service delivery areas.

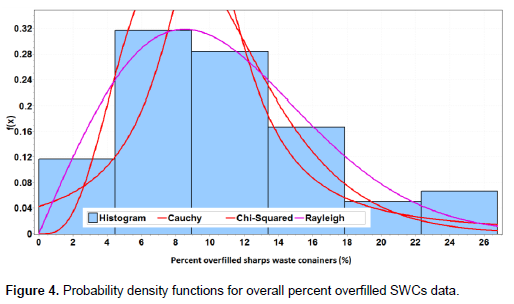
Higher values of the weight per used safety box (beyond 0.79 kg/box) are an indication of the overfilled safety boxes. By using the filling level mark as the criteria for overfilled boxes, it was possible to establish data for the average percent overfilled safety boxes in different areas of MNH. When assessed based on SWCs collected from the wards, the results indicated that Pediatrics, Kibasila and Mwaisela wards had highest percent of overfilled SWCs (at 19.0, 15.6 and 11.4%, respectively). This was followed by Sewaji ward (10.8%) and Labour ward (6.6%). The highest average overfill rate was observed in the Paediatrics ward (19%). Further analysis of overfilled SWCs revealed that the mean percentage is 10.7% of all SWCs (with standard deviation of 6.25%). The data shows a lower right hand side skewness (Sk = 0.62), indicating that high percent overfilled SWCs exist within MNH for some days. Figure 4 shows the probability density function of the percent overfilled SWCs data, which was closely fitted using Rayleigh, Chi-Squared and Cauchy probability distributions (in this order of goodness of fit), out of 56 distributions tested using Easy-Fit software. The overall percent of overfilled SWCs reached the highest value of 30% when all the SWCs collected from the five locations were assessed.
The Rayleigh distribution function with a sigma parameter s = 9.1076 and statistic value of 0.09144 was ranked first in describing the probability distribution of the percent overfill data. The fact that Rayleigh fits data with two degrees of freedom, two normally distributed orthogonal components or a distribution with added harmonic oscillations, indicates that there are two main factors leading to the observed overfilling of SWCs. Detailed research is required to establish these factors.
Sharps waste as a fraction of total infectious waste generated
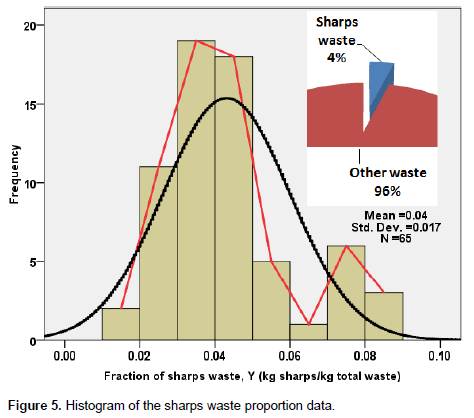
Figure 5 shows the probability density function of the sharps waste proportion data. The average proportion was established to be 4%, with the data slightly skewed to the right hand side. The sharps waste proportion data ranged from 1.5 to 9%. The results show that there are no cycles which were operated without sharps waste. However, very low sharps waste proportion shows scenarios where the sharps waste were being collected while the incinerator is already operating, and cases where the waste bags were very voluminous allowing only little sharps waste to be added. An insert in Figure 5 is the pie chart showing the average proportion of the incinerated waste at MNH for the collected data from 65 combustion cycles which shows that 4% comprised of sharps waste and 96% other infectious waste.
While the percentage of infectious waste that ought to be incinerated vs. the non-infectious waste transported to dumpsite is quite interesting, this study focussed on collection of infectious waste which is incinerated despite that other non-infectious waste is also generated at MNH. The total infectious waste generated is about 10 tons per day, compared to 0.945 tons per day of infectious waste loaded into the incinerator. Thus, infectious waste generated at MNH is about 8.63%, the remaining being non-infectious. Since the sharps waste is only 4% of the total infectious waste, it implies that the sharps waste comprise of 0.35% of the total waste generated.
Effect of sharps waste proportion on the incinerator efficiency
In this study, the incinerator efficiency was measured based on combustion and destruction efficiency (determined from the fraction of the waste loss after combustion) and fuel effectiveness (defined as the kg waste incinerated per liter of fuel oil used, kg/L). Based on literature data, the destruction efficiency ranged between 85 and 98% (Manyele et al., 2011). In this study, however, the destruction efficiency was 94.6%, and ranged between 91 and 98%. This is higher compared to literature data. A second measure of efficiency of the incinerator, the fuel effectiveness was also determined based on daily incineration data. The values of fuel effectiveness for the MNH incinerator were lower, ranging between 2.5 and 3.0 only, compared to values reported for small scale incinerator of similar capacity (kg/h) which was about 2.5 to 5.5 (Manyele et al., 2011).
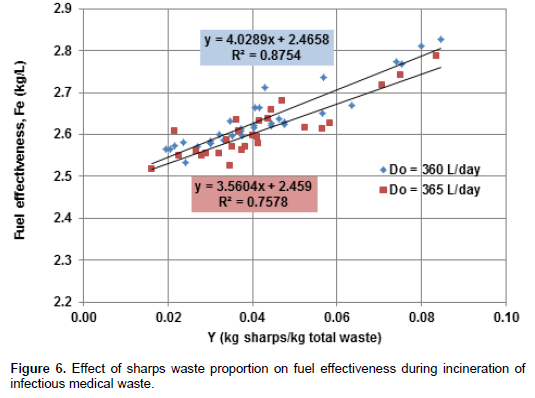
Figure 6 shows the effect of sharps waste proportion on the fuel effectiveness during incineration of infectious medical waste. Increasing Y (%) increases the fuel effectiveness or kg waste burnt per liter of diesel oil. While other studies focussed on the variation of fuel effectiveness with total waste incinerated and incinerator capacity, this study established the relationship between sharps waste proportion in the waste load and the fuel effectiveness. Two linear relationships were observed based on diesel oil consumption rate. At a diesel consumption rate of 360 L/day, higher values of fuel effectiveness were observed compared to the values observed at higher fuel consumption rate. Higher fuel consumption rate of 365 L/day corresponds to operations where burners were faulty leading to stoppage for service. Despite the lower fit (indicating that fuel effectiveness is also affected by other factors), the general trend shows that fuel effectiveness increases with sharps waste proportion. Other factors affecting the fuel effectiveness include moisture content in the waste load, poor segregation at the source, poor burner performance, etc.

The relationship between incineration cycle time on medical waste incinerated was also assessed. The more the other waste loaded into incinerator the longer the incineration process took place and the more the fuel consumption as reported also by Manyele and Kagonji (2012). Moreover, with lower sharps waste proportion in the loaded waste, thicker flue gas was produced requiring intensive scrubbing operation in the air pollution control devices (APCD). For a cycle with only other waste loaded it took 45 minutes to be destroyed. However, if sharps waste are introduced, the cycle time decreases to 25 minutes depending on the amount. Higher cycle times lead to more fuel consumption which in turn increases the running cost for the incinerator.
Final ash disposal
Final ash disposal after treatment was assessed by determining the daily quantities of ash collected and final disposal methods used. Results show that the average amount of bottom ash collected from the incinerator was 51.2 kg with a standard deviation of 14.2. The bottom ash collected ranged between 20 - 90 kg/day. On average, the ash generated was about 5.41% of the total waste incinerated per day, indicating that 95.59% was converted into gaseous byproducts. Thus, based on ash collection data, the incinerator efficiency (based on weight reduction) ranged between 90 and 98%, with average of 96.6%.
The reasons for overfilled SWCs observed include lack of enough containers in service areas, especially during weekends where containers are not issued. Also, in areas or times when waste handlers could not remove the containers in time according to the waste collection timetable, SWCs were overfilled. In some instances, the SWCs are left in service areas throughout the day and the waste handlers perform SWCs collection during night due to shortage of staff. The study revealed that overfill of SWCs occurs at Paediatric ward as it is always busy with a large number of patients from public district hospitals and private hospitals being referred to MNH for further treatment. Although the average SWCs overfill rate (10.7%) is low, this indicates safety hazard for anyone handling the containers as it can lead to needlestick injuries disease transmission and spread of waste on the floor.
Despite of higher genration of sharps waste for some days studied, all of the sharps waste was being incinerated. There is, however, a lack of appropriate sharps waste compartments in the storage bay, which leads to mixing of wastes after collection. The WHO recommends storage rooms for sharps waste of which unauthorized person are not allowed to enter, inaccessibility to animals, insects and birds, with enough ventilation. The storage rooms at MNH are not standard, allowing scavengers’ to mix the sharps waste with other infectious waste. Moreover, appropriate sharps waste transportation trolleys are required at MNH. This will decrease the chances of injury for waste handlers due to protruding sharps during collection, transportation and loading into the incineration.
The factors determining the fraction of the sharps waste incinerated are amounts of other waste generated, sharps waste collection efficiency and loading preference by incinerator operators. The last two factors can be easily controlled during the waste management processes. As reported in the literature, the higher values of the sharps waste proportion increases the waste combustion efficiency due to faster volatilization of the plastic components of sharps waste. Thus, during loading of the waste into the combustion chamber, the sharps waste should be evenly distributed over all the waste incineration cycles carried out.
The variations in this fraction of infectious waste are important as it determines safety precautions during loading and destruction efficiency (combustion assistance of plastic materials and sharp objects remaining in the bottom ash). Moreover, studying the generation rates for sharps waste helps the hospitals in planning and directing proper human and financial resources in the management of the waste. When there is more sharps waste, the temperature will rise sharply and reach the highest value faster compared to cycles with lower proportion of sharps waste because the latter contains large amount of plastic which support burning at high temperatures. Other waste also contributes in attaining temperatures in both primary and secondary chambers, whereby, large quantities loaded lead to high maximum temperatures, but takes longer time to undergo complete destruction.
It has been established that the average proportion of sharps waste incinerated was 4% of the total waste, which is on the lower side compared to literature data, which can be associated with lower fuel effectiveness presented in Figure 5. Increasing the sharps waste proportion in the incinerated waste was observed to increase the fuel effectiveness with a linear relationship. However, its effect on maximum temperatures in the primary and secondary combustion chambers of the large scale incinerator requires further research. The values of sharps waste proportion observed in the referral hospital were lower compared to values reported in district hospital, mainly because the generation of other waste in the district hospitals is lower compared to referral hospital. This is because, while district hospitals were observed to generate 24.41 kg of sharps waste per day and other waste of 73.56 kg/day (Manyele et al., 2011), on average, the referral hospital generates 40.78 kg/day sharps waste and 945 kg other waste per day.
The results from this study have revealed sharps waste management aspects that are being well performed and aspects that need improvements. The aspects being well performed include incineration of all the sharps waste generated, which implies total decontamination and destruction. Also, waste collection efficiency is high and collection is well performed, such that all generated sharps waste reaches the incineration room. However, sharps waste management in the areas of generation should be improved by observing the filling lines, improving segregation, while storage bay and sharps waste transportation equipment require improvements in the referral hospital.
From the observation made on the ash contents, it was revealed that needles, surgical blades, blood slides, vacutainer tubes, vial bottles, ampoules are not completely destroyed though they are sterilized and denatured (Zhao et al., 2010). Thus, care should be taken when removing ashes in this case.
This study gives a picture on how sharps wastes are managed from generation to final disposal in a referral hospital. Based on the results, the following conclusion can be made:
1) The average weight per used safety box observed in this study (1.54 kg/box) was far above the average weight for a safety box not overfilled (0.79 kg/box) indicating that most of the safety boxes are overfilled at MNH and/or there are signs of poor segregation at the source.
2) The overfilling of SWCs at MNH is at an average of 10.7% of all the SWCs collected, with a maximum value of 30%, indicating a problem in sharps waste manage-ment within the hospital, which requires attention by the MNH management. Areas observed to overfill the SWCs include Pediatrics, Kibasila and Mwaisela wards, which should be supported by supplying enough containers followed by implementation of the standard operating procedures.
3) The sharps waste generation rate observed in a referral hospital (40.8 kg/day) was higher than values reported in district hospitals. Within the MNH, the highest generation rates were observed in the Pediatric and Labour wards, which are still manageable by MNH.
4) Sharps waste proportion in the infectious medical waste incinerated at MNH is low (at 4% on average). Increasing sharps waste proportion in the waste load increases the incinerator performance in terms of fuel effectiveness.
5) The amount of ash collected from the incinerator per day was observed to be minimal compared to literature data. While final ashes are reported to be 10% of the total waste, this study revealed a value of 5.4%, which indicates that the incinerator is more effective in weight reduction, rated at 94.6%.
The authors have not declared any conflict of interests.
REFERENCES
|
Allsopp M, Costner P, Johnston P (2001). State of Knowledge of the Impacts of Waste Incinerators on Human Health. Environ Sci. Pollution Res. 8(2): 141-145.
Crossref
|
|
|
|
Almuneef M, Memish ZA (2003). Effective medical waste management: It can be done. Am. J. Infection Control 31(3):188-192.
Crossref
|
|
|
|
|
Blenkharn JI, Odd C (2008). Sharps Injuries in Healthcare Waste Handlers. Ann. Occup. Hyg. 52(4):281-286.
Crossref
|
|
|
|
|
Environment Canada (2011). Technical Document for Batch Waste Incineration,
View.
|
|
|
|
|
Geberding JL (1997). Accidental Exposure to blood and body fluids among health care workers in dental teaching clinics: a Prospective study. New England J. Med. 312(1):58-59.
|
|
|
|
|
Gidarakos E, Maria P, Kalliopi A, Karl-Werner S (2009). Characterization and Hazard Evaluation of Bottom Ash Produced from Incinerated Hospital Waste. J. Hazard. Mater. 172(2-3):935-942.
Crossref
|
|
|
|
|
Henry K, Campbell S (1995). Needle stick/Sharps injuries and HIV exposures among Health care workers: National estimates based on a survey of U.S. Hospitals. Minnesota Med.78:1765-1768.
|
|
|
|
|
Khan MH, Khan H, Basit A, Ikram-ullah M, Babar TS, Habib H (2005). Sharps waste disposal practice among General Practitioners. Gomal J. Med. Sci. 3(1):2-5.
|
|
|
|
|
Longe E, Williams A (2006). A Preliminary Study of Medical Waste Management in Lagos Metropolis, Nigeria. Iranian J. Environ. Health Eng. 3(2):133-139.
|
|
|
|
|
Malkan, S (2005). Global Trends in responsible healthcare waste management-A perspective from Health Care without Harm. Waste Manage. 25:567-572.
Crossref
|
|
|
|
|
Manyele SV, Kagonji IS (2012). Analysis of medical waste incinerator performance based on fuel consumption and incineration cycle times. Engineering 4(10):625-635.
Crossref
|
|
|
|
|
Manyele SV, Kagonji IS, Mrisho J (2011). Assessment of medical waste incinerator performance based on physical characteristics of ashes. Eng. J. 3(10):1045-1053.
Crossref
|
|
|
|
|
Powell F (1987). Air pollutant Emissions from the Incineration of Hospital Wastes-The Alberta Experience. J. Air Pollution Control Assoc. 37(7):836-839.
Crossref
|
|
|
|
|
Santoleri JJ (1985). Design and Operating Problems of Hazardous Waste Incinerators. Environmental Progress 4(4):246-251.
Crossref
|
|
|
|
|
Singh S, Prakash V (2007). Toxic Environmental Releases from medical waste Incineration. A Review, Environmental Monitoring 132:67-81.
Crossref
|
|
|
|
|
Walter R (2002). Combustion and Incineration Processes, 3rd Edition, Marcel Dekker, New York, 2002.
|
|
|
|
|
Zhao LJ, Zhang F-S, Chen MJ, Liu ZG, Wu JZ (2010). Typical Pollutants in Bottom Ashes from a Typical Medical Waste Incinerator. J. Hazard. Mater. 173(1-3):181-185.
Crossref
|
|