ABSTRACT
The process of modeling contaminant volume, rainfall intensity, and soil depth was investigated on diesel leaching and retention in soil subjected to oil pollution from five Base Transceiver Stations. The experimental runs were carried out over three operating parameters which include contaminant volume (50-350 ml), rainfall intensity (5- 10 mm/h), and soil depth (30 - 90 cm) using Response Surface Methodology. Among all variables, soil depth and rainfall intensity significantly influenced the diesel leaching rates. According to results that were found out via ANOVA, the model was fitted to the experimental data with high coefficients. Furthermore, using the statistical modeling approach, the rates predicted via RSM were estimated by varying the contaminant volume at 10 ml, rainfall intensity is 7.5 mm/h; soil depth yielded 54.3 cm while the amount of diesel leached and retained gave 5958.8 mg/L and 3682.5% respectively at the desirability of 1.00. However, at a soil depth of 30 cm, contaminant volume was found to be 50 ml, rainfall intensity is at 10 mm/h to obtain maximum diesel leaching rates, and the amount retained in the soil. The model was validated by computing the %error, which ranges between 0.04 and 8%. This indicates that the model can be implemented.
Key words: Diesel leaching, soil pollution, organic pollutants.
This study is conceived out of the challenge faced by telecommunications companies from litigations and regulatory sanctions due to contaminations arising from maintenance activities at base transceiver stations (BTS) sites. Telecommunications companies have made huge investments in providing power at (BTS) sites to serve growing customers (Olukolajo et al., 2013; Patti and Siana, 2016). Diesel in soil has been known to contain Polycyclic Aromatic hydrocarbons (PAHs) and Polychlorinated Biphenyls (PCBs). Polycyclic aromatic hydrocarbons are persistent organic pollutants (POPs) that are resistant to degradation, remain in the environment for longer periods (Venkata et al., 2009), and have the potential to cause adverse environmental effects (Kordybach, 1999). PAHs have unique stable structures that persist in the environment (Sugiura et al., 1997) and highly hydrophobic, so these have a strong attraction to soil particles (Sung et al., 2001). PAHs have been proven to contain compounds that affect underground water negatively. These compounds include xylene, toluene, and benzene. The process of utilizing these products associated with human mismanagement leads to the spill of these products in the environment in and around many BTS sites (Aderoju et al., 2014). These compounds are harmful to aquatic life and by extension, humans. The consumption of aquatic products contaminated with the aforementioned compounds can lead to adverse health concerns that could result in organ failures, cancer in humans, and even death. It has also been proven that PAHs also inhibit plant growth by increasing soil PH and impeding the adequate flow of oxygen in the soil. The contaminants generated during generator maintenance cycles at BTS sites have proven to be harmful and toxic (Peter and Tien-Chien, 2018). This limitation of aerobic activities in the soil affects the growth of crops and plants thereby adversely affecting food generation and life sustainability in the impacted environment. Oil products, including petrol, not only modify the physico-chemical and biological properties of the soil but also contribute to limitations of the productive ability of arable crops (Wyszkowska et al., 2002). It is worthy of note that the source of petroleum products is crude oil. Crude is refined to get different petroleum products and by-products. These products are made through very complex mixtures of hydrocarbons. However, when these petroleum products are spilled onto the environment, there occur changes due to the action of sunlight and weather which breakdown its components. The analysis of the impact of the leaching rate of spilled diesel and waste engine oil on the environment can be done by analyzing total petroleum hydrocarbons (TPH). The changes in the TPHs are because of leaching of the petroleum hydrocarbons. As the hydrocarbons find their way into the soil, they change in form. The changes can be due to biodegradation of some of the compounds or in some cases as they volatilize. EPA (2017) noted that aerobic biodegradation is very effective in soils that are relatively permeable to allow the transfer of oxygen to subsurface soils where the microorganisms are degrading the petroleum constituents. However, not all petroleum products leach into the environment. Some are non-mobile and remain on the surface of the soil. The components that volatilize or remain on the surface of the soil are less harmful or impactful than those that leach into the soil. The latter are those we are more concerned with as they are most likely to impact soil quality, texture, and at times, underground water. Design of experiment and response surface methodology (RSM), as a statistical analysis technique, is a widely used methodology for analysis and optimization of the application of different factors or treatment technologies in the oil spill process (Sharma et al., 2009; Zahed et al. 2010). For instance, Mohajeri et al. (2010) employed RSM to optimize oil concentration biomass, nitrogen, and phosphorus concentrations in bioremediation of crude oil sediment samples during 60 days trial period, obtaining 83% removal under the optimum conditions.
Given this, the present study seeks to investigate the conditions in which the independent variables, contaminant volume, rainfall intensity, and soil depth influences the amount of diesel leached and retained in soil subject to pollution from diesel generators at BTS site.
Description of the study area
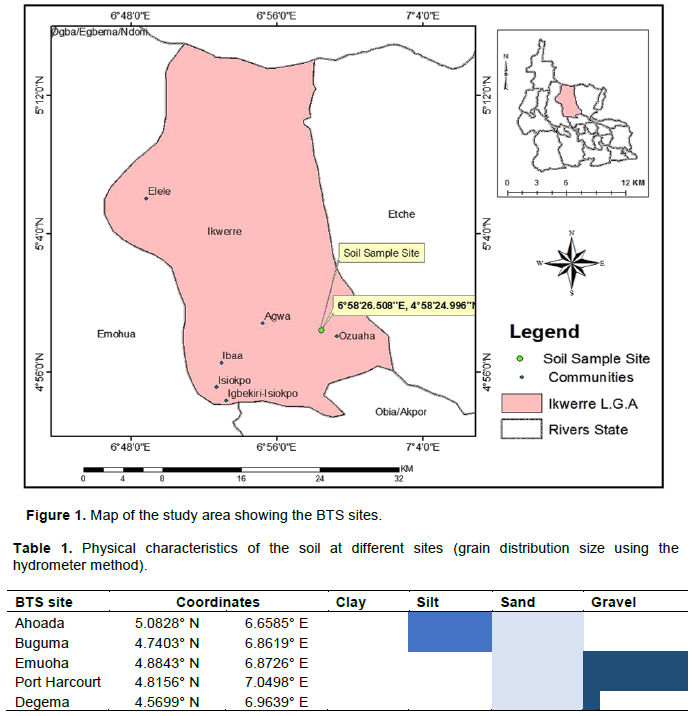
Rivers State is one of the 36 states of Nigeria located between 6°58’26.508” E, 4°58’24.996” N. According to census data released in 2006, the state has a population of 5,198,716, making it the sixth-most populous state in the country (Mohajeri et al., 2010). Its capital and largest city, Port Harcourt, is economically significant as the center of Nigeria's oil industry. Rivers State is bounded on the South by the Atlantic Ocean, to the North by Imo, Abia and the Anambra States, to the East by Akwa Ibom State, and to the West by Bayelsa and Delta states. Rivers State is a predominantly low-lying pluvial state in southern Nigeria, located in the eastern part of the Niger Delta on the oceanward extension of the Benue Trough. The inland part of the state consists of a tropical rainforest, and towards the coast, the typical Niger Delta environment features many mangrove swamps. Rivers State has a total area of 11,077 km² (4,277 mi²), making it the 26th largest state in Nigeria. Rainfall is generally seasonal, variable, as well as heavy, and occurs between March and October through November. The wet season peaks in July, lasting more than 290 days. The only dry months are January and February having little to no effect. Total annual rainfall decreases from about 4,700 mm (185 in) on the coast, to about 1,700 mm (67 in) in the extreme north. It is 4,698 mm (185 in) at Bonny along the coast and 1,862 mm (73 in) at Degema. For Port Harcourt, temperatures throughout the year are relatively constant with little variation throughout the seasons. Average temperatures are typically between 25−28°C. Some parts of the state still receive up to 150 mm (6 in) of rainfall during the dry period. Relative humidity rarely dips below 60% and fluctuates between 90% and 100% for most of the year (Olatunji et al., 2019) (Figure 1).
Description of the soil
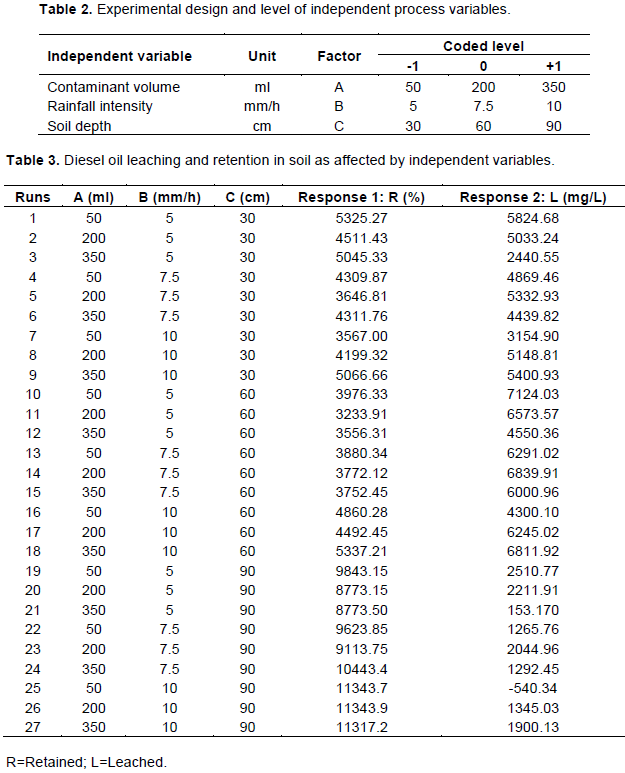
The soil samples used in this study were obtained from BTS sites in Rivers State. Five samples were obtained from the study area. The samples were analyzed in the laboratory to determine the predominant soil type at BTS sites where the samples were obtained. The predominant soil types were obtained through grain size analysis using the hydrometer method. At the end of the laboratory analysis, it was observed that the soils at the BTS sites are predominantly made up of sand and silt with a little amount of gravel. Therefore, the 5 BTS site as sampled in the study area is shown in Table 1.
This study is designed to evaluate the modeling of leaching rates of different types of contaminated soils at BTS sites within Rivers State, Nigeria. Leaching refers to the movement or washing away of water-soluble compounds from the soil or into lower layers of subsoil while retention refers to the ability of the soil to hold or contain contaminants within a confined boundary. The different sites were sampled for diesel contamination. The different soil samples will be applied to the three soil samples collected above during dry and rainy seasons. The samples were collected using a mesocosm in which leachates were collected after applying contaminants four weeks each; leaching rates were measured weakly for each soil sample type and readings were recorded to ascertain the leaching rates of the soil samples for different weather conditions. There will be a site D that will be used for control where there is no form of mitigation and contamination. The site E will have a geosynthetic membrane (Polythene) as a control parameter for the pollutants. Each of these BTS sites will have an associated baseline study area to compare the level of pollution with the treatment site. The amount of diesel remaining will be measured at various depths for both the baseline and study area. Three BTS sites with high levels of contamination will be identified and samples of spilled diesel collected from these sites. The sites were selected based on complaints of diesel oil spillage by field support engineers or managed service vendors and Telecom infrastructure providers.
Identification of sites and checks for appropriateness was done.
Design of experiment (DOE)
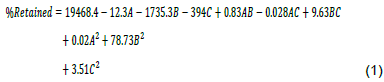
The experimental design was set up using DOE software Version 11.0.1. with 33 factorials. The variables and their range are given in Table 1. This range was carefully chosen based on previous studies. The variables are coded as contaminant volume (A), rainfall intensity (B), and soil depth (C) accordingly. Generally, each factor in Central Composite Design has five stages and grouped into three design points, which are identified as two stages of factorial points, well-defined as 1 and -1, (axial points), and a (center point) defined as 0 (Table 2). The center points are primarily repetitive trial arrays closer to the center of factor space to endorse the best prediction potential. In the present study, there are 27 experimental runs (Table 3).
Experimental set-up and procedures
Samples were collected and sealed in plastic containers to be resampled. The reason for the resample is to remove materials that might impact the results or tests e.g. gravel, stones, wooden/plastic materials, and roots of plants. The soil in the plastic containers was kept sealed until they were ready for sampling to avoid contamination. Samples were preserved and characteristics of soil samples were obtained using guidelines found in the QAPP (Thompson et al., 2004). Instruments and apparatus used include, shovel, hand trowels, plastic bottles, auger, drilling bits, density measurement equipment, and sieves. For every randomly selected BTS within the study area, the soil samples were extracted at various depths of 30, 60, and 90 cm, as is consistent with the design of the experiment. For every 30 cm depth, 9 samples of undisturbed soil were collected using galvanized steel mesocosms. Similarly, for each of 60cm and 90cm depth, 9 samples of undisturbed soil were collected using galvanized steel mesocosms. The experimental set-up consists of 2 major aspects (1) Rainfall simulator set-up, and (2) Mesocosm set-up. The rain simulator, mesocosm set-up for collection of leachates, determination of total petroleum hydrocarbon, and soil hydrocarbon extraction water
content were carried out.
Statistical modeling
Factorial design and response surface methodology were used for experimental design and data analysis. A 33 - factorial design with contaminant volume (A) in ml, rainfall intensity (B) in mm/h, and soil depth (C) in cm, as the independent variables were used. They were coded at three levels between -1 and +1. The ranges of the individual factors (independent variables) were chosen and presented in Table 2. The statistical design expert software was used to design the experiment and data analysis. Response Surface Methodology (RSM) was applied to predict the operating condition for the amount of diesel leached and that retained in the soil from our previous study. Three dimensional (3D) graphs were achieved, based on the effects of three process parameters on the two responses, as well as their interactions to obtain the optimum leaching rate and conditions for the amount of diesel retained in the soil. Table 3 demonstrates the responses (L and R) against the respective experimental run, designed using RSM. The response surface methodology developed a relationship between process variables (A, B, and C) and the responses (L and R). The RSM analysis and optimization of process parameters were carried out in design expert software.
Experimental result
The experimental result for the response parameters as well as the independent variables is shown in Table 3, following the 27 runs from the experimental design.
Effects of independent variables on the amount of diesel leached and retained
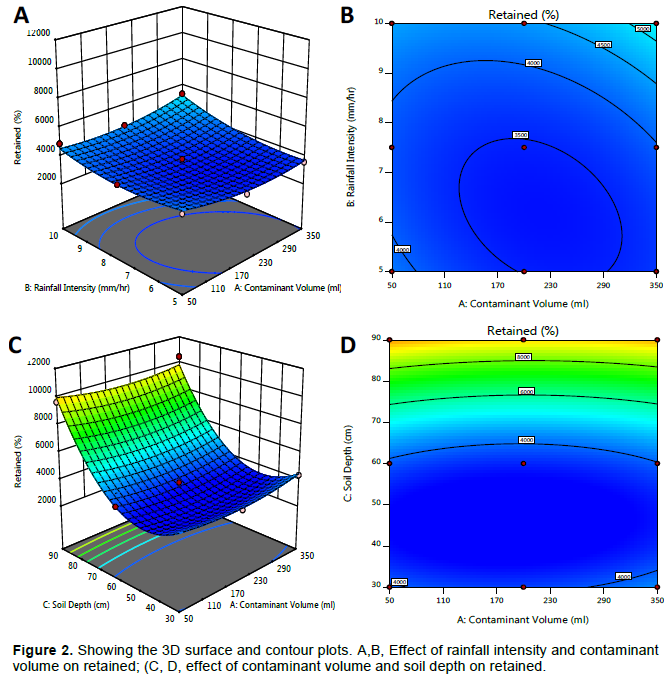
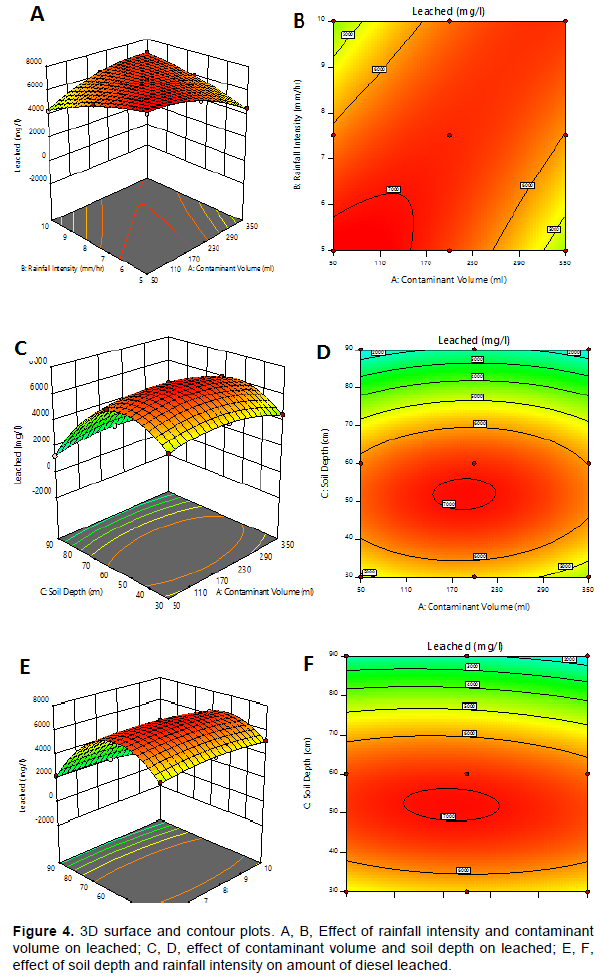
The following graphs from Figures 2 and 3 show the interaction between independent variables on the amount of diesel oil leached and retained in the soil. The effects of the factors on the response were measured using a 3D surface plot and contour plots which indicate the interaction between the variables. It shows the factors (soil depth and rainfall intensity, contaminant volume) significantly affect the response variables that were leached, and retained.
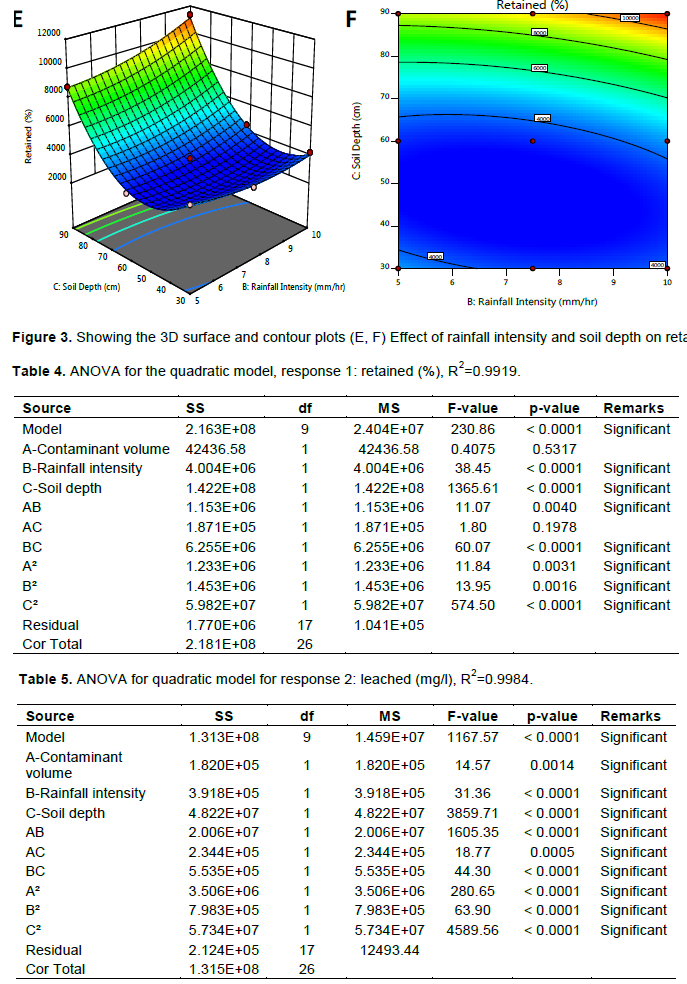
In Figure 1A and B, there is a significant effect when rainfall intensity and contaminant volume are combined on the interaction of the amount of diesel retained in the soil. On the other hand, the response retained increased significantly as contaminant volume increases in Figure 1C and D. Similarly, the amount of diesel retained increased significantly with an increase in rainfall intensity at lower soil depth. This shows that at lower soil depth with a high rainfall leaching rate is reduced. Again, in Figure 4A, and B, leaching reduces as contaminant volume decreases at higher rainfall intensity. This is similar to Figure 3B, C where the amount of diesel leached decreased significantly as contaminant volume decreases with increasing soil depth. The case in Figure 3E and F also follows the same order which shows that the amount of diesel leached decreases at increasing soil depth and decreasing rainfall intensity.
Analysis and model equations
To perform a statistical analysis of the results Analysis of Variance (ANOVA) was used (Ceylan et al., 2008; Voneiff et al., 2014, 2013). As shown in Tables 4 and 5, contaminant volume (ml), rainfall intensity (mm/h), soil depth (cm), which are the operating parameters with three levels (-1, 0, and +1) were utilized for the diesel leaching process. The system responses were measured in terms of the amount of diesel leached and retained in the soil. The effect of operating parameters was investigated using 33 factorial, 27 runs experiments. Lack of fit test was observed to be non-significant, which is adequate, thus the model can predict the amount of diesel leached and retained within the design range of variables. Tables 4 and 5 show the analysis of variance (ANOVA) between the statistical model and experimental values for the independent variables (factors) and the response parameters as well as the coefficient of correlation for each response.
The model F-value of 230.86 implies the model is significant. There is only a 0.01% chance that an F-value this large could occur due to noise. P-values < 0.05 indicate model terms are significant. In this case, B, C, AB, BC, A², B², C² are significant model terms. All values > 0.1 indicate the model terms are not significant. If there are many insignificant model terms (not counting those required to support hierarchy), model reduction may improve the model. The predicted R² of 0.9770 is in reasonable agreement with the adjusted R² of 0.9876; that is, the difference is less than 0.2. adeq precision measures the signal to noise ratio. A ratio greater than 4 is desirable. The ratio of 42.473 indicates an adequate signal. This model can be used to navigate the design space. This agrees with the postulations given by Ameen et al. (2019) and Ndukwu et al. (2019).
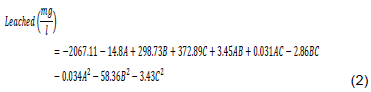
The final model equation in terms of actual factors:
where is the contaminant volume (ml), is the rainfall intensity (mm/hr) and is the soil depth (cm).
The equation in terms of actual factors can be used to make predictions about the %retained for given levels of each factor. Here, the levels should be specified in the original units for each factor. The model F-value of 1167.57 implies the model is significant. There is only a 0.01% chance that an F-value this large could occur due to noise. P-values < 0.05 indicate model terms are significant. In this case, A, B, C, AB, AC, BC, A², B², C² are significant model terms. Values > 0.1 indicate the model terms are not significant. If there are many insignificant model terms (not counting those required to support hierarchy), model reduction may improve the model. The predicted R² of 0.9948 is in reasonable agreement with the adjusted R² of 0.9975; that is, the difference is less than 0.2. Adeq precision measures the signal to noise ratio. However, a ratio greater than 4 is desirable. The ratio of 117.068 indicates an adequate signal. This model can be used to navigate the design space.
The final equation in terms of actual factors:
Model validation
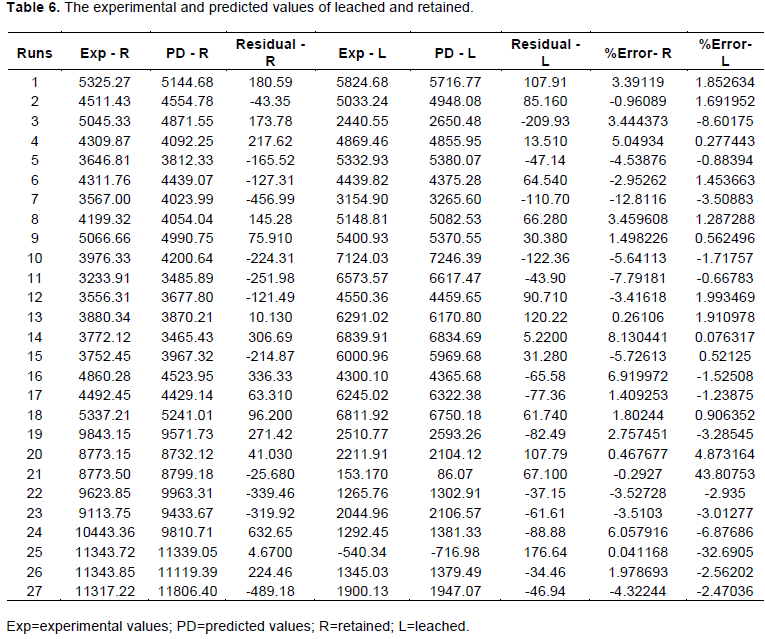
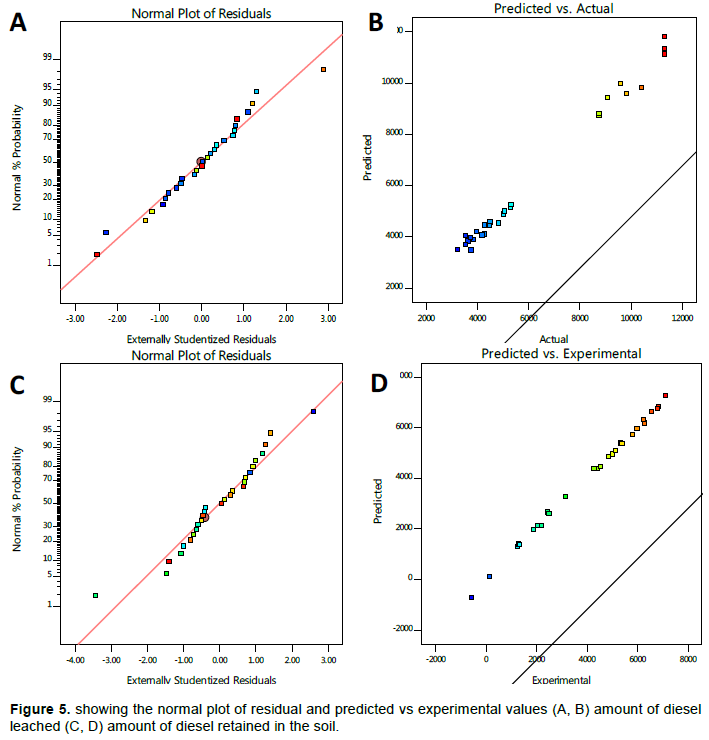
In this study, the statistical model was validated by comparing experimental and predicted values as well as the residuals obtained from the RSM analysis (Table 6). Also, a graph of experimental values of the amount of diesel leached and retained in the soil versus predicted values was generated (Figure 3). The effects of operating parameters including contaminant volume, rainfall intensity, soil depth, which affects the amount of diesel leached/retained in the soil were studied utilizing 33 factorial experiments known as one of the methods of response surface methodology (RSM). Furthermore, parameters that significantly affect the leaching rates were evaluated and optimized. To obtain the maximum response of the experiment, the optimum values were determined from the model (Table 6). For this purpose, an experiment was conducted at the optimum operating conditions. Also, the percentage error obtained from the experimental response and the predicted response value was calculated by Equation 3:
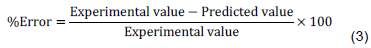
The results shown in Table 6 represent the small amount of error resulting from experimental and predictive values. Also, the proximity of these values confirms the validity of the model and the value obtained at the optimum condition. The computational error is mostly considered to be less than 3% acceptable and represents the accuracy of the model at about 97%. From Figure 5 (A-D above it can be seen that model fits the experimental data by comparison of predicted values versus the actual value. The amount of diesel retained in the soil yielded 5744.7% while the leached amount is 5716.8 mg/L at the desirability of 0.719.
Given a contaminant volume of 250 ml, rainfall intensity is 5 mm/h; soil depth is still 30 cm. The amount of diesel leached and retained is 4352.1 mg/L and 4559.6% respectively. In the modeling process, it was observed respectively. In the modeling process, it was observed that more amount of diesel was leached at lower soil depth with high rainfall intensity; while the lower amount of diesel was leached at high contaminant volume, at high soil depth and high rainfall intensity. Therefore, the quantity of diesel leached increases at lower soil depth with low rainfall intensity and high contaminant volume.
The amount of diesel leached and retained in a polluted soil at the telecommunication base station was studied using RSM by 33 factorials. The effects of operating parameters, such as contaminant volume (ml), rainfall intensity (mm/h), and soil depth (cm) on the amount of diesel leached/retained in the soil were investigated. According to the results obtained through ANOVA, the model was fitted to the experimental data with high coefficients. The amount of diesel leached is inversely proportional to the amount retained in the soil. The study also revealed that as contaminant volume increases, the amount of diesel leached decreases, and vice versa. Similarly, the amount of diesel leached increases as rainfall intensity increases. Additionally, the quantity of diesel leached increases as the soil depth increases but these changes/reverses when the soil depth exceeds 50 cm; while the corresponding amount of diesel leached is greater than 4200 mg/L. The correlation between the actual and predicted retained concentration indicated that there is a decent relationship existing between them. Further analysis of the graph reveals that the retained concentration hovers around the trend line given a line of best fit with a very high correlation coefficient and predictive relevance of 0.9919 and 0.9984 respectively. This implies over 90% accuracy for retained and leached concentrations. Consequently with very high regresion coefficient for retained and leached concentrations as well as accurate and acceptable agreement for predicted and adjusted concentrations, this implies that the quadratic model is accurate, effective and highly recommended for use.
The authors have not declared any conflict of interests.
REFERENCES
|
Aderoju OM, Godstime J, Olojo O, Oyewumi A, Eta J, Onuoha HU, Salman K, Nwadike BK (2014). Space-based assessment of the compliance of GSM operators in establishing base transceiver station (BTS) in Nigeria using Abuja municipal area council as case study. Journal of Environmental Science, Toxicology and Food Technology 8(10):46-57.
Crossref
|
|
|
|
Ameen M, Azizan MT, Yusup S, Ramli A, Shahbaz M, Aqsha A (2019). Process optimization of green diesel selectivity and understanding of reaction intermediates Renewable Energy 16:124- 132.
|
|
|
|
|
EPA (2017). How to evaluate alternative cleanup technologies for underground storage tank sites: A guide for corrective action plan reviewers. Land and EPA 510-B-17-003. Emergency management october 2017. 5401R.
|
|
|
|
|
Kordybach BM (1999). Sources, Concentrations, Fate, and Effects of Polycyclic Aromatic Hydrocarbons (PAHs) in the Environment. Part A: PAHs in Air. Polish Journal of Environmental Studies 8(3):131-136.
|
|
|
|
|
Mohajeri L, Aziz HA, Isa MH, Zahed MA (2010). A statistical experiment design approach for optimizing biodegradation of weathered crude oil in coastal sediments. Bioresource Technology 101:893-900.
Crossref
|
|
|
|
|
Ndukwu MC, Chakraborty VS, Ekop IE, Etim PJ, Ohakwe CN, Ezejiofor NR, Onwude DI, Abam FI, Igboayaka EC, Ohia A (2019). Response surface optimization of Bambara nut kernel yield as affected by speed of rotation, and impeller configurations. Scientific African 6:00174.
Crossref
|
|
|
|
|
Olatunji OM, Horsfall IT, Ekiyor TH (2019). Comparison of bioremediation capabilities of poultry droppings and avocado pear seed cake in petroleum polluted soil. Journal of Engineering and Technology Research 10(5):38-45.
Crossref
|
|
|
|
|
Olukolajo MA, Ezeokoli NB, Ogungbenro MT (2013). Locational effect of GSM mast on neighbouring residential properties' rental values in Akure, Nigeria. Academic Journal of Interdisciplinary Studies 2(3):147-156 (10 pages).
Crossref
|
|
|
|
|
Patti S, Siana W (2016). Toxicity testing of soils contaminated with gasoline, diesel, and heavy oil. Environmental Technology and Innovation 10: 335-344.
|
|
|
|
|
Peter OO, Tien-Chien J (2018). The Energy Cost Analysis of Hybrid Systems and Diesel Generators in Powering Selected Base Transceiver Station Locations in Nigeria. Energies 11:687.
Crossref
|
|
|
|
|
Sharma S, Malik A, Satya S (2009). Application of response surface methodology (RSM) for optimization of nutrient supplementation for Cr (VI) removal by Aspergillus lentulus AML05. Journal of Hazardous Materials 164:1198-1204.
Crossref
|
|
|
|
|
Sugiura KM, Shimauchi IT, Harayama S (1997). Physicochemical properties and biodegradability of crude oil. Environmental Science and Technology 31:45- 51.
Crossref
|
|
|
|
|
Sung K, Corapcioglu MY, Drew MC, Munster CL (2001). Plant contamination by organic pollutants in phytoremediation. Journal of Environmental Quality 30(6):2081-2090.
Crossref
|
|
|
|
|
Thompson AN, Shaw JN, Mask PL, Touchton JT, Rickman D (2004). "Soil Sampling Techniques for Alabama, USA Grain Fields. Precision Agriculture 5(4):345-358.
Crossref
|
|
|
|
|
Venkata S, Purushotham B, Sarma PN (2009). Ex-situ slurry phase bioremediation of chrysene contaminated soil with the function of metabolic function: Process evaluation by data enveloping analysis (DEA) and Taguchi design of experimental methodology (DOE). Bioresource Technology 100:164-172.
Crossref
|
|
|
|
|
Wyszkowska J, Kucharski J, Wałdowska E (2002). The influence of diesel oil contamination on soil enzyme activity, Chemistry, Environmental Science: Plant Soil and Environment 48(2):58-62.
Crossref
|
|
|
|
|
Zahed MA, Aziz HA, Mohajeri L, Mohajeri S, Kutty SRM, Isa MH (2010). Application of the statistical experimental methodology to optimize bioremediation of N-alkanes in aquatic environment. Journal of Hazardous Materials 184: 350-356.
Crossref
|
|