In this paper, the hypothesis that rainfall variability has an impact on wetland loss is tested. There is limited research in Zimbabwe that recognises the influence of rainfall variability on wetland loss. The purpose of this research is to determine the influence of rainfall variability on wetland size over time. Topographical maps, for the period 1972 to 2008, provided data on wetland locations and their changes in size with time. Rainfall data for Masvingo province for the 1980 to 2015 period was obtained from the Meteorological Services Department (MSD) of Zimbabwe. Statistical analysis shows that there is no relationship between rainfall variability and wetland loss. It can be concluded that there is no relationship between rainfall variability and wetland loss therefore. The research findings show that the rates of change in wetland size differ from one wetland to another. The implications on wetland management are that interventions should largely address human causal factors of wetland loss than rainfall variability. Therefore, it is vital to devise a wetland rehabilitation plan that enables management of water from the rivers and wetlands that the communities depend on.
Climate plays a critical role in influencing water, vegetation and even soil components of wetlands (Habibullah et al., 2019; Dzvimbo et al., 2017; Erwin, 2009). It is regrettable that wetlands are being converted to agricultural land worldwide as a mitigation strategy to cope with challenges associated with climate change and poverty (Dzvimbo et al., 2017; Li, 2008; Dube and Chimbari, 2009; Erwin, 2009). There is a need to test the relationship between rainfall variability and wetland loss in an attempt to establish wetland rehabilitation intervention strategies.
Due to increasing aridity in Zimbabwe, rainfall variability maybe a key variable in determining wetland loss. This has triggered an accelerated conversion of wetlands for agriculture purposes. This practice poses challenges for reconciling wetland productivity and preservation because wetland conversion for cultivation purposes ensures household food security. It is against such observation that the researcher notes that besides notable influence of climate change on wetland health, fragmentation of wetlands can result from mismanagement (Chikodzi, 2018). Hayal et al. (2012) conclude that wetlands are among the ecosystems most vulnerable to anthropogenic activities, a condition aggravated by climate change.
Rainfall variability alone does not necessarily influence wetland size and loss. Limited understanding of the hydro-geomorphic and climatic influences on wetlands can result in inappropriate implementation of wetland rehabilitation measures (Riddell et al., 2012). There is limited literature focusing on the influence of climate change on spatio-temporal wetland loss. Wetland production in an effort to alleviate poverty, impacts negatively on provision of ecosystem goods and services (Howe et al., 2013). Zimbabwe has undertaken some research (Gadzirayi et al., 2006; Manzungu and Mtali, 2012; Mudombi, 2020) focusing on the agricultural use of wetlands. In other countries, notable studies such as that of Erwin (2009), Hayal et al. (2012), Ogato (2013) and Ndiwa and Muthama (2020), propose that wetland rehabilitation projects should be implemented in the face of climate change. However, in Zimbabwe, there is very limited literature that recognises the influence of rainfall variability on wetland loss. The purpose of this study is to trace and explain changes in rainfall patterns and wetland size in South Eastern Zimbabwe.
In South Eastern Zimbabwe, climatic conditions explain the small size of wetlands characterizing the study area. Climate variability has led to the shrinking and drying up of most wetlands in Zimbabwe (Ndiweni and Gwate, 2014). The majority of the people survive on less than $1(USD) per day. Such widespread poverty and food and water insecurity are socio-economic conditions that drive people to use wetlands. According to the World Bank (2019), there is a marked gap between income levels in Botswana and South Africa on one hand, and Zimbabwe on the other. Per capita GDP in Zimbabwe has generally hovered in the $US 1000-2000 in the last decade, roughly 1/3 or less of per capita production in Botswana or South Africa. Therefore, natural geological, hydrological, climatic and anthropogenic conditions exert a greater influence on wetland size. The rest of this paper is organized as follows. We first examine the characteristics of the study area. This is followed by a discussion on materials and methods used in the study, a discussion of research findings, and lastly the recommendations and a conclusion.
Study area
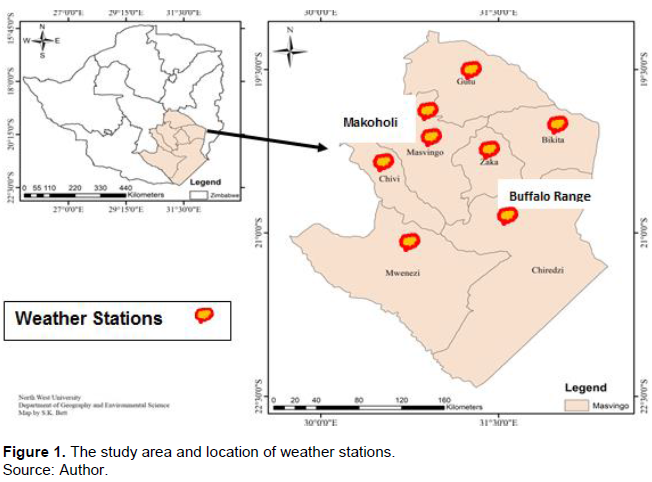
This study was conducted in Masvingo province, located South Eastern Zimbabwe (Figure 1). Masvingo refers to the name of one of the ten provinces in Zimbabwe. Again one of the districts in the same province is also apparently called Masvingo district. It lies between latitudes 20° and 22°S and longitudes 30° and 32°E in the Masvingo province. The area is characterised by granitic geological structures and valley depressions hydro-geomorphic conditions that have an influence on occurrence of wetland conditions in Riverine valleys. The average annual rainfall is about 550 to 650 mm and average temperature is 26°C.
Sampling weather stations and wetland patches
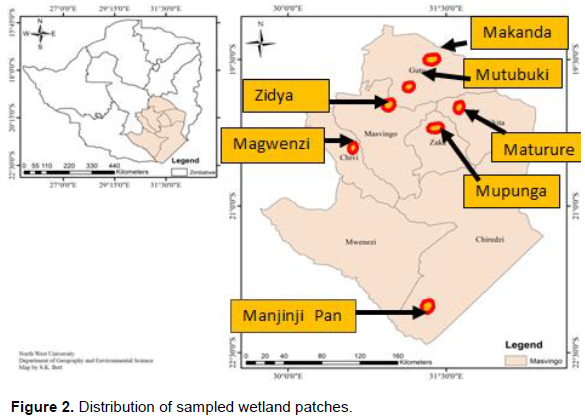
Masvingo provincial annual rainfall data for the period 1980-2015 was obtained from the Meteorological Services Department (MSD) of Zimbabwe. The period 1980-2015 was selected because the data reflects relatively current rainfall trends which are crucial in determining the extent to which temporal change in wetland size, as well as wetland loss are influenced by climate. In this study, a rainfall season is defined with reference to a year, for example the 1984/85 season will be denoted as 1985; 1989/1990 will be denoted as 1990 and so on. This was done because rainfall seasons normally start in October of the preceding year and ends in April of the succeeding year. The years that were included in the analysis include 1980, 1985, 1990, 1995, 2000, 2005 and 2010. The Meteorological Services Department (MSD) has 8 weather stations in the Masvingo province, as shown in Figure 1. The data sets obtained are for weather stations within a radius of 70 km to each of the seven wetlands (Figure 2). The change in wetland size was measured using topographical and orthophoto maps over time. Rainfall figures were used to compute the Standardised Precipitation Index (SPI) to establish peaks of wet, dry, and drought episodes.
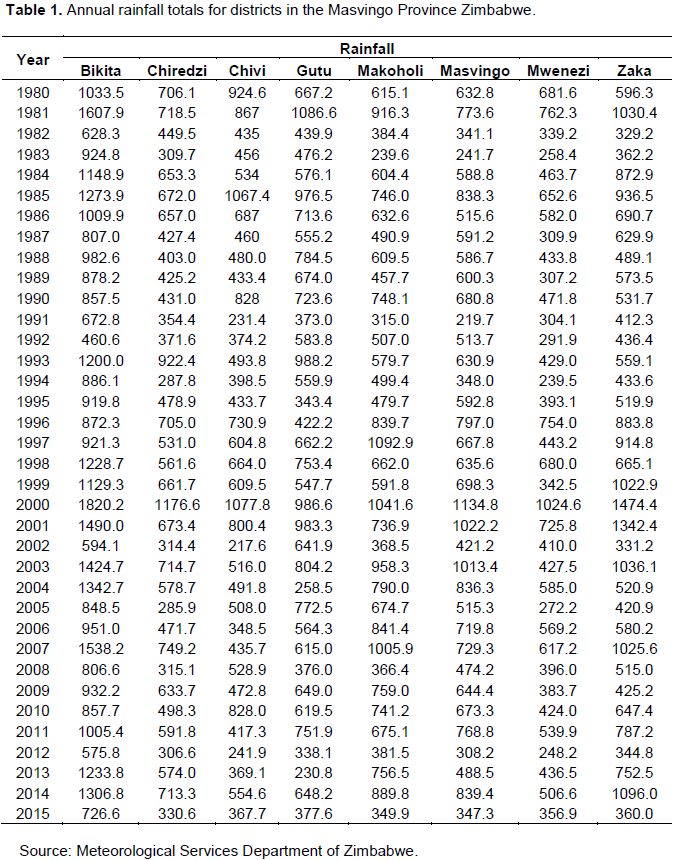
The meteorological stations that were included in the study are those that had complete records, for the period of interest, 1980-2015. The 8 weather stations whose rainfall data were included in the analysis are located at Bikita, Buffalo Range, Chivi, Gutu, Makoholi, Masvingo, Mwenezi and Zaka. These weather stations are also considered as the official sources of meteorological data in South Eastern Zimbabwe. Table 1 shows the raw rainfall data for the 8 districts in South Eastern Zimbabwe.
The number of wetland patches for each district was determined by reference to aerial photographs and topographical maps. A wetland patch is defined as a distinct delineated piece of wetland occurring within the landscape or catchment. The province has a total of 163 wetland patches (EMA, 2009). In this study, using stratified random sampling, 7 wetlands were selected using random number tables. This was based on the fact that wetlands sampled were supposed to be one of those close to rainfall gauging stations. A sample size of at least 4% of the wetland patches was used to measure changes in wetland size over time. A sample size of 4% gives reliable and credible results on influence of precipitation on wetland sizes over time. Using stratified random sampling, one wetland each was selected from each district, with the exception of Gutu district where three wetlands were sampled. From Gutu district, 3 wetlands were selected because proportionally it has more wetlands than the other districts. As a result, 7 wetland patches were selected. The sample wetland patches are shown in Figure 2.
Topographical maps obtained from the Surveyor-General’s office, provided data on wetland location, their sizes and change in size over time. The identified sections of the maps that show wetlands were digitised from aerial photographs of the years, 1972, 1984, 1995 and 2008 to trace spatial-temporal changes in wetland size. Aerial photographs are taken once in a year in Zimbabwe. However, due to socio-economic and political circumstances, the period 2008-2016 has no aerial photographs taken in Zimbabwe, although survey maps are available.
One of the key objectives of the research was to measure changes in the size of wetlands patches. The following formula, after Mtisi (2014) was used to determine spatial changes in wetland areas per patch:
[(X – Y) / X] × 100 (1)
where X is previous wetland area and Y is recent wetland area.
All the seven wetland patches, selected from the study area showed a decline in wetland size between 1972 and 2008. Digitised aerial photographs were used to measure the change in the size of wetlands. Subsequently, the changes in rainfall patterns between 1980 and 2012 are discussed.
Rainfall patterns in the area from 1980-2015
Table 1 shows that rainfall has generally been on the increase in the Chivi district from 1980 which recorded 924.6 mm and rose to 1067.4 mm in 1985. Between 1990 and 1995, there was a decrease in the amount of rainfall received (from 828.4 to 433.7 mm). Extreme rainfall variability creates uncertainties in decision making and rainfall variability poses challenges for wetland rehabilitation. These include deciding on alternative sources of livelihood, especially when alternative options to wetland utilisation and cultivation are not readily acceptable to affected communities.
There is a general decrease in rainfall in the area from 1980 to 2015 and variations from year to year. However, this variation is not significant. The rainfall amount recorded at Bikita was 1 033.5 mm in 1980 and it rose to 1 273.9 mm in 1985. This amount dropped by 416.4 to 857.5 mm in the 1990 rain season. Wetland utilisation increases during such dry episodes. Crop failure occurs in 3 out of every 5 years mainly due to poor distribution of rainfall within a wet season (Hamandawana et al., 2005; Mudombi, 2020). Again in most cases, there are some indications of possible relaxation of wetland cultivation restrictive policies in Zimbabwe (Taruvinga, 2009). The rainfall fluctuations in Figure 3, therefore, illustrate the changes in precipitation patterns over time.
The rainfall statistics for the Gutu district reveal quite a lot. The district recorded 667.2 mm in 1980 and 976.5 mm in 1985, which declined to 723.6 mm in 1990, with a further drop further to 343.4 mm in the 1995 season. The frequency and magnitude of drought occurrence has increased through time. The low rainfall during dry episodes leads to the conversion of wetlands to agricultural use which halts its recovery from previous wetter episodes. Nevertheless, one can observe from these trends that precipitation is on the decline in the Gutu district. Erratic and unreliable rainfall in the Gutu district explain the overexploitation of wetlands with water demand crops such as sugar cane and bananas, at the Chibvongodze and Mutubuki wetlands. Climate change and rainfall variability have affected and continue to affect individuals, populations, species and ecosystem composition and functions (Gitay, 2014).
The Buffalo range rainfall gauge station is representative of the Chiredzi district. The Samson and Manjinji pan are located in the Chiredzi district and close to Buffalo range weather station. The pan had 706.1 mm in 1980 which declines to 672 mm in 1985. This drops further to 431 mm in 1990. The general observation is that there is rainfall variability from one year to another. Thus, rainfall variability and continued land transformation will result in an increase in both human pressure on wetlands and human influence over the drivers that affect wetland functioning (Kotze, 2013; Abell et al., 2017).
The Makoholi research station recorded 615.1 mm in the 1980 rainfall season, which increased to 746 mm during the 1985 season. In 1990, it recorded 748.1 mm which declined to 479.7 mm in 1995. However, the Cyclone Eline episode of 2000 resulted in a record rainfall of 1 041.6 mm before it declined to 674.7 mm. These variations point to the influence on people to opt for wetland cultivation (Mapanda and Mavengahama, 2011).
The Zaka District’s rainfall gauging station recorded 596.3 mm in 1980, which increased to 935.5 mm in 1985. Quite often, rainfall comes in thunderstorms, particularly in the early phases of the rainy season. The rains therefore are particularly violent during the early part of the season, the very time when the land would be cracked and practically bare and devoid of vegetation cover (Makwara and Gamira, 2012). The year 2000 rainfall record shot up, due to Cyclone Eline, to 1474.4 mm and then declined to 420.9 mm in 2005. Nevertheless, the 2000 heavy rainfall was responsible for gully incision and desiccation of the Mupunga wetland. Furthermore, rainfall increases to 647.4 mm in 2010. It is clear that the Zaka district, a semi-arid, mountainous area with erratic rainfall averaging 600 to 800 mm/year (Makwara and Gamira, 2012), contributes greatly to the exposure of wetlands to all year round cultivation.
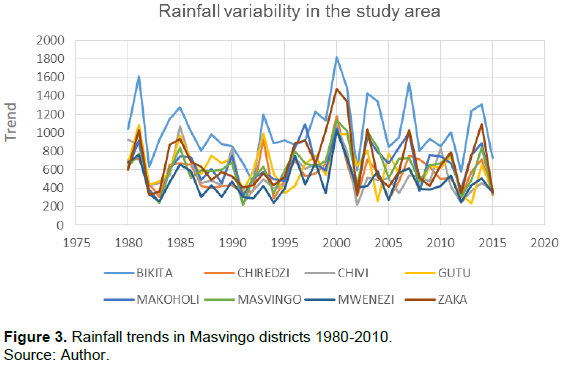
Table 1 shows that Masvingo weather station records 632.8 mm in 1980, which increases to 838.3 mm in 1985. Kamanga et al. (2003) observe that, Masvingo receives annual rainfall of between 450 and 650 mm and at the same time experiences dryness during the summer seasons and recurrent droughts. Agricultural drought is one that affects mainly crops whilst meteorological drought denotes a year that receives rainfall amounts far below the expected average. Trends in wetland utilisation increase when low rainfall, such as 208, 272.6, 293.1 and 109.7 mm received in 1983, 1987, 1991 and 1992, respectively occur.
Annual rainfall figures tend to blur precipitation deficits during the course of the year which impacts on wetland wetness. For example Table 1 illustrates that in 1985, Masvingo district records 838.3 mm of rainfall, however most of the rainfall fell in November and January, that is, 133.1 and 365.3 mm, respectively. The other months recorded less than 10 mm which denotes very dry phases even with an overall relatively wet season. The need for dry season based agriculture in Zimbabwe drives farmers to opt for wetland cultivation which explains wetland loss in the study area evident at Zidya (Table 4). These trends occur especially in rural areas where uplands are predominantly defined as regions of low agricultural potential due to poor soils and low unpredictable rainfall (Ellis-Jones and Mudhara, 1995).
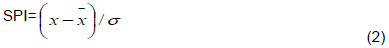
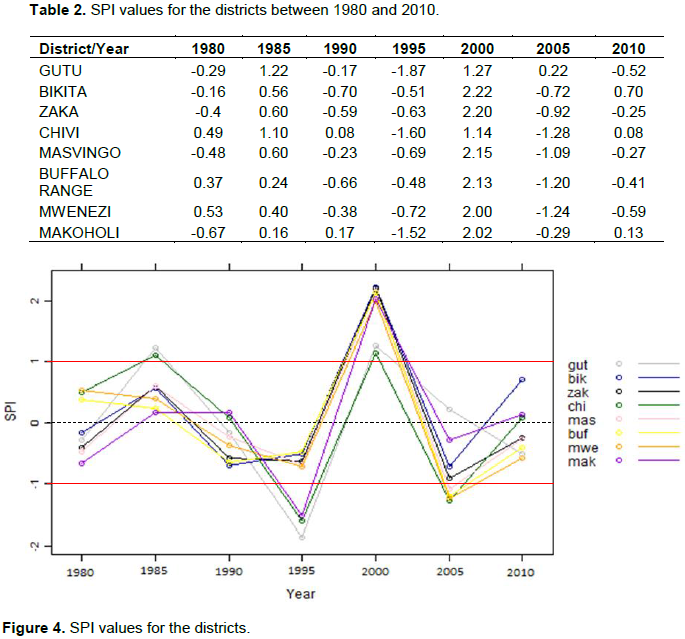
The standard precipitation indices (SPI) are calculated for the districts to help analyse the changes in rainfall patterns and the implications there-of on wetland loss (Table 2). The observed precipitation deviates from the long-term mean for a normally distributed random variable is calculated using the following equation:
where is the long term precipitation, is the mean precipitation for a specified period of time and is the standard deviation.
SPI is a commonly used meteorological drought indicator as it is solely based on precipitation. The index ranges between +3 and -3, and the condition is near normal if the SPI is between +0.99 and -0.99 (Tirivarombo and Hughes, 2011). SPI that are ≥1.5 show extremely wet spells and ≤-1.5 denoting extremely dry spells (Tirivarombo and Hughes, 2011).
In some years this SPI is <-1.0, as noted in the 1995 cases of Gutu, Chivi and Makoholi. However, in the year 2000, a positive SPI values of >+1 and +2 in the majority of the rainfall stations is recorded. Wetland remediation measures need to factor in possible impacts of double exposure. The concept of double exposure refers to the fact that ecosystems and social groups will be confronted both by the impacts of rainfall variability and other factors that are not climate-related. The aforementioned rainfall data can help to inform wetland remediation options for affected communities. The standardised precipitation index time series for each of the 8 weather stations in the Masvingo district shows the degree of variation from the norm (Figure 4). A normal rain season has value between +0.1 and -0.1 while >+1 and <-1 denote extreme rainfall events. Values >+1 mean very wet years and values <-1 mean extremely dry year. SPI values that are outside this range indicate anomalies in rainfall (Figure 4).
Based on the anomalies in Figure 4, Chiredzi, Zaka, Makoholi and Gutu experienced extremely dry seasons in 1995 which could have resulted in short to medium term decline in wetland size. Furthermore, in 2005, Bikita, Zaka, Chiredzi, and Makoholi experienced very dry conditions and possible losses in wetland sizes. These results point to the fact that rainfall variability should, to some extent, be factored into wetland rehabilitation techniques. Although other causes such as anthropogenic factors may contribute much to wetland shrinkage, the influence of rainfall variability cannot be ignored.
According to Frenken and Mharapara (2002), it was discovered that 10 years ago, the water table was on average 15 m from the surface. But due to mismanagement of wetlands, the water table dropped to a depth of 30 m on average suggesting future scarcity of water in Zimbabwe.
The SPI values in Figure 4 for 1995 and 2005 indicate very dry years whilst 1985 and 2000 were generally wet years. Although after a flood it takes some time for a wetland to retain to its base level, floods have a positive effect on wetland recovery. The amplitudes of SPI time series for 1985 and 2000 illustrate extreme wet weather events which have a strong bearing on wetland health. Farai et al. (2012) found an increase in the number of seasons recording below normal rainfall since 2002.
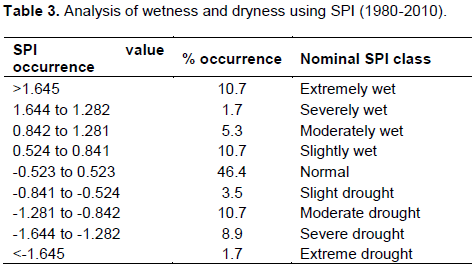
An analysis of SPI values in Table 3 enables the tabulation of the percentage of occurrence and their meaning as shown in Table 4.
It should be noted first that, reliable SPI data values need at least 30 years of continuous precipitation records (Jayanthi et al., 2013). Table 3, however shows SPI values occurrence over a period of 31 years, with over 5 year intervals, which is credible enough to analyze impacts of rainfall variability not only on wetland ecology but rehabilitation successes as well. Table 4 illustrates nominal SPI classes that interpret the meaning of SPI values in qualitative terms. From the nominal SPI classes, it can be observed that severe and extreme droughts have a combined occurrence of 10.6%. Slight and moderate droughts have a combined occurrence total of 14.2%. Extreme drought worsens wetland shrinkage such as Magwenzi that shrunk by 4.1% between 1984 and 1995.
Changes in size of wetland patches 1980-2012
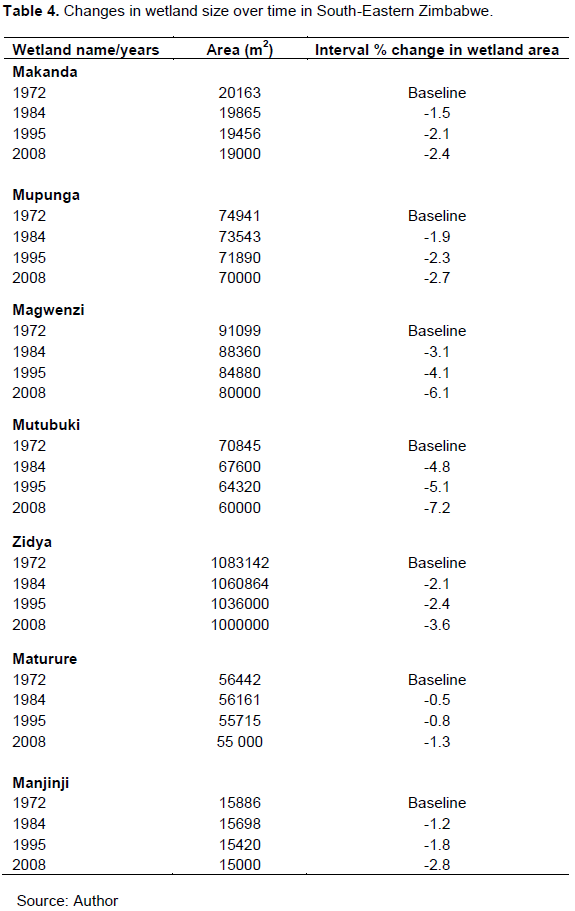
The results showing the change in wetland size over a time period are presented in Table 4. The varying changes are attributed to differences in biophysical factors, such as topography, pedology, rainfall amounts in the catchment area and human influences. Although these factors were not part of the research, they exert some influence on wetland size, structure and functions.
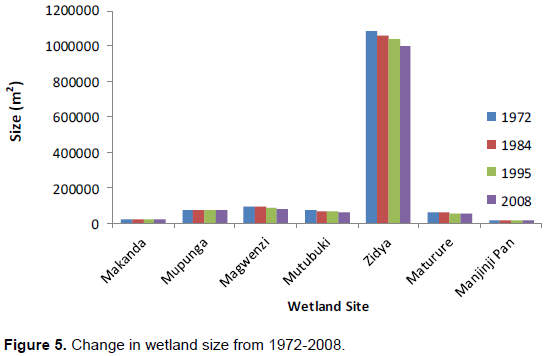
The Makanda wetland measured 20 163 m2 in 1972, which declined to 19 865 m2 (1.5%) in 1984. By 1995 the size had dropped further to 19 456 m2. Over a 13 year interval the wetland shrank in size by -2.4% to almost 19 000 m2. The trends indicate that unless effective and sustainable wetland rehabilitation measures are taken to reverse the situation, some wetlands can dry up. Hove and Chapungu (2013) state that the drying up of wetlands can be explained by excessive water abstraction and climatic changes. The decline of the wetlands over the time period is shown in Figure 5.
The Mupunga wetland experienced a slight decline in its size between 1972 and 1984, as it declined from 74 941 to 73 543 m2 amounting to a -1.9% decline. Further spatial decreases were noted between 1984 and 1995 (-2.3%) and 1995 and 2008 (-2.7%). The wetland changes are caused by factors such as rainfall amount in the catchment area, relief, rock type and slope steepness.
One of the wetlands that experienced a significant decrease in size is the Magwenzi wetland. The Magwenzi wetland, in the Chivi district, measured 91099 m2 in 1972 and the figure dropped to 88 360 m2 in 1984, which is a decline of -3.1%. In 1995, the wetland size declined to 84880 m2, a drop of -4.1%, the measurements for 2008 showing that the wetland had decreased to 80000 m2, which is a -6.1% loss of the wetland size. The extreme drought conditions experienced in the Chivi district in 1995 and 2005, shown by SPI value -1.60 and -1.20, respectively, explain the encroachment and cultivation of the observed crops in the Magwenzi wetland.
The Mutubuki wetland also experienced decline in size between 1972 and 2008. The wetland measured 70845 m2 in 1972 and had a -4.8% decline to 67 600 m2 in 1984. The wetland decreased by -5.1% to 64320 m2 by 1995, and shrank further in size from 64320 m2 in 1995 to 60000 m2 by 2008. This period experienced the greatest reduction in wetland size amounting to about -7.2%. The Zidya wetland measured 1083142 m2 in 1972 and declined slightly by -2.1% to 1060864 m2. In 1995 it dropped further to 1036000 m2. Finally by 2008, the Zidya wetland had lost -3.6% of its 1995 size to 1000000 m2. Wetlands in Zimbabwe are generally small in size; however, the Zidya wetland is the biggest, as shown in Figure 5 of the sampled wetland patches.
The Maturure wetland experienced the least decline in wetland size in the study area. The change was from 56442 m2 in 1972 to 56161 m2 in 1984. This is a decline of about -0.5%. The same wetland decreased by -0.8% from 56161 m2 to 55 715 m2 over an eleven year period from 1984 to 1995. Maturure also lost -1.3% of its size when it declined from 55715 m2 in 1995 to 55000m2 in 2008. The gorge like topography of the Maturure wetland and mountainous nature of its catchment could explain the slight decrease of wetland size. Maturure wetland occurs in a trough like valley encircled by mountains and hilly terrain from which recharge seepage lines ensure continuous supply of underground water.
The Manjinji pan measured 15886 m2 in 1972 and dropped to 15698 m2 by 1984, which is a -1.2% decline. The size of the wetland fell from 15698 m2 in 1984 to 15420 m2 by 1995, which is a -1.8% decline. The pan shrank in size by -2.8% after decreasing from 15420 to 15000 m2 as at 2008. Although accounting for the decline of wetland size is rather complex, poverty-driven wetland cultivation practices are key drivers of the shrinkage.
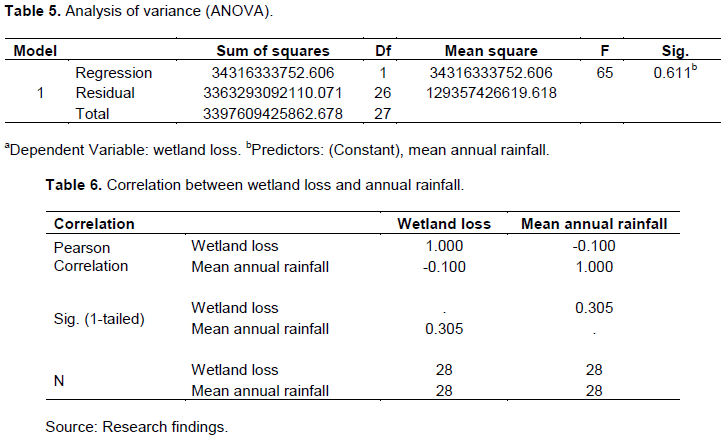
Statistically, the research findings illustrate that there is no significant relationship between changes in rainfall patterns and wetland loss (Table 5). From the regression analysis, the p value = 0.611 (p>0.05) and therefore the hypothesis that rainfall variability has no significant impact on wetland rehabilitation and recovery should be accepted. This suggests that other factors account for the observed decline in wetland size. These factors might be over-cultivation and overgrazing. The coefficient of determination is 0.010; therefore, only about 1.00% of the variation in the wetland loss is explained by mean annual rainfall variability. Hence, although wetland shrinkage is an on-going phenomenon, it cannot be attributed to rainfall variability alone.
Correlation analysis, [with the results shown in Table 6] was used to prove the validity of the statement that there is a relationship between changes in rainfall variability and the amount of wetland loss. The results from an analysis of variance (ANOVA) proved that there was no relationship, over the time period, between changes in rainfall patterns and wetland loss. Marambanyika and Beckhedal (2016) and Maviza and Ahmed (2020) cited that wetland mismanagement was identified as a main factor on wetland degradation and loss in Zimbabwe. The Pearson correlation analysis results reveal that there is no significant correlation between wetland loss and changes in rainfall patterns Table 6. The correlation coefficient for wetland loss and mean annual rainfall is -0.1. This value of r suggests a weak negative linear correlation. According to Dixon and Carrie (2016), direct and indirect human activity has considerably altered the rate of change of wetlands. The loss of wetlands was probably due to direct and indirect human activities in wetland ecosystems.
Wetland patches were also subjected to a T-test analysis to determine the relationship between rainfall patterns and wetland size as part of the data triangulation process. The T-tests results reveal that there is no statistically significant relationship between rainfall patterns and change in wetland size. All the seven wetlands have a critical value of 4.303. The rejection criterion was; reject
The fact that the critical value 4.303 is greater than all T values means that there is no relationship between wetland loss and rainfall changes for the Makanda, Mupunga, Magwenzi, Mutubuki, Maturure and Zidya wetlands together with the Manjinji pan. Therefore, there is no direct relationship between changes in mean annual rainfall and the amount of wetland loss and the findings point to the dominant role of other factors other than rainfall variability.
It cannot for certain be proved that there is a direct linear link between rainfall variability and wetland loss. The rates of wetland loss (y) are directly dependent on rainfall variability (x). In terms of statistics, rainfall variability is a measure of deviation between the normally expected outcome and what in fact occurs. In this study the rate of wetland loss is related to rainfall variability to a lesser extent, to a greater extent the two variables are not related. Wetland loss depends on rainfall variability in the short term but over long term adaptation and wetland resilience has shaped wetlands to condition themselves to prevailing rainfall patterns. The correlation analysis shows that there is no relationship between wetland loss and rainfall variability.
This study used SPI as a measure of rainfall variability. Comparison of SPI values and wetlands loss does not always necessarily show a simple linear relationship, that is, a huge negative SPI of -2.5 does not translate to a huge loss in wetland size. Rather it seems other non-climatic factors contribute to wetland loss. Results of studies by Ziti (2020), show that the seasonal average rainfall decrease from 1972 to 2010 was not statistically significant (p=0.635, α=0.05), but the decline bears a significant environmental impact. This is a perspective that needs further investigation. Research by Maguranyanga et al. (2021) shows that the effects of climate change will likely continue to be heightened variability in rainfall, with drought shocks combining with wider political and economic drivers in particular ways to create shifts in land use, rather than seeing a simple, uni-directional change over time. A study by Fakarayi et al. (2015) showed that wetlands regressively declined in size from 3.503 ha in 1995 to a paltry 1.938 ha in 2010. At the same time the area under cultivation has progressively increased from 89 ha in 1995 to 4244 ha in 2010. This implies that there is a correlation between wetland loss and drivers of change triggered by human activities, such as cultivation.