ABSTRACT
The rice-growing area of ​​Maga is located in the floodplain of Lower Logone. It covers an irrigable area of ​​more than 7000 ha of arable land. This area is indeed subjected to groundwater quality studies. Three campaigns of water sample studies were performed for one year in 15 points including nine boreholes and six domestic feed wells. Temperature, pH, EC, as well as Ca2+, Mg2+, Na+, K+, NH4+, HCO3-, NO3-, Cl-, SO42- and PO42- were analyzed for these water samples. The results showed that these waters have a medium degree of mineralization, resulting in facies of carbonated sodium and potassium type, then bicarbonate calcium and magnesium. The levels of calcium, magnesium, sodium, potassium, bicarbonates, chlorides and sulphates are much lower than those recommended by World Health Organization (WHO) for human feed water. The contents of ammonium, nitrates and phosphates are in most waters samples above WHO prescribed level (0.5, 50 and 0.5 mg/L). These ions in high proportions have an anthropogenic origin because of the practice of rice farming. The sodium adsorption ratio (SAR) allowed us to qualify groundwater intended for irrigation.
Key words: Physicochemical, groundwater, mineralization, Maga.
Groundwater of good quality is nowadays threatened both qualitatively and quantitatively. This threat is accentuated by human activities (Hassoune et al., 2006; El Asslouj et al., 2007; Bouderka et al., 2016) although it may have natural causes (Andre et al., 2005; El Asslouj et al., 2007; Kuldip Singh et al., 2011). Among anthropogenic sources are agricultural activities that use agrochemicals that can migrate to surface and groundwater, thus altering its quality (Fadel et al., 2007; Koné et al., 2009).
In Cameroon the water resource is abundant but its quality is still not good (Kengni et al., 2012; Kristin et al., 2014). Some studies carried out in the northern part of Cameroon in order to evaluate the groundwater quality reported several sources of pollution (Mbawala et al., 2010; Kristin et al., 2014; Moussa et al., 2014; Hambate et al., 2015; Sara et al., 2016), which is a threat because it lowers the overall water resources balance. Access to good quality water therefore remains big challenge for the government and the people.
In the Far North Region, only 13.8% of households had access to drinking water in 2011 (Djao et al., 2011). In the district of Maga, only a few families are connected to the water distribution network provided by Cameroon Water Utilities Cooperation (CAMWATER). Majority of the population in this area use well water and boreholes whose qualities is not controlled. However, with a dense rice activity and an intensification of market gardening, the underground water resources can be threatened by an uncontrolled use of agricultural inputs following liberalization of the market supply of these chemicals. Knowing that the pollution prevention of water is preferable to the treatment of the latter for the supply of drinking water (Mourey and Vernoux 2000), it is therefore appropriate to monitor the variation and evolution of the quality of water resource of the area. This study focuses on the assessment of the physicochemical quality of water captured by boreholes and wells in the irrigated rice area of ​​Maga for its domestic and agricultural use.
Description of the study area
The rice-growing area of ​​Maga is located between latitude 10°21' and 10°51' N and between longitude 14°56' and 15°13' E. It is in the Department of Mayo-Danay, Region of Far North Cameroon. This area has about 7000 ha of developed arable land divided into four compartments (Maga East, Maga West, Pouss and Guirvidig) and more 2000 ha undeveloped (Figure 1). The climate that reigns there is of the Sahelo-Sudanese type, characterized by a long dry season that starts in October and ends at the beginning of May and a short rainy season, from June to September marked by episodes rainy violent. The average annual rainfall varies between 750 and 800 mm. The average annual temperature varies between 26 and 28°C with a monthly average that can reach 34°C in April. The morphology is dominated by a plain that before the development of SEMRY's (Société de Modernisation de la Riziculture de Yagoua) facilities in Maga remained flooded for 5 to 7 months the flood waters of Logone (Seignobos and Moukouri, 2000; Ngounou et al., 2007). On the plan geologic there are recent and ancient quaternary formations consisting of alluvial clay-sandy deposits generally between 50 and 70 m thick (Schneider and Wolff, 1992; Biscaldi, 1970). The soils of the area are poorly developed soils, Vertisols, and tropical ferruginous soils, hydromorphic soils and halomorphous soils (Barbery and Gavaud 1980).
METHODOLOGY
Water samples for the study were collected in October 2017, February and June 2018. 45 samples were collected during these three campaigns. These samples collected in polyethylene bottles with a capacity of 1.5 L, previously washed with 1 M nitric acid and then with distilled water. Before sampling in the field, these bottles are rinsed three times with the water to be taken. These samples are subsequently transported in a cooler at 4°C for laboratory analysis. Sampling points were located by their geographic coordinates determined by a Garmin branded GPS. pH, the electrical conductivity and temperature were measured in situ using a probe Hanna HI 98130 brand multi-parameters. The probe was submerged into the sampled water and readings taken when they stabilized. The complete alkalimetric title was determined by titrimetric in the field using a 0.02N H2SO4 solution. Sodium (Na+) and potassium (K+) were assayed by flame photometry. The other parameters (Ca2+, Mg2+, NH4+, NO3-, Cl-, SO42- and PO42-) were determined using a Hanna HI 83300 photometer.
Statistical analysis of the data obtained with the XLSTAT 2018 software. The results obtained are compared to the WHO guideline values ​​for physical and chemical parameters for the quality of drinking water (WHO, 2008). The Gibbs diagram (1970) was used to determine the origin of the mineralization of the waters, the hydro-chemical analysis was carried out using the Software Diagram 6.57 (Simler, 2007) and to assess water quality for agricultural use, we used Wilcox (1948) and Richards (1954) diagrams to perceive the risk of soil salinization and sodization.
Physicochemical quality of water
The average minimum temperature value for all campaigns is 28.17°C while the average maximum value is 32.03°C (Table 1). The average standard deviation (SD) annual average (1.07) and the average coefficient of variation (CV) (0.035) of the temperature that these groundwaters are globally influenced by ambient temperature (Kelly et al., 2013). This temperature variation will have an influence on the reactions of the chemical elements and pH of water (Larive, 1997). These waters have a pH ranging from 6.65 to 8.19 (Table 1) which is in the meantime recommended by WHO (6.5 - 9.5) for the quality of drinking water. These waters have a low pH dispersion (SD equals 0.47) with values ​​close to 7 can justify the strong presence of bicarbonate ions (Guilhem, 1976). These pH values are in the range of those obtained by Kristin et al. (2014) during the study of quality Groundwater in the Lower Logone flood plains.
Electricity conductivity (EC) measurements across all campaigns show values ​​between 120 and 823.33 μS/cm with an average of 409.33 μS/cm (Table 1). The boreholes F04 and F08 then the wells P02, P03 and P06 have values conductivity range of 400 to 600 μS/cm illustrating that these water points have a medium mineralization (Table 2). Boreholes F05, F09 and well P05 have conductivity values between 600 and 1000 μS/cm indicating important mineralization. For the others water points (F01, F02, F03, F06, F07, P01, P04) mineralization is observed to be weak to slightly accentuated.
Total mineralization or TDS is the sum of cations and anions. Charge is between 82.67 and 759.67 mg/L. With the exception of the waters of points F06 and F07, all the other concentrations are characteristic of the groundwater which is included in the range 100-1000 mg/L (Chebotarev, 1950; Hem, 1989). Considering this mineral charge, 53% of waters are of excellent quality, 27% of good quality and 20% of fair quality (Table 3), which reflects a weak anthropic influence exerted on these waters.
Chemical quality of water
The major cations of the waters in the study area have average concentrations variables according to the chemical species sought. Of the 15 samples analyzed, the mean values ​​are in the range 0.33 to 36.33 mg/L and then 4.33 to 19.67 mg/L for Ca2+ and Mg2+; from 6.27 to 183.01 mg/L then 2.07 to 5.47 mg/L and finally from 1.53 to 14.87 mg/L for Na+, K+ and NH4+ respectively (Table 1). The ammonium concentration values of waters in the study area for all seasons are greater than 0.5 mg/L (Table 1), guiding value for drinking water (WHO, 2008). However, considering separately subsurface waters represented by wells and deep-lying waters represented by boreholes, we note that the average concentrations of calcium (10.06 mg/L) and magnesium (11.11 mg/L) are higher in well water than in borehole water (5.22 and 9.15 mg/L, respectively), which reflects their contribution by training from the soil in the seepage water by lixiviation and by runoff. The average concentrations of the different cations are a little more homogeneous at the wells than the boreholes according the standard deviations that are higher in boreholes than wells (Table 4a and b).


Anionic concentrations in the study area are subject to important values variation ​​between different sampling points. Bicarbonates have a average value of 254.84 mg/L with a maximum value of 516.91 mg/L and a minimum value of 59.11 mg/L with a standard deviation of up to 148.64 mg/L (Table 1). For the chlorides the average value is 2.33 mg/L with a minimum value of 0.37 mg/L and a maximum value of 23.37 mg/L. Chlorides are more concentrated in wells with average values ​​of 4.68 mg/L than in boreholes with concentrations of 0.76 mg/L (Table 4a and b). Sulphates are weakly present with an average concentration of 2.71 mg/L with minimum and maximum values ​​of 0.33 to 22 mg/L respectively. The phosphates and nitrates have minimum and maximum concentrations of 0.00 to 1.4 mg/L then from 0.00 to 47.93 mg/L with general averages of 0.37 and 3.57 mg/L respectively. At the sight of the standard deviations obtained, it appears that the average concentrations of the different anions are more homogeneous (low standard deviations) in boreholes than in wells (Table 4a and b).
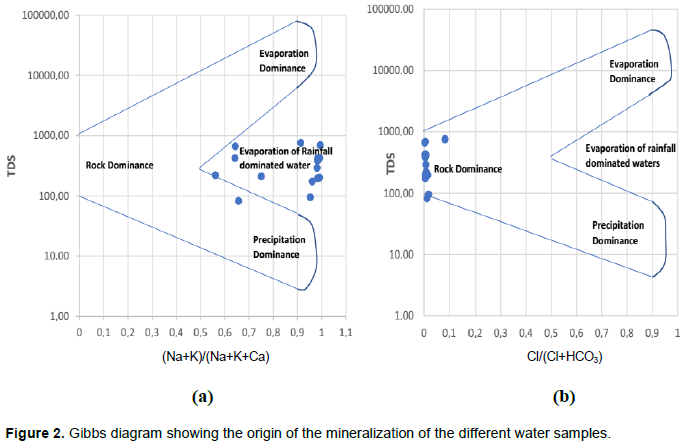
Origin of the mineralization of water
Tracing of water can allow an evaluation of the origin of dissolved ions considering the variation of the ratio of (Na+K)/(Na+K+Ca) and Cl/(Cl+HCO3) as a function of TDS. The projection of the different results obtained on the Gibbs diagram shows that the mineralization of our water is ensured on the one hand by the process of evaporation of rainfall (Figure 2) for the presence of alkalis (Na+ and K+) and on the other hand the dissolution of the minerals contained in the rock by the process of interaction water-rock for the concentration of bicarbonates. NPK elements are the main types of fertilizer used for fertilization in the area. They can migrate from the surface to end up in the deep waters. The presence of NH4+ in a concentration greater than the value allowed in the water of consumption (Table 1) can be explained by the reduction of nitrates according to the equation:
NO3- → NO2- → NH4+
and also, by the fact that at the level of the upper layers of the soil, the microorganisms involved in degradation of organic ng phosphate fertilizers or pesticides (Rodier, 2009). Considering the results of the works of matter produces nitrogen compounds (Tapsoba, 1995). The phosphate levels are on average not insignificant in our waters with an average peak of 1.40 mg/L. The presence of phosphates in groundwater is linked to discharges industrial and domestic industries, or the leaching of land containi Bateman and Kelly (2007), the second hypothesis seems the most plausible in our case study.
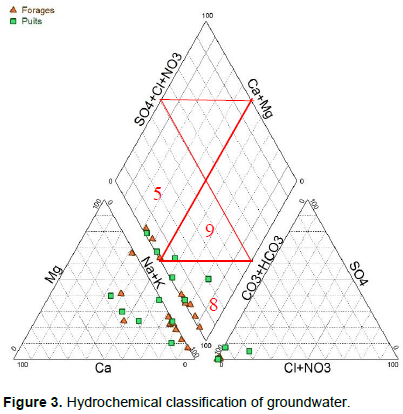
Hydrochemical facies
The analysis of the Piper diagram (1953) of all the samples shows that: ten samples, four wells and six boreholes have facies of the sodium and potassium carbonate type and meet in the cultivated areas of the irrigated perimeter of Maga East and West; the waters of two well samples (P04 and P06) and three boreholes samples (F06, F07, F09) have a facies of calcium and magnesium bicarbonate type. They characterize the facies of on both sides of the large rice-growing area of ​​Maga East and West.
In these two facies of water there is a dominance of weak acids with for the calcium and magnesium bicarbonate facies dominance of the alkaline earths (Figure 3, zone 5) and dominance of the alkalis on the alkaline earths (Figure 3, zone 8) for the carbonate facies sodium and potassium. Thus, the waters irrigated area are enriched with sodium and potassium, while bicarbonates remain the dominant anion. In contrast, in the area on both sides of the large perimeter facies do not present dominant ions. The order of importance of representatives of the major ions in the waters studied is as follows: Na+ > Mg2+ > Ca2+ > NH4+ > K+ for cations, and, HCO3- > NO3- > SO42- > Cl- for anions.
State of groundwater quality for agricultural use
Market gardening and small-scale farming are gaining momentum in the study area where groundwaters are greatly solicited through the development of private wells and boreholes. A high concentration of sodium in the irrigation water in this case leads to absorption of these ions by the clay particles by displacing the Mg2+ and Ca2+ ions. This process of exchange reduces the permeability of the soil and these soils become either anabolic, saline or compacted (Bauder et al., 2008; Oualid et al., 2018). The values of the conductivity (at 25°C) and those of the sodium absorption ratio (SAR) given by the equation.

are used to identify this risk in order to assess the suitability of water for irrigation. The clues SAR and values of conductivities at 25°C projected on the Richards diagram (Figure 4), show that 40% of the waters are in class S1C1, and 40% in the class S1C2 indicating that the waters are of excellent quality and good for irrigation. However, borehole F09 is in class S1C3 and borehole F05 in class S3C2 indicating water of poor quality for irrigation with a danger of sodicity and salinity (Bauder et al., 2008). The quality of groundwater for agricultural purposes can also be assessed using the Wilcox diagram (Figure 5) based on electrical conductivity and percentage of sodium (% Na+) which is calculated as follows (Wilcox, 1955):
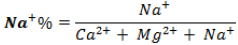
Referring to the classification of WILCOX, the waters belong to the classes "excellent" (F02, F03, F04, F06, F07, P01, P02, P03, P04, P06), "good" (F09), "allowable" (F01, F08, P05) and for a "mediocre" sample (F05). As in the case of classification from Richards (1954), the best quality waters are those with low mineralization. For in the "allowable" class, waters may be allowed to irrigate crops that are tolerant to salt on soil with good permeability.
The hydrochemical study of the groundwater of the irrigated perimeter of Maga allowed us to characterize this resource. The analysis of the physical parameters shows that the water has a pH which is near the neutral with medium mineralization. Chemically these waters have facies of the carbonate, sodium and potassium types in the perimeters of Maga East and West, then bicarbonate calcium and Magnesium characteristics located on either side of Maga’s large perimeter. The mineralization comes from two sources: on the one hand by the hydrolysis of ions contained in the rock by the water-rock interaction process and on the other hand by the degradation of organic matter resulting from agricultural activities giving rise to nitrogen compounds. Ammonium ions, orthophosphates and to a lesser extent Nitrates are the polluting elements of our waters. Overall, the water in our area remains acceptable for its use in irrigation in view of the data obtained on the diagrams of Richards and Wilcox.
The authors have not declared any conflict of interests.
REFERENCES
|
Andre L, Franceschi M, Pouchan P, Atteia O (2005). Using geochemical data and modeling to enhance the understanding of groundwater flow in a regional deep aquifer, Aquitaine Basin, south-west of France. Journal of Hydrology 305:40-62.
Crossref
|
|
|
|
Barbery J, Gavaud M (1980). Notice explicative de la Carte Pédologique du Cameroun. ORSTOM-IRAFONAREST, Paris n° 88, 58 p.
|
|
|
|
|
Bateman AS, Kelly SD (2007). Fertilizer nitrogen isotope signatures. Isotopes in environmental and health studies 43(3):237-247.
Crossref
|
|
|
|
|
Bauder JW, Bauder TA, Waskom RM, Scherer TF (2008). Assessing the suitability of water (quality) for irrigation - Salinity and Sodium.
|
|
|
|
|
Biscaldi R (1970). Carte Hydrogéologique de la plaine du Tchad Eaux souterraines Echelle: 1/200000 Notice Explicative. Yaoundé: BRGM.
|
|
|
|
|
Bouderka N, Souid AK, Lakhili F, Lahrach A, Benabdelhadi M (2016). Evaluation de l'impact de la pollution Agricole sur la qualité des eaux souterraines de la nappe du Gharb, European Scientific Journal12:11.
Crossref
|
|
|
|
|
Chebotarev NG (1950). Fundamentals of Galois Theory. 1st edition. Nordhoff Publishing. Kandern, Germany.
|
|
|
|
|
Detay M (1993). Forage d'eau: réalisation, entretien, minéralisation. Paris, Ed. Masson 380 p.
|
|
|
|
|
Djao R, Kaoussiri B, Abouna M, Achili MA (2011). Guide pratique de la gestion d'une épidémie de choléra. Ministère de la Santé Publique/SNV Cameroun.
|
|
|
|
|
El Asslouj J, Kholtei S, El Amrani-Paaza N, Hilali A (2007). Impact des activités anthropiques sur la qualité des eaux souterraines de la communauté Mzamza (Chaouia, Maroc). Revue des Sciences de l'Eau 20(3):309-321.
Crossref
|
|
|
|
|
Fadel D, Houria B, Nacer K, Michèle R, Raoul C (2007). Impact de la pollution organique sur la qualité des eaux superficielles dans le Nord-Est algérien. Sécheresse 18(1):23-27
|
|
|
|
|
Gibbs RJ (1970). Mechanisms controlling world water chemistry. Science 17:1088-1090.
Crossref
|
|
|
|
|
Guilhem B (1976). Relations entre le pH, l'alcalinité, le pouvoir tampon et les équilibres de CO2 dans les eaux nature. Lettre de l'Association (AFES) pp.145-159.
|
|
|
|
|
Hambate GV, Essomba NS, Ombolo A, Loura B (2015). Bacteriological and physicochemical characterization of water from wells in urban areas of the District of Maroua III (Far North Cameroon). International Journal of Current Trends in Engineering & Technology 1(2):43-50.
|
|
|
|
|
Hassoune EM, Bouzidi A, Koulali Y, Hadarbach D (2006). Effets des rejets liquides domestiques et industriels sur la qualité des eaux souterraines au nord de la ville de Settat (Maroc). Bulletin de l'Institut Scientifique, Rabat, section Sciences de la Vie. 28:61-71.
|
|
|
|
|
Hem JD (1989). Study and interpretation of the chemical characteristics of natural water. US Geological Survey (USGS) Water-Supply Paper 2254, 263.
|
|
|
|
|
Kelly BFJ, Timms WA, Andersen MS, McCallum AM, Blakers RS, Smith R, Rau GC, Badenhop A, Ludowici K, Acworth RI (2013). Aquifer heterogeneity and response time: the challenge for groundwater management. Crop Pasture Science pp. 1141-1154.
Crossref
|
|
|
|
|
Kengni L, Tematio P, Filali RK, Tepoule NJ, Tsafack EI, Mboumi TL, Mounier S (2012). Pollution des eaux superficielles et des nappes en milieu urbain: cas de la zone industrielle de Douala-Bassa (Cameroun). International Journal of Biological and Chemical Sciences 6(4):1838-1853.
Crossref
|
|
|
|
|
Koné M, Bonou L, Bouvet Y, Joly P, Koulidiaty J (2009). Etude de la pollution des eaux par les intrants agricoles: cas de cinq zones d'agriculture intensive du Burkina Faso. Sud Sciences et Technologies 17:6-15.
|
|
|
|
|
Kristin S, Djoret D, Aminu MB, Sara V (2014). Études de la qualité des eaux souterraines dans la plaine d'inondation du Logone inférieur en avril-mai 2013. Projet Gestion durable des eaux du Lac-Tchad. Rapport technique n°7. Hanovre 48 p.
|
|
|
|
|
Kuldip S, Hundal HS, Dhanwinder S (2011). Geochemistry and assessment of hydrogeochemical processes in groundwater in the southern part of Bathinda district of Punjab, northwest India. Environmental Earth Sciences 64:1823-1833.
Crossref
|
|
|
|
|
Larive C (1997). Apports combinés de l'expérimentation et de la modélisation à la compréhension de l'alcali-réaction et de ses effets mécaniques. Mécanique [physics.med-ph]. Ecole Nationale des Ponts et Chaussées.
|
|
|
|
|
Mbawala A, Abdou, Ngassoum MB (2010). Evaluation de la pollution physico-chimique et microbienne des eaux de puits de Dang-Ngaoundéré (Cameroun). International Journal of Biological and Chemical Sciences 14 p.
Crossref
|
|
|
|
|
Mourey V, Vernoux J (2000). Les risques pesant sur les nappes d'eau souterraine d'Ile-de-France. Annales des mines.
|
|
|
|
|
Moussa D, Nola M, Gake B, Ebang MD, Njine T (2014). Bacteriological Quality of Well Waters in Garoua, North Cameroon, Water Quality, Exposure and Health 18 p.
|
|
|
|
|
Ngounou N, Mudry J, Aranyossy JF, Naah E, Sarrot RJ (2007). Apport de la géologie, de l'hydrogéologie et des isotopes de l'environnement à la connaissance des "nappes en creux" du grand Yaéré (Nord Cameroun). Revue des Sciences de l'Eau 1(20):29-43.
Crossref
|
|
|
|
|
Oualid B, Azeddine M, Zeineddine N, Benoit L (2018). Hydrogéochimie, et variations spatio-temporelles de la qualité des eaux souterraines dans le bassin versant de Boumerzoug -Nord Est Algérie. Sciences & Technologie D-N°47:31-41.
|
|
|
|
|
Piper AM (1953). A graphic procedure in the geochemical interpretation of water analyses. Ground water Notes No. 12, USGS. P 14.
|
|
|
|
|
Richards LA (1954). Diagnosis and improvement of saline and alkalisoils. Agric. Handbook 60, USDA, Washington D.C. P 160.
|
|
|
|
|
Rodier J, Legube B, Merlet N (2009). L'Analyse de l'Eau. 9è édition. Dunod: Paris 1579 p.
|
|
|
|
|
Sara V, Charlotte W, Djoret D, Aminu MB (2016). Interaction entre les eaux souterraines et les eaux de surface dans les plaines inondables du Bas-Logone. Projet gestion durable des eaux du Lac-Tchad. Rapport technique n°10.Hanovre 55 p.
|
|
|
|
|
Schneider JL, Wolff JP (1992). Carte Géologique et Carte Hydrogéologique 1/1500000 de la république du Tchad Mémoire Explicatif Vol. 1. Orléance, France: BRGM. N°209.
|
|
|
|
|
Seignobos C, Moukouri HK (2000). Potentialités des sols et terroirs agricoles: Atlas de la Province de l'Extrême-Nord Cameroun P 3.
|
|
|
|
|
Simler R (2007). Logiciel Diagramme 4.0. Université d'Avignon, France.
|
|
|
|
|
Tapsoba SA (1995). Contribution à l'étude Géologique et Hydrogéologique de la région de Dabou (Sud de la Côte d'Ivoire): Hydrochimie, isotopie et indice de vieillissement des eaux souterraines. Thèse de Doctorat 3ème cycle, Université Nationale de Côte d'Ivoire P 200.
|
|
|
|
|
World Health Organization (WHO) (2008). Guidelines for Drinking-water Quality -Third Edition Incorporating the First and Second Addenda. Geneva: World Health Organization.
|
|
|
|
|
Wilcox LV (1948). The quality of water for agricultural use. US Dept Agriculture Technical Bulletin vol. 962, Washington DC.
|
|
|
|
|
Wilcox LV (1955). Classification and use of irrigation waters. U.S. Department of Agriculture Circular 969. Washington, DC: U.S. Department of Agriculture P 19.
|
|