ABSTRACT
Recently, forest land grant for investment which is often misquoted as bare land is posing a challenge to biodiversity conservation efforts in the Majang Zone of Gambella Region, Ethiopia. On the other hand, Majang zone has always been known for dense forest cover and rich biodiversity; but recently threatened due to plantation investment. In order to tackle such prevailing problems, timely information about past and existing land- use/cover scenarios is needed. This study therefore aim to drive reliable information about land-use/cover trends for the last 30 years using Remote Sensing techniques. Landsat Thematic Mapper (TM) for year 1987 and Landsat 8 Operational Land Imager (OLI) for year 2016 were used for image classification. By applying all the approaches and algorithms recommended for image classification, six major land-use/cover classes were identified. The landscape ever covered with dense forest was dramatically updated to new land-use/cover. The 1987 land-use/cover map put forest as the major land cover accounted for 86.73%. However, findings from recent satellite image uncovered new land-use/cover class-plantation accounted for16.16 % that comes out of almost none existent land use pattern in 1987. The result also showed that agricultural land and settlement expanded at alarming rate (3.4 and 0.13 hectare) per year respectively but, the forest cover is the most altered part decreasing by 0.32 hectare per year. Thus, it is important to take urgent action against further conversion of forest to other land cover class, which might have negative impacts in advance on the remaining natural forest.
Key words: Remote Sensing technique, Landsat image, Land-use/cover change.
Concepts related to land use and land cover activities are closely related and in many cases have been used interchangeably. However, land cover is the material or the observed cover at the ground, such as vegetation, grass,crops, water, asphalt, etc. (Gómez et al., 2016), whereas, land use-refers to man’s activities on land which is directly related to the land (Kaul and Sopan, 2012; Martínez and Mollicone, 2012; Rujoiu-Mare and Mihai, 2016). Remote sensing imaging cannot detail the land use being used directly like natural or artificial land cover. It is thus, up to interpreters to identify simply using patterns, tones, texture, shapes, site association to acquire information and as well as field and ground information such as surveys and census. Knowledge about land-use/cover dynamics is becoming important as the nation plans to overcome the problems of uncontrolled development and deteriorating of biodiversity or environmental quality as a whole (Alqurashi and Kumar, 2014; Madugundu et al., 2014; Tilahun and Teferi, 2015). Majang zone was known for its dense forest cover and rich biodiversity conservation but recently threatened by land pressure due to plantation investment. This challenge is currently being fueled and aggravated by forest land granting or grabbing which often misquoted as bare land or lacks signs of agriculture. Initially, forest land awarding for investment is approached to positively impact the communities and to bring ecologically sustainable economic development to the area but they failed to keep the promises (Saturnino and Franco, 2011).
Such trends are very common in the study area and currently experienced serious challenges that holding back many biodiversity conservation efforts. Inviting investment particularly to areas where jungle forest exist needs prior information to overcome the problem of uncontrolled development that discount biodiversity quality (Selçuk, 2008; Mishra et al., 2014). In order to tackle such prevailing problems, it needs dynamic information about past and present land-use/cover scenarios. For better environmental analysis and making sound decisions, reliable information about the land-use/cover is vital (Basanna and Wodeyar, 2013;Tilahun and Teferi, 2015; Rawat and Kumar, 2015; El-Hattab, 2016).The Remote Sensing technique is a very advanced method and has great role for obtaining timely and valid information about land cover status (Fu, 2003; Manandhar et al., 2009; Blaschke, 2010; Subhash, 2012; Fichera et al., 2012; Forkuo and Frimpong, 2012; Baynard, 2013;Esmail et al., 2016; Haque and Basak, 2017; Wang et al., 2017). This study was, therefore, aimed to derive reliable information about land-use/cover trends for the last 30 years using Remote Sensing techniques.
Study area description
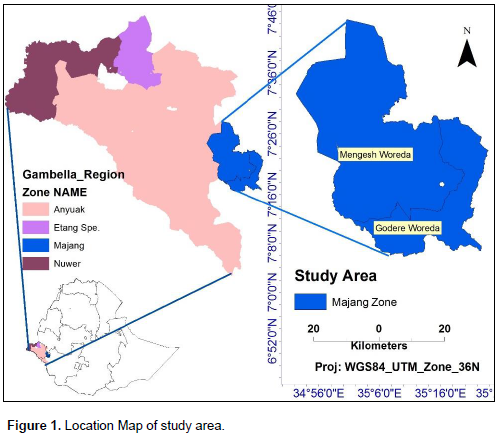
Majang zone is one of the three administrative zones found in Gambella region with capital town Meti. The region has three zones namely: Anyuak, Majang and Nuer and with one special woreda (Itang). The relative location of the study area is bordered on the east by Southern Nations and Nationalities and Peoples Region (SNNPR), on the west by Anyuak zone and on the north by Oromia region. Absolutely, the Majang zone is located on latitude 7° 4’ 2.41’’N to 7° 46’ 47.79’’N and longitude 34° 36’ 30.54 E’’ to 35° 38’ 48.00’’ E. It has two woreda: Godere and Mengesh, which constitute the study area (Figure 1). This study area was selected for change detection due to recent plantation investment pressure.
Data sources
Both primary and secondary data were used: Ground control points (GCP) for ground truthing was collected as primary data using GPS handheld technology for creating signature or training site. Whereas, secondary data like Landsat Thematic Mapper (TM) for year 1987 and a very recent Landsat data that is Landsat 8 Operational land imager (OLI) images for the year 2016 were accessed directly from recommended and freely available websites from United States Geological Survey (http:// glovis.usgs.gov) online imagery portals. All Landsat images utilized for this research were geometrically-corrected level 1T (L1T) data. Other Geo-spatial data like Shapefiles, and topographic maps were collected from Central Statistical Agency (CSA) and Ethiopian Mapping Agency (EMA) for extraction and delineation of area of interest.
Data setting method
Prior to full-fledged image classification process, image preprocessing operation were carried out. These include image geo-referencing (Geometric corrections and Rectification), image enhancement (Spectral and Spatial), and false color composite for simple visualization or discrimination of scene in image. By using ERDAS IMAGINE 9.2 software, image-to-image registration or image-to-map rectification using ground control points were easily checked for exact alignment of image to area of interest (Alemu et al., 2015). Image enhancement was done for making an image more interpretable to the human eye. The technique used in image enhancement depends on objectives, data, expectations, and backgrounds. In addition to image enhancement, making False Color Composite (FCC) also better results in various shades and tones of red color observed for healthy chlorophyll-rich vegetation image. The schematic diagram (Figure 2) shed light on the entire procedures and processing of raw satellite image data from image acquisition to change analysis.
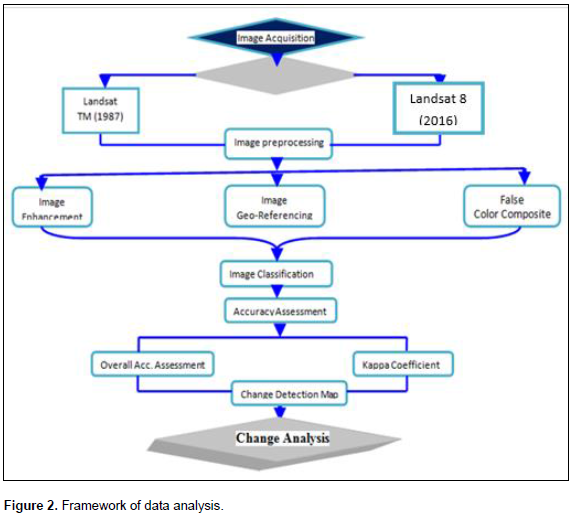
Image processing and analysis
Many image processing and analysis techniques have been developed to aid the interpretation of remote sensing images and to extract as much information as possible from the images.
Image preprocessing
Prior to any data analysis, initial processing on the raw satellite image data was usually carried out to correct any distortion. Some standard correction procedures done; like radiometric correction to correct uneven sensor response over the whole image and geometric correction to correct geometric distortion due to Earth's rotation. Hence, distortions related with raw image data can be handled using ERDASIMAGINE 9.2 software and the HANTS (Harmonic Analysis of Time Series) algorithm. Harmonic Analysis of Time Series algorithm with special consideration was used particularly for screening cloud contaminated images and there for temporal interpolation to compensate the missing observation for particular time. Most of the Landsat images were geometrically corrected so there was no need for geo-referencing except geometrically correcting to align into particular map projection system.
Image enhancement
In order to aid visual interpretation, hazy visual appearance of the unenhanced objects in the image were improved by image enhancement techniques such as grey level stretching to improve the contrast and spatial filtering for enhancing the edges. For making image enhancement, different methods of image enhancement were used to prepare the "raw data" so that the actual analysis of images became easier, faster and more reliable.
Determining number of classes mapped
The type and number of land-use/cover categorization must be determined based on land capability, vulnerability of present land use to certain management practices and potential for any particular activity. To this end, the preliminary field survey observation was conducted for the area under consideration and inaccessible areas were sensed with the help of topographic maps and Google Earth. Finally, six land cover classes were identified for the Majang Zone. The following were categories of land classes and their descriptions:
1) Forest Land: area with high density of forest with little or no disturbance.
2) Woodland: areas with open canopy that permits under growth of grass or shrubs.
3) Agricultural land: areas covered with predominantly small household mosaic agricultural farms, cultivated land and cultivable land.
4) Water body: area which holds water (lakes), rivers and marshy land most of the time.
5) Settlement land: areas covered with both towns and rural settlement areas.
6) Plantation land: areas covered with coffee and tea plantation (for recent images).
To classify and verify these major land-use/cover types, training sites were prepared. On the number of ground truth data sampling, there is no single ideal method of ground truth data sample taking that the scientists are subjective on the number of points collected. However, Congalton (1991) suggested 50 ground control points for single class as minimum requirements for GPS based reading. But, what is recommended most of the time was taking more GPS readings for a single class of feature for training computer and creating signature. The more points collected, the lower the standard error. For these land classes, a total of 480 ground control points were collected during field survey using GPS. Additional information collected by using google earth and interviewing elderly people who saw the changes happened in the area. From 480 ground control points, 60% of the ground truth was used for training purpose keeping out the other 40% for validation.
Image classification method
Classification is the process of sorting pixels into a finite number of individual classes, or categories of data based on their data file values. In this study, both supervised and unsupervised classification methods were adopted. Unsupervised classification method was used first to have an idea representing overall land use and land cover cluster of pixels. Thereafter, supervised classification method was used with Maximum Likelihood Classification algorithm. This algorithm unlike others considers the spectral variation within each category and the overlap covering the different classes (Rientjes et al., 2011; Rawat et al., 2013). Knowledge of the data, the classes desired, and the algorithm used was required before selecting training samples. Every pixel in the whole image was then classified as belonging to one of the themes depending on how close its spectral features are to the spectral features of the training areas. Finally, the classified image was verified for its accuracy or acceptance having gone through different mechanisms assuming that resulting class corresponds against ground truth field samples often obtained with a GPS.
Land-use/cover dynamics between 1987 and 2016
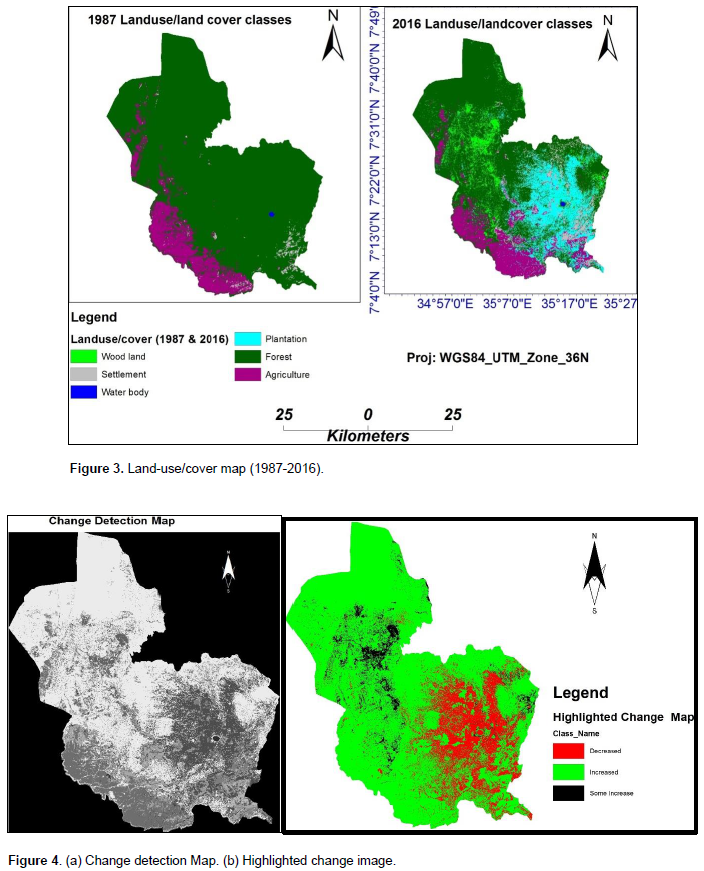
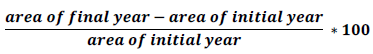
Comparison of change dynamics was made by classifying images from 1987 and 2016 years, respectively. By doing so, the classification result revealed the increment or decrease of some classes at the expense of other classes. Figure 3 shows the dynamics of land cover classes after 30 years. Having these two different time period images, it is therefore possible to produce change detection image just by subtracting the before image (1987) from the after image (2016). Since change detection calculates change in brightness values over last 30 years’ time, the image difference file reflects that change using the grayscale image. The highlighted change image is basically a five-class thematic image, typically divided into the five categories of background, decreased, some decreased, unchanged, some increase, and increased. But depending on user defined value or percent input, class thematic image finally produced can vary in number. Based on user defined value (Figure 4b), the thematic image was classed as: decreases, increased and some increased. Quantification of land-use/cover change through 30 years’ time series is very important due to domination or recession of some features class by others. Unless one zooms out and zooms in to particular themes, one might never sense the change due to the compactness of the produced map.

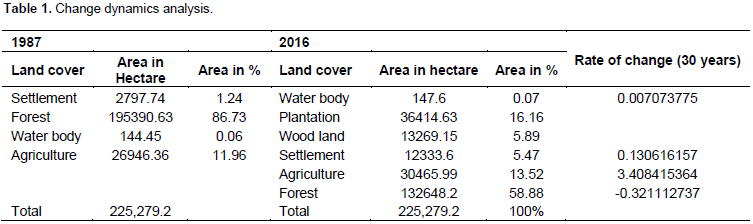
Hence, Table 1 clearly indicates each class change in hectare as well as in percent for better understanding of change dynamics. The major land-use/covers of Majang were forest, wood land, agricultural land, plantation, settlement and water body. The rate of change was also calculated for better understanding of change either increasing or decreasing hectare per year. The change detection was carried out using individual image classification area to identify the changes in the period 1987-2016 by using the formula:


During 1987, Majang Zone was one of the forest dominant sites. The 1987 land-use/cover map produced from Landsat Thematic Mapper reveals forest as the major land cover which covers almost all parts of the Zone. It covers 195,390.63 ha (86.73%) of zone followed by agriculture, settlement and water body which covers 26,946.36 ha (11.96%), 2,797.74 ha (1.24%) and144.45 ha (0.06%), respectively. The spatial distribution of the different land-use/covers and rate of change through passage of 30 years is detailed in Table 1. For year 2016, a recent satellite image data [Landsat 8 Operational Land Imager (OLI)] were used to discriminate the recent scenes of the zone so as to compare and describe change that has gone through 30 years. Accordingly, the most striking changes happened to the area after 30 years. Despite this change, the result still indicates that forest covers large part of the area (Table 1). Finding from classified recent satellite image uncovered new land-use/cover class (plantation) accounted for 16.16 hectare that came out of none existent land use pattern in the year 1987. The result also showed that agricultural land expansion had been increasing at an alarming rate among others that is 3.4 hectare per year, followed by settlement that accounted for 0.1 hectare per year. Regarding water body, the change was insignificant when compared to others. But, the forest cover was the most altered part of land cover decreasing at 0.32 hectare per year. The above change generally was an indication of the change which happened to the area updating the rural landscape to new scenario. Studies made on some African countries (Tsegaye et al, 2010; Jayne et al., 2014) also justified updating of rural landscape due to investment induced reasons.
Confusion matrix
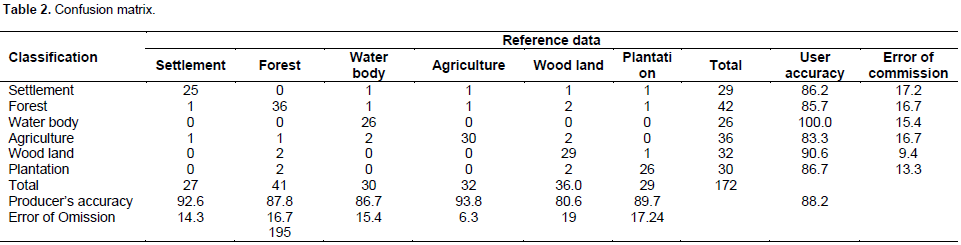
The classified image was verified for its accuracy or acceptance having gone through different mechanisms assuming that resulting class corresponds against ground truth field samples often obtained with a GPS (Hegazy and Kaloop, 2015; Haque and Basak, 2017). Therefore, it is common practice to create a confusion matrix to assess the accuracy of an image classification (Butt et al., 2015). Table 2 indicates the strength of a confusion matrix, the nature of classification errors and their quantities. In general, the overall accuracy assessment was about 88.2% and its kappa coefficient more than 0.80 indicate good classification (Adam et al., 2013) and thus, it was about 0.89 meaning that there is 89% better agreement than by chance alone. Diagonal values represent sites classified correctly according to reference data whereas off-diagonals indicate mis-classified classes.
The transition matrix
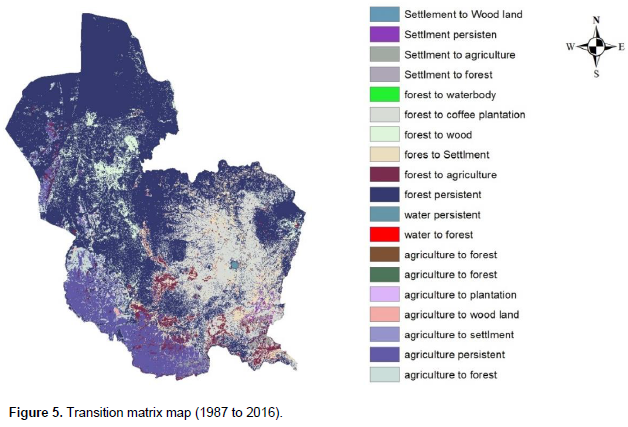
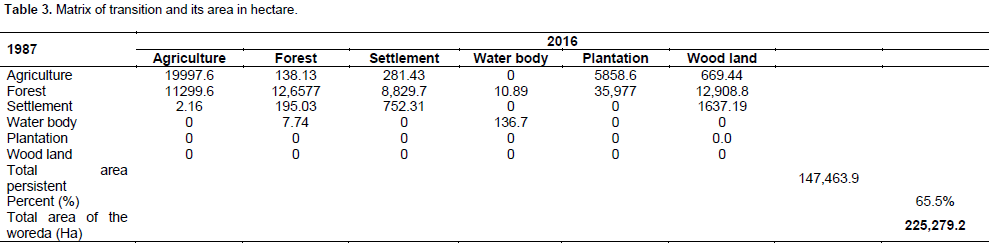
This section highlights on classes that indicate areas of overlap and transition of particular class type to other types of classes. The finding also visualized the most abused classes among others that need urgent intervention. When we say forest area shows a significant reduction over time (Table 1), this may appear vague to policy makers to take any intervention actions toward forest conservation. Hence, it is usually important to analyze the transition matrix (Figure 5) that avoids confusion in detailing to what class’s type some class was converted. Moreover, the transition matrix aid to know undisturbed and altered areas due to conversion to other classes and generally gives mental picture for decision. The diagonal values indicate the classes that had never changed or altered throughout 30 years. Whereas the off-side values in hectare indicates transition of year 1987 particular class cover to year 2016 class type. Generally, the overall persist percent of the different land-use/cover is 65.5%. Between two time periods (1987 to 2016), 35,977 area of hectare of forest was converted to plantation (Coffee). Forest cover also damaged becauseof its conversion to woodland and agriculture to the tune of 12,908.8 and 11,299.6 hectare respectively. The other significant change was also observed in the case of forest to settlement transition (8,829.7 ha). The conversion of agriculture to plantation and woodland also cannot be taken as lightly when compared to others. As indicated in Table 3, 10.89 hectare of forest cover was converted to water body. This happened due to overshadowing of riparian forest along rivers and was classified as forest since 1987. However, the forest domination ended due to its conversion to wood land and uncovered some portions of river when observed with the recent satellite image. It is because of this reason that the result seems unrealistic.

In the landscape of Majang zone of southwest Ethiopian, land-use/cover changes had occurred in the last three decades. Applying all the approaches for change detection, six major land-use/covers were identified and increment or decrease in some classes due to their conversion through passage of time at the expense of other classes was observed in study area. The overall persistence percent of the different land-use/cover is 65.5%. The most dynamic change and damage was done to the forest as it was scrambled for different land-use/cover classes. The 1987 land-use/cover map put forest as the major land cover which covers almost all parts of Majang Zone (195,390.63 hectare). However, findings from recent classified satellite image uncovered new land-use/cover class (plantation) accounted for 16.16 % that came out of almost none existent land use pattern in 1987. The result also revealed that agricultural land expansion increases at an alarming rate (3.4 hectare) per year, succeeded by settlement (0.13 hectare) per year. But, the forest cover is the most endangered part of land cover decreasing at 0.32 hectare per year. For long period of time, the area was known for its shift cultivation and this was the reason for the alteration of forest, agriculture and settlement classes to woodlands. Plantation takes the highest portion of land in hectare (16.16%) among others due to its recent rapid expansion in the area as seen in the recent satellite images. Generally, the landscape ever covered with dense forest was dramatically updated to new land-use/cover classes. Thus, it is important to prevent or take urgent action against further conversion of forest to other land cover class types, which might have negative impacts in advance on the remaining natural forest.
The authors have not declared any conflict of interests.
This study was financially supported by Swedish International Development agency (Sida), as parts of project entitled “Improving the life of communities and conserving the environment in Majang Zone, Gambella region” managed by Movement for Ecological Learning and Community Action (MELCA-Ethiopia).
REFERENCES
|
Adam AHM, Elhag AMH, Salih, Abdelrahim M (2013). Accuracy Assessment of Land Use & Land Cover Classification (LU/LC) "Case study of Shomadiarea-Renk County-Upper Nile State, South Sudan. Int. J. Sci. Res. Pub. 3(5):1-6.
|
|
|
|
Alemu B, Garedew E, Eshetu Z, Kassa H (2015). Land Use and Land Cover Changes and Associated Driving Forces in North Western Lowlands of Ethiopia. Int. Res. J. Agric. Sci. Soil Sci. 5(1):28-44.
|
|
|
|
|
Alqurashi AF, Kumar L (2014). Land Use and Land Cover Change Detection in the Saudi Arabian Desert Cities of Makkah and Al-Taif Using Satellite Data. Adv. Remote Sens. 3:106-119.
Crossref
|
|
|
|
|
Basanna R, Wodeyar AK (2013). Supervised Classification for LULC Change Analysis. Int. J. Comput. Appl. 66:21.
|
|
|
|
|
Baynard CB (2013). Remote Sensing Applications: Beyond Land-Use and Land-Cover Change. Adv. Remote Sens. 2:228-241.
Crossref
|
|
|
|
|
Blaschke T (2010). Object based image analysis for remote sensing. ISPRS J. Photogramm. Remote Sens. 65:2-16.
Crossref
|
|
|
|
|
Butt A, Shabbir R, Ahmad SS, Aziz N (2015). Land use change mapping and analysis using Remote Sensing and GIS: A case study of Simly watershed, Islamabad, Pakistan. Egypt. J. Remote Sens. Space Sci. 18:251-259.
Crossref
|
|
|
|
|
Congalton RG (1991). A Review of Assessing the Accuracy of Classifications of Remotely Sensed Data. Remote Sens. Environ. 37:35-46.
Crossref
|
|
|
|
|
El-Hattab MM (2016). Applying post classification change detection technique to monitor an Egyptian coastal zone. Egypt J. Remote Sens. Space Sci.19:23-36.
Crossref
|
|
|
|
|
Esmail M, Masriab A, Negm A (2016). Monitoring Land Use/Land Cover Changes around Damietta Promontory, Egypt, Using RS/GIS. Procedia Eng.154:936- 942.
Crossref
|
|
|
|
|
Fichera CR, Modica G, Pollino M (2012). Land Cover classification and change-detection analysis using multi-temporal remote sensed imagery and landscape metrics. Eur. J. Remote Sens. 45:1-18.
Crossref
|
|
|
|
|
Forkuo EK, Frimpong A (2012). Analysis of Forest Cover Change Detection. Int. J. Remote Sens. Appl. 2(4):82-92.
|
|
|
|
|
Fu C (2003). Potential impacts of human-induced land cover change on East Asia monsoon. Glob. Planet. Chang. 37:219-229.
Crossref
|
|
|
|
|
Gómez C, White JC, Wulder MA (2016). Optical remotely sensed time series data for land cover classification: A review. ISPRS J. Photogramm. Remote Sens. 116:55-72.
Crossref
|
|
|
|
|
Haque MI, Basak R (2017). Land cover change detection using GIS and remote sensing techniques: A spatio-temporal study on Tanguar Haor, Sunamganj, Bangladesh. Egypt. J. Remote Sens. Space Sci. 20(2):251-263.
Crossref
|
|
|
|
|
Hegazy IR, Kaloop MR (2015). Monitoring urban growth and land use change detection with GIS and remote sensing techniques in Daqahlia governorate Egypt. Int. J. Sustain. Built Environ. 4:117-124.
Crossref
|
|
|
|
|
Jayne TS, Chamberlin J, Headey DD (2014). Land pressures, the evolution of farming systems, and development strategies in Africa: A synthesis. Food Policy 48: 1-17.
Crossref
|
|
|
|
|
Kaul HA, Sopan I (2012). Land Use Land Cover Classification and Change Detection Using High Resolution Temporal Satellite Data. J. Environ. 1(4):146-152.
|
|
|
|
|
Madugundu R, Al-Gaadi KA, Patil VC, Tola E (2014). Detection of land use and land cover changes in Dirab region of Saudi Arabia using remotely sensed imageries. Am. J. Environ. Sci. 10(1):8-18.
Crossref
|
|
|
|
|
Manandhar R, Odeh IOA, Ancev T (2009). Improving the Accuracy of Land use and Land Cover Classification of Landsat Data Using Post-Classification Enhancement. Remote Sens. 1:330-344.
Crossref
|
|
|
|
|
Martínez S, Mollicone D (2012). From Land Cover to Land Use: A Methodology to Assess Land Use from Remote Sensing Data. Remote Sens. 4:1024-1045.
Crossref
|
|
|
|
|
Mishra VN, Rai PK, Mohan K (2014). Prediction of Land Use Changes Based On Land Change Modeler (Lcm) Using Remote Sensing: A Case Study of Muzaffarpur (Bihar). J. Geogr. Inst. Cvijic. 64(1):111-127.
Crossref
|
|
|
|
|
Rawat JS, Kumar M (2015). Monitoring land use/cover change using remote sensing and GIS techniques: A case study of Hawalbagh block, district Almora, Uttarakhand, India. Egypt J. Remote Sens. Space Sci.18:77-84.
Crossref
|
|
|
|
|
Rawat JS, Biswas V, Kumar M (2013). Changes in land use/ cover using geospatial techniques: A case study of Ramnagar town area, district Nainital, Uttarakhand, India. Egypt J. Remote Sens. Space Sci. 16:111-117.
Crossref
|
|
|
|
|
Rientjes THM, Haile AT, Kebede E, Mannaerts CMM, Habib E, Steenhuis TS (2011). Changes in land cover, rainfall and stream flow in Upper Gilgel Abbaycatchment, Blue Nile basin – Ethiopia. Hydrol. Earth Syst. Sci. 15:1979-1989.
Crossref
|
|
|
|
|
Rujoiu-Mare MR, Mihai BA (2016). Mapping Land Cover Using Remote Sensing Data and GIS Techniques: A Case Study of Prahova Subcarpathians. Procedia Environ. Sci. 32:244 -255.
Crossref
|
|
|
|
|
Saturnino M. Borras JR, Franco JC (2011). Global Land Grabbing and Trajectories of Agrarian Change: A Preliminary Analysis. J. Agrarian Chang. 12(1):34-59.
|
|
|
|
|
Selçuk R (2008). Analyzing Land Use/Land Cover Changes Using Remote Sensing and GIS in Rize, North-East Turkey. Sensors 8:6188-6202.
Crossref
|
|
|
|
|
Subhash A (2012). Monitoring Forests: A New Paradigm of Remote Sensing & GIS Based Change Detection. J. Geogr. Inform. Syst. 4:470-478.
Crossref
|
|
|
|
|
Tilahun A, Teferi B (2015). Accuracy Assessment of land use land cover classification using Google Earth. Am. J. Environ. Protect. 4(4):193-198.
Crossref
|
|
|
|
|
Tsegaye D, Moe SR, Vedeld, Aynekulu E (2010). Land-use/cover dynamics in Northern Afar rangelands, Ethiopia. Agric. Ecosyst. Environ. 139:174-180.
Crossref
|
|
|
|
|
Wang Z, Schaaf CB, Sun Q, Kimd J, Erb AM, Gaoe F, Román MO, Yang Y, Petroy S, Taylor JR, Masek JG, Morisette JT, Zhangi X, and Papuga SA (2017). Monitoring land surface albedo and vegetation dynamics using high spatial and temporal resolution synthetic time series from Landsat and the MODIS BRDF/NBAR/albedo product. Int. J. Appl. Earth Obs. Geoinform. 59:104-117.
Crossref
|
|