ABSTRACT
Globally, wetlands are recognized as the most productive ecosystems due to sustaining a wide range of biodiversity and for providing goods and services to nearby communities. The study was carried out in three wetlands in Ethiopia; namely, Adele, Teneke and Haramaya. The data was collected from January 2016 to May 2016 in the villages which are in proximity to the wetlands to determine the degree of dependency on the wetland. Wetland physicochemical data was collected onsite using portable kits for the work. The study revealed that annual service rendered by the wetlands is 34956.62 in Ethiopian Birr. The biological oxygen demand, which is taken as an indicator for pollution was greater in all the sampling sites of Adele. The highest concentration (6.3 mg/L) was recorded at Adele 3(A3). The conservation practice designed by the local community initiative was low. From the five measures recommended, only one activity is done to conserve the wetland. The consumers’ willingness to conserve services suggests that they are not willing to conserve the wetland. The study indicates that the socio-economic structure of the society is significant in their willingness to conserve and also to restore the wetlands. Educational level of the respondents is significantly affecting their willingness for conservation scheme.
Key words: Physicochemical, ecosystem, service rendered, willingness to conserve.
Biodiversity plays a vital role in the existence of life on the earth’s surface (Collings 2009). Among the most vital ecosystems of the world, wetlands provide a wide range of benefits in economical, biological, ecological, social, and cultural functions and services to human beings (Barbier et al., 1997; Fisher et al., 2008). The estimated size of wetlands is approximately 12.8 million km2 (Finlayson et al., 1999) and wetlands generally cover about 6.4% of the surface of the earth. Reportson the status of the wetlands show that more than half of the wetland cover has been lost since the 1950s due to anthropogenic effect (Moser et al., 1996). America one of the developed countries, has lost 87 million hectares of wetland and in the same way, European countries like the Netherlands, Germany, Spain, Italy, Greece and Portugal have lost 55, 67, 57, 60, 66 and 63% of their total wetlands, respectively (MEA, 2005a; MEA, 2005b; Tiner, 1984) within in the last decades. In addition to these, within the past 60 years, Philippines has lost 300,000 hectares (67%) of its wetland ecosystems
In Africa due to the mismanagement of ecosystems, changes take place at an alarming rate. Land use and land cover potential changes are common due to development reasons (Jordan et al., 2003). Although in Africa, savannahs and hot deserts are common, wetlands covered a significant part of the continent. The coverage is estimated to be between 1 and 16% or 220,000 and 1,250,000 km2of the total land mass of the continent (Koohafkan et al., 1998)
Economic valuation of ecosystems is defined by economists, ecologists and sociologists and other professionals in different ways. The economic value of good is defined by economists as the difference between willingness to pay for the good or service and the cost of supplying it. Economic valuation is an attempt to assign values in terms of market price for the good and service offered by the ecosystem. Communities are using the products and services provided by natural resources without incurring any cost. Therefore the value of such resources is our willingness to pay to them alone (Barbier et al., 1997).
Wetlands provide diverse economic, social, cultural, and ecological goods and services which are crucial for the livelihood of the society (Siew et al., 2015). The value of some of these functions and services could be determined by the market forces of demand and supply. However, many of them have non-market values. Therefore, the total economic values (TEV) of wetland ecosystems like other environmental resources are disaggregated into two broad categories of use and non-use values (Barbier et al., 1997; Hanley et al., 2006).
Almost all types of wetlands are found in Ethiopia except coastal and marine-related wetlands. The extensive swamp-forest complexes are found and they are estimated to cover more than 2% of the area or 22500 km2(Deribe, 2007). In Ethiopia, wetlands such as riverine, lacustrine, alpine formations, palustrine and floodplain are common in different parts of the country. The wetlands are located in Lake Tana, Ashenge, Bale Highlands, Western Highlands, Lakes of Bishoftu, South west Rift Valley, Awash River System, Afar Depression, Western River Floodplains, Central Ethiopian Highland Wetland Complex, e.t.c (Hailu, 2003).
Although Ethiopian wetlands provide a wide range of benefits, several of them have either disappeared or are at the verge of complete drying, due to mismanagement and inappropriate utilization. In Ethiopia, the recent total drying up of Lake Haramaya and the precarious existence of Lake Abijata are clear indications for the looming danger on the ecosystem. Many of the wetland ecosystems of Africa including Ethiopia are drying up and disappearing, but it is difficult to quantify the loss due to limited research work on wetland resources. This research aims to quantify the ecosystem service rendered by the wetlands.
Study area description
The study was carried out in three selected wetlands of eastern Hararghe (that is Teneke, Haramaya and Adele wetlands). The total area coverage of the study area is about 550sq.km. The largest ethnic groups represented in this region are Oromo (96.04%) and Amhara (3.12%), all other ethnic groups makes up to 0.84% of the population (Table 1). The dominant language spoken in the district is Afan Oromo (about 95%) while Amharic is spoken only by 4.44% of the population, and the remaining 0.56% by other languages. The majority of inhabitants are Muslims, about 95.82% and the remaining 3.71% are Orthodox Christians or followers of other religions (CSA, 2015).

Topography of the district is characterized by sloppy and gorges due to runoff water. Altitude of the district ranges from 1400 to 2340 m above sea level. The highest positions are in the districts of Dof and Jaldo. 60.1% of land is cultivatable, 2.3% is pasture land, 1.5% is forestland and 36.1% of the land is degraded or unusable (Haramaya Woreda Agriculture and Rural Development office, 2016).
Climatically, the district falls within medium altitude and lowland agro ecological zones. The mean annual temperature is about 22°C with maximum temperature of 31°C and minimum temperature of 12°C. The mean annual rainfall ranges between 700-1350 mm.
Method of data collection
A contingency valuation technique was applied for the economic survey of wetlands. Participatory approach was carried out to collect data through questionnaire from the villages.
The selected households were subjected to standardized questionnaire. The questionnaire requested to quantify the use values including fishing, water use for domestic purpose and irrigation. The dependency on the water was also surveyed through the questionnaire. The indirect usage of the water was also surveyed by associating the questions with the usage of ground water and manmade ponds.
Survey was carried out from January 2016 to May 2016 in the villages which are in proximity to the wetlands of Adele, Teneke and Haramaya to determine the degree of dependency on the wetlands. Samples were selected from the total households in the villages and they were randomly selected for the household questionnaire. For the structured questionnaire a total of 250 wetland dependent households were surveyed in these villages. Seventy five to ninety questionnaires were distributed per village and 223 questionnaires were returned. Pre-test was conducted to check the instruments understandability by respondents.
The physicochemical parameters were determined by using on-site examinations and subsequently a few of them were measured under laboratory conditions. Parameters like temperature, conductivity (Knick Portamess® 911 conductivity meter), pH (Knick Portamess® 911 pH meter) and oxygen saturation (Knick Portamess® 911 oxygen probe), were measured on-site at each sampling site.
Contingent valuation technique was used which is regarded as superior to the others interms of its validity and reliability for valuation of the environment as in Birol et al. (2005).The technique directly assesses WTP (willingness to pay) or WTA (willingness to accept) for a particular environmental outcome. The technique measures both the use and the non-use values of a given environmental resource (Cameron, 1988). The responses were regressed against the number of socio-economic and attitudinal characteristics of respondents, the availability of substitutes as well as price in cases where a discrete choice format is used.
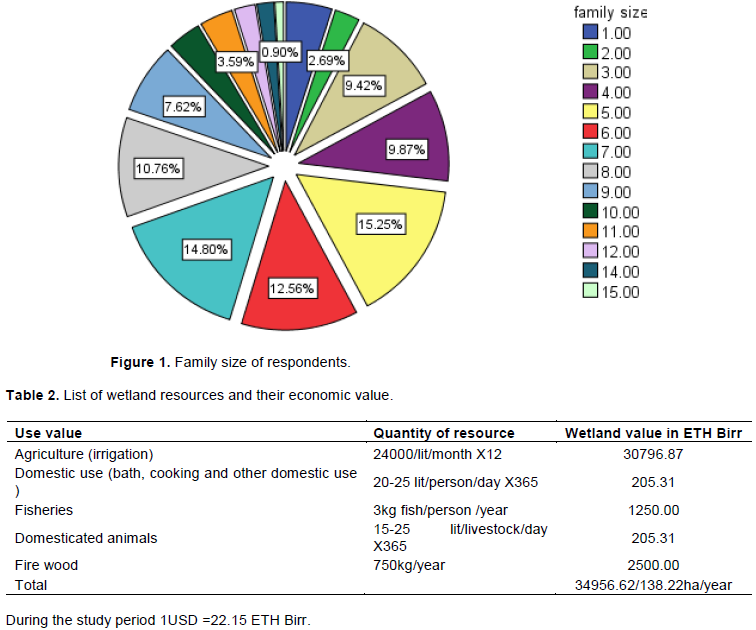
The family structure of the respondents indicates that among the total of 223 respondents, 34 (15.25%) had 5 family members followed by 33 (14.08%), 28 (12.56%) and 24 (10.67%) respondents having 7, 6 and 8 family members, respectively. The highest family size recorded was 15 members of 2 families (Figure 1). The total respondents’ family size ranged from 1 to 15 family sizes.
The average family size was 6.
Socio economic survey
A total of 223 respondents from the villages surrounding the wetlands were identified to evaluate the level of dependency for the goods and services rendered by the Adele Haramaya and Teneke wetlands. The goods and services delivered by the wetlands are listed in Table 2. The direct uses of the wetlands are for domestic use, agriculture, household and fodder for domesticated animals.
Domestic use
The society living around the wetlands are dependent on the wetland. Due to the wetland shortage of water in the wetlands, the society gets their water supply from groundwater and manmade ponds. Among the respondents, 158 of them use manmade ponds while 45 of them use underground water and 20 use both underground water and their pond for drinking, irrigation, washing cloth and other activities. On average individuals in the family utilize 150 liter of water per day. The average cost for a litter of water is 0.25 cent in Ethiopia. The dependency value is 3.75ETH birr per day, which annually amounts to1368.75 cent in Ethiopian currency (1 Birr is equal to 100 cents). The drinking water if bottled, could amount to 109500.00 ETH Birr per household per year.
Agriculture
In the wetland villages, the farmers obtain their cash income largely from farming a cash crop known as chat (Chata edulis). Among the respondents, 145 (65 %) were dependent on agriculture, the rest of the respondents 78 (35%) are employed in different governmental and non-governmental organizations but also do have farm yards. Wetland water is utilized for irrigation of farm yards. The dependency of farmers in the wetlands is direct and indirect. The direct dependence is from using the wetland water for irrigation while the indirect is from using the underground water. The total land mass of 138.22 ha is dedicated for growing mainly chat (Chata edulis). The dependency for water for agriculture amounts to 1,231,875 birr per year on average.
Livestock
On average, 5 animals which includes cattle, sheep, goats, donkeys and hen were reared in each house. Farmers rely on the sale and direct consumption of the livestock products as part of their income. The dependency for livestock consumption (drinking water and fodder production) and for washing purpose accounts for 1097.25 and 13680.75 L per three cows respectively. On average there are 3 cows in each household.
Residents of the area have been living in the area for nearly 20 to 73 years, among which75.7 % of the families lived for over 20 years in the area. The wetlands provided services for the last 50years without interruption. The agricultural expansion and the introduction of agrochemicals to the area resulted in the contamination of the water. The service is decreasing from time to time due to the anthropogenic activities in the surrounding. This is manifested in the recorded BOD and DO of the wetlands. The BOD which is taken as an indicator for pollution was greater in all the sampling sites of Adele. The highest concentration (6.3 mg/L) was recorded at site A3 at Adele (Table 3).
Causes for the depreciation of the wetlands
The major problems listed were dumping garbage and non-degradable materials to the wetlands especially plastic materials 178 (79.82%), and open area defecation 151 (67.71%); the two being the top prioritized problems. The agrochemicals used in the area 143 (64.12%) do have double effect on both inland water and underground water due to the fact that the water table of the area is near that it affects the underground water. These problems have adverse effects on the services of the wetlands by reducing water quality.
Utilization of inflow of water for irrigation is also mentioned by 125 (56.05%) respondents as one of the problems. Utilization of inflow of water has effect on the water budget of the wetlands and will lead the ecosystems to completely dry conditions.
Conservation and people’s perception
The community’s perception towards designing conservation scheme by itself is low (Table 4). Among the five questions prepared only one positive response was recorded. 169 (75.8%) of the respondents agree that they are doing conservation work to reduce silt deposition, while the rest, 48 (21.5 %) and 6 (2.7%) responded that they are not doing conservation or had no clue of the program, respectively. The next question was regarding preparation of buffer zones. Only 11 (4.9%) responded that they are demarking buffer zone; while 137 (61.4%) did not leave buffer zone and 75 (33.6%) do not even know what buffer zone was.
The third question was about their attempt to avoid agrochemicals. 192 (86.1%) of the farmers were still using pesticides and insecticides; while 5 (2.2%) respondents do not even know what agrochemicals were. The forth question was related to the intervention of government bodies in waste disposal. 127 (57%) responded that the government bodies did not allow them dumping wastes in to the wetlands; while the rest 77 responded that they allow them dumping wastes and 19(8.5%) were not aware at all. The last question was about conservation practices applied on the wetlands. 166 (74.4%) were not undertaking any kind of conservation activity for the wetland restoration and conservation while 49 (22%) responded that they are undertaking conservation activities and the rest 8(3.6%) do not know the condition.
Economic valuation on WTP or WTA
The logit regression analysis shows that the gender, age, education, marital status, family size (FM size), residence and years of stay in the area are significant. The result also indicates that education has effect in their willingness to conserve and also to restore the wetlands to their former status (Table 5). The other variables also play role in their willingness for conservation scheme of the wetlands.
As discussed in and George and Koshy (2008), if the concentration of BOD is below 5 mg/L, it has an adverse effect on the functioning and survival of biological communities and also if it is below 2 mg/L it may lead to the death of most fish. In similar manner all the sampling sites in Adele showed higher BOD values compared to Teneke and Haramaya (Table 3). This reveals clearly that Adele wetland was not experiencing pollution problems than Teneke and Haramaya wetlands. The causes for the pollution of wetlands might be due to the introduction of inorganic pollution via the use of inorganic fertilizers, insecticides and other agro chemicals which are similarly
stated in Afework, 2005 and Zinabu et. al., 2002 in their survey of Ethiopian wetlands and their future fate. Similar reports were made by George and Koshy (2008) in Sasthamkotta Lake in India.
Wetlands are at the verge of extinction due to unplanned urbanization, land use changes, diversion of water for irrigation purpose, tourism industries (expansion of Hotels around water bodies), disposal of both household and industrial wastes, and intoxication via agrochemicals. Similar situations are accounted for in Finlayson et al., (2005), Legesse et al (2005) and Legesse et al (2002) in Malaysian wetlands and Abijata Lake Ethiopia, respectively. Wetlands in eastern Hararghe are also facing similar fate as of other wetlands in different parts of the country according to Abebe and Gheb (2003), Ayenew (2002), and Abebe and Gheb (2003) due to lack of orientation and mismanagement of wetlands. Lake Abijata is now at the verge of extinction and more than 50% of the area has changed to bare land. The same is true for Haramaya and Adele wetlands, if situations continue unabated.
Different wetlands in different countries have been degraded and were lost as a result of lack of understanding of proper wetland management (Bowers,
1983). According to Emerton (1998) the presence of lack of interrelated market and intervention failures, become major drivers for degradation. According to Birol et al., (2005), the major problem arises from a fundamental failure of information, or lack of understanding of the services and economic values that are associated with wetlands.
Different human activities result in bringing different side effects, such as pollution from industry from both service and product industryalso from agriculture, which have an adverse impact on sites elsewhere but for which, due to lackof enforceable rights, no compensation is paid to those affected (Turner et al., 2000; Ojeda et al., 2008).
The income from the water shows peoples’ dependency in the wetlands. Similar studies in India by Ramachandra et al., (2011) and in Ethiopian lowland lakes by Legesse et al., (2004), and Ayenew 2002 show similar results. The income dependency and the farmers’ awareness has impact on the conservation and restoration of the wetlands. Even if the wetlands are sources of income for number of farmers these resources are characterized by serious degradation and exploitation Because of rapid agricultural expansion, overgrazing, resettlement and excessive soil erosion etc. which call for wetland conservation, improvement and management efforts Ayenew, 2002, Birol et.al., 2005 and Horton et.al., 2003.
Using contaminated water for irrigation purpose has also effect on both the quality and quantity of agricultural products produced for market for example on chat (Chata edulis) which is commonly grown in this area.
The socio economic survey, the water quality analysis and the willingness to pay results show that there is a decrease in the trend of ecosystem services with decrease in water quality. The decrease in water quality has adverse effect on the livelihood of the local community who are dependent on the wetland ecosystem services. The accumulation of nutrients or eutriphication was due to inflow of agrochemicals with runoff water and waste materials disposed in the wetland. The land use change also is one problem exhibited due to the flatness of the wetland areas and the un-favorability of the farm yards. This made the local communities to encroach to the wetland margins for farming and this decreased the buffer zone. Commercial fertilizers and other agrochemicals are polluting both the soil and the water. The underground water is near and hence is easily affected by the pollutants. Commercial fertilizers have to be replaced with animal manure and compost or other means with proper management underway. To retain the existing reserve and bring back the lost resources, efforts should be made to restore through processes including increasing awareness of the society, community based conservation schemes, wastewater treatments, wetland management and proclamation for wetland conservation and proper usage. Increasing the society’s awareness will bring effective utilization and ownership of resources which enable the society to develop its own means of conservation.
The authors declare that they have no conflict of interest.
REFERENCES
|
Abebe Y, Gheb K (eds).(2003). Wetlands of Ethiopia: Proceedings of a seminar on the resources and status of Ethiopian's wetlands, vi+116pp.IUCN Eastern Africa Regional office, Nairobi, Kenya.
|
|
|
|
Abebe YD (2003). Wetlands of Ethiopia: an introduction, proceedings of a conference on Wetlands of Ethiopia. Abebe, Y.B., and K. Geheb (eds.). International Union for Conservation of Nature and Natural Resources, Nairobi, Kenya. pp. 1-12.
|
|
|
|
Afework H (2005). Ethiopian Wetlands Distribution, Benefits and Threats, Ethio- Wetlands and Natural Resou1rces Association. In: the Proceedings of the second Awareness creation Workshop on Wetlands in the Amhara Region. Addis Ababa pp. 3-17.
|
|
|
|
Ayenew T (2002). Recent changes in the level of Lake Abiyata, central main Ethiopian Rift. Hydrological Sciences-Journal-des Sciences Hydrologiques, 47:493-503.
Crossref
|
|
|
|
Barbier EB, Acreman MC, Knowler D (1997). Economic Valuation of Wetlands: A Guidefor Policy Makers and Planners. Ramsar Convention Bureau, Gland Switzerland.
|
|
|
|
Birol E, Karousakis K, Koundouri P (2005). Using a Choice Experiment to Account for Preference Heterogeneity in Wetland Attributes: The Case of Cheimaditida Wetland in Greece; Environmental Economy and Policy Research Discussion Paper Series, Department of Land Economy and University of Cambridge.
Crossref
|
|
|
|
Bowers JK (1983) Cost-benefit analysis of wetland drainage. Environment and Planning A. 15:227-235.
Crossref
|
|
|
|
Cameron TA (1988). New Paradigm for Valuing Non-market Goods using Referendum Data: Maximum Likelihood Estimation by CensoredLogistic Regression. Journal of Environmental Economics and Management 15(1):355-379.
Crossref
|
|
|
|
Central Statistics Agency of Ethiopian (CSA) (2015). Annual population index. Unpublished.
|
|
|
|
Collings SL (2009). Economic Consequences of Ecological Change: Restoration options for theMfolozi Floodplain and implications for Lake St Lucia. Rhodes University, South Africa.
|
|
|
|
Deribe S (2007). The Ramsar Convention on Wetlands and the Status of Ethiopia. Harnessing theWater Resources of Ethiopia for Sustainable Development in the New Ethiopian Millennium P 13.
|
|
|
|
Emerton L (1998). Economic Tools for Valuing Wetlands in Eastern Africa. Nairobi, Kenya: IUCN Eastern Africa Regional Office.
|
|
|
|
Finlayson CM, D'Cruz R, Davidson NC (2005). Ecosystems and human well-being: Wetlands and Water Synthesis, Millennium Ecosystem Assessment, World Resources Institute, Washington D.C.
|
|
|
|
Finlayson CM, Davidson NC, Spiers AG, Stevenson NJ (1999). Global Wetland Inventory: Current status and Future Priorities, Marine and Fresh water Research 50:717-727.
Crossref
|
|
|
|
Fisher B, Turner K, Zylstra M, Brouwer R, De Groot R, Farber S, Ferraro P, Green R, Hadley D, Harlow J, Jefferiss P, Chris K, Morling P, Mowatt S, Naidoo R, Paavola J, Strassburg B, Yu D, Balmford A (2008). Ecosystem services and economic theory: integration for policy-relevant research. Ecological Applications 18(8):2050-2067
Crossref
|
|
|
|
George AV, Koshy M (2008). Water quality studies of sasthamkotta lake of kerala. Pollution Research 27(3):419-424.
|
|
|
|
Gezahegne SG (2016) Socio-economicbenefit of wetland ecosystem (in case oflake ziway). MSc thesis Addis Ababa University, Ethiopia.
|
|
|
|
Hailu A (2003). Wetlands research in south-western Ethiopia: the experience of the Ethiopian Wetlands Research Programme. Wetlands of Ethiopia. 37 p.
|
|
|
|
Hanley N, Wright RE, Alvarez-Farizo B (2006). Estimating the economic value of improvements in river ecology using choice experiments: An application to the water framework directive. Journal of Environmental Management 78(2):183-193.
Crossref
|
|
|
|
Horton B, Colarullo G, Bateman IJ, Peres CA (2003). Evaluating non-user willingness to pay for a large scale conservation programme in Amazonia: a UK/Italian contingent valuation study. Environmental Conservation 30(2):139-146.
Crossref
|
|
|
|
Jordan TE, Whigham DF, Hofmockel KH, Pittek MA (2003). Nutrient and Sediment Removal by a Restored Wetland Receiving Agricultural Runoff. Journal of Environmental Quality 32:1534-1547.
Crossref
|
|
|
|
Koohafkan P, Nachtergaele F, Antoine J (1998). Use of Agro-Ecological Zones and Resource Management Domains or Sustainable Management of African Wetlands; Wetland Characterization and Classification for Sustainable Agricultural Development, FAO, Rome.
|
|
|
|
Legesse D, Gasse F, Radakovitch O, Vallet-Coulomb C, Bonnefille R, Verschuren D, Gibert E, Barker P (2002). Environmental Changes In A Tropical Lake (Lake Abiyata; Ethiopia) During Recent Centuries. Palaeogeography, Palaeoclimatology, Palaeoecology 187:233-258.
Crossref
|
|
|
|
Legesse D, Vallet-Coulomb C, Gasse F (2004). Analysis of The Hydrological Response of A Tropical Terminal Lake, Lake Abiyata (Main Ethiopian Rift Valley) To Changes In Climate And Human Activities. Journal of Hydrological Processes 18:487-504.
Crossref
|
|
|
|
Legesse D, Woldu Z, Mebrate A, Mengistou S, Ayenew T (2005). A Review Of The Current Status And An Outline Of A Future Management Plan For Lakes Abiyata And Ziway. The Federal Government of Ethiopia; Oromia Environmental Protection Office.
|
|
|
|
Maltby E (2000). Ecological-economic analysis of wetlands: Scientific integration for management and policy. Ecological Economics 35(1):7-23.
Crossref
|
|
|
|
Millennium Ecosystem Assessment (MEA) (2005a) Ecosystems And Human Well-Being: Wetlands and Water Synthesis. Millennium Ecosystem Assessment. World Resources Institute, Washington, Dc.
|
|
|
|
Millennium Ecosystem Assessment (MEA) (2005b) Ecosystems And Human Well-Being: A Framework For Assessment. Millennium Ecosystem Assessment. Washington, D.C., Island Press.
|
|
|
|
Moser M, Prentice C, Frazier S (1996). A Global Overview of Wetland Loss and Degradation: Proceedings of the 6th Meeting of the Conference of Contracting Parties of the Ramsar Convention, Brisbane, Australia pp. 21-31.
|
|
|
|
Ojeda MI, Mayer AS, Solomon BD (2008). Economic valuation of environmental servicessustainedbywaterflowsinthe Yaqui riverdelta. Ecological Economics 65(1):155-166.
Crossref
|
|
|
|
Ramachandra IV, Alakananda B, Rani A, Khan MA (2011). Ecological and socioeconomic assesmnet of Varthur wetland Bangalur India. Journal of Environmental Science and Engineering 53(1):101-108.
|
|
|
|
Siew MK, Yacob MR, Radam A, Adamu A, Alias EF (2015). Estimating willingness to pay for wetland conservation: a contingent valuation study of Paya Indah Wetland, Selangor Malaysia. Procedia Environmental Sciences 30:268-272.
Crossref
|
|
|
|
Tiner RW (1984). Wetlands of the United States: Current Status and Trends; U.S. Fish and Wildlife Service, Washington, D.C.
|
|
|
|
Turner RK, VardenBergh JCJM, Soderqvist T, Barendregt A, Vander Straaten J, Zamora PM (1984). Philippine Mangroves: Assessment Status, Environmental Problems, Conservation and Management Strategies: Asian Symposium on Mangrove Environment
|
|
|
|
Research and Management 25-29, August 1980, Kuala Lumpar, Malaysia.
|
|
|
|
Zinabu GM, Kebede E, Desta Z (2002). Long-term changes in chemicalfeatures of seven Ethiopian rift-valley lakes. Hydrobiologia 477:81-91.
Crossref
|


