Full Length Research Paper

ABSTRACT
Tracking the changes in the river basin system and identifying areas susceptible to flood disasters is an inclusive step in flood hazard control and management. This research analyzed the spatial variability of rainfall and physiographical attributes of the main tributaries of River Benue in Taraba with the aim of identifying areas susceptible to flooding on the basins. The spatial data subjected to WLC approach for reclassification were annual rainfall, digital elevation model, basin slope, land use, soil types, drainage density, and catchment area. The clincher to flooding in the state favors land use. The composite map of flood vulnerability revealed that vulnerable areas occupied 48.6% while highly vulnerable occupied 0.9% of the entire study area of 44,359.2 km2. In terms of the area extent, the highly vulnerable region covers 410.6 km2; the vulnerable area covers 21,576.6 km2, and the areas that are not vulnerable cover 64.9 km2. The towns that are at risk of a high vulnerability to flooding within the study area are Karim Lamido, Gassol, Ibi, Lau, Donga, Wukari, parts of Takum, Ardo Kola, Kurmi, Bali, and Jalingo. It was recommended among others that as the region’s status is vulnerable to climate change and that this has a strong association with land use and land cover change, development along the floodplain should be discontinued.
Key words: Flood vulnerability; land use change; river catchment area; rank-sum method; river Lamurde, Taraba and Donga.
INTRODUCTION
Across the globe, floods pose remarkable stress on people’s lives and properties. In flood-prone areas, flood risk and vulnerability are increasing due to changes in rainfall patterns, increased frequency of extreme events, and changes in land use and development as a result of socio-economic demand (Monica et al., 2016). The frequency is on the rise. This is not unconnected to the progressive deterioration of the basins, riverbeds, and streams, the blockage of natural drainages restraining the marshes, the increase of erosive processes by deforestation, and the exploitation of margins of rivers. Knowledge of the cumulative impacts of climate change at the sub-national and national levels is on the increase, hence the need for regular monitoring and assessment of the environment. Tracking the changes in river regimes and the capability to forecast flood disasters is an inclusive step in flood hazard control and vulnerability.
Although flooding is a natural occurrence, man-made changes to the land can also be an element. Development does not cause flooding but can aggravate the process of flooding. In cities and suburbs, pavement and rooftops prevent some rainfall from being absorbed by the soil. An encroachment through development in the path of geophysical agents is a factor. These can increase the amount of runoff flowing into downstream catchments. There exists a noticeable relationship between land use change, slope/aspect, soil moisture, stream network, basin catchment size, rainfall amount/ intensity, and flood vulnerability of a place.
Comprehensive mitigation of the effects of flood entails certifying that all vulnerable places are identified and adequate safety measures are taken to ensure adequate preparedness, effective response, quick recovery, and effective prevention (Suleiman et al., 2014). Relevant information on the disaster-prone area like elevation, slope aspects, soil types, the proximity of built-up areas to drainages, the network of drains, the presence of buffers, and extent of inundation, cultural practices as well as attitudes and perceptions of disaster are needed to provide an effective response to flood disaster. This information can be analyzed and their various contributions to hazards identified in GIS environment using multi-criteria analysis.
The study that spelled out the flood risk zones of the study area using GIS platform like this is not on the world digital board, it is against this backdrop that this project aims to generate a composite flood vulnerability map of the river Lamurde, Taraba, and Donga for decision makers by mapping the potential sources of flooding. This research spelled out the percentage contribution of climatologic and physiographical attributes of the basin to flooding in the catchments area of Taraba, especially along the major tributaries of river Benue in the state.
LITERATURE REVIEW
The hydro-metrological disasters around the globe are on the increase (Okada and Odhiambo, 2019) and several factors have been adduced as the causative agents. These include, increase in rainfall, land use change among others.
Oruonye (2015) in his assessment of the impact of land use changes along the floodplain of river Lamurde found out that land use along the plain has undergone a substantial level of change from open fields and shallow lands to intensively cultivated irrigation and residential areas. He noted that excessive water abstraction, deforestation for fuel wood and other domestic uses, excessive use of chemical fertilizers, and land degradation due to improper agricultural practices are the order of the day. Suleiman et al. (2014) in their research work on flood risk and vulnerability mapping for disaster management at Lokoja, Kogi State, Nigeria have submitted that administrative and commercial area like that of Lokoja serves as a ‘gateway’ settlement and as such serve as both a resort and stop over settlement for most travelers and business people. According to them, this is resulting in increased physical planning problems as buildings are constructed on every available space including the marginal flood plains and river banks. This has been noted to have a gross implication on the river regime and vulnerability of the place.
Several factors accrued to form the basis of incessant flooding in Jibia in Kastina. The orientation of the basin and the closeness of the farm lands on one hand, and the diversion of the Dan Marke stream. According to Asemota (2018), the diversion of the stream which had not been dredged since its construction in 1991 means that the stream could not flow along its natural courses which later became built up with houses. Natural and anthropogenic-induced disasters are indisputably increasing due to numerous factors such as urbanization, population growth, infringing on the floodplain, and climate change. Flood disasters not only cause huge losses of human life but also can result in several economic losses when community dwellers placed themselves in the path of geophysical agents through encroachment.
The multi-criteria analysis (MCA) has been widely applied to solve a broad range of multi-criteria decision-making and address flood risk challenges all over the globe (Cozannet et al., 2013). Outside the nation many studies using MCA are on the world digital board. Ouma and Tateishi (2014) applied MCA in order to analyze the flood vulnerable areas in Turkey and Kenya. Kazakis et al., (2015) applied GIS-based multicriteria flood risk assessment in the Greater Athens area and the Rhodope–Evros region, Greece. GIS and remote sensing can be used to address flood losses through a number of applications.
Study objectives
The aim of this research is to generate a composite flood vulnerability map of the river Lamurde, Taraba, and Donga for relevant decision-makers in the state. Three specific objects are to:
i. Identify causes of flooding in the catchment area of major tributaries of river Benue in Taraba State
ii. Determine the percentage contribution of climatologic and physiographical attributes of the basin to flooding in the catchments area of Taraba
iii. Develop a flood susceptibility map of the study area
MATERIALS AND METHODS
Description-study area
The study area is the three major tributaries of river Benue in Taraba State. The terrain is located in the northeastern part of Nigeria. It lies between latitude 6° 46' and 9° 45' North of the equator and between longitude 9° 25' and 11° 50' East of the Greenwich Meridian (Figure 1). Roughly twenty-two sub-basins are identifiable in the study area. These sub-basins network with these three major rivers and drained a total area of about 44359.2 km2 having a perimeter of about 1521.6 km. The land area has three main tributaries to River Benue: River Lamurde, River Taraba, and River Donga.
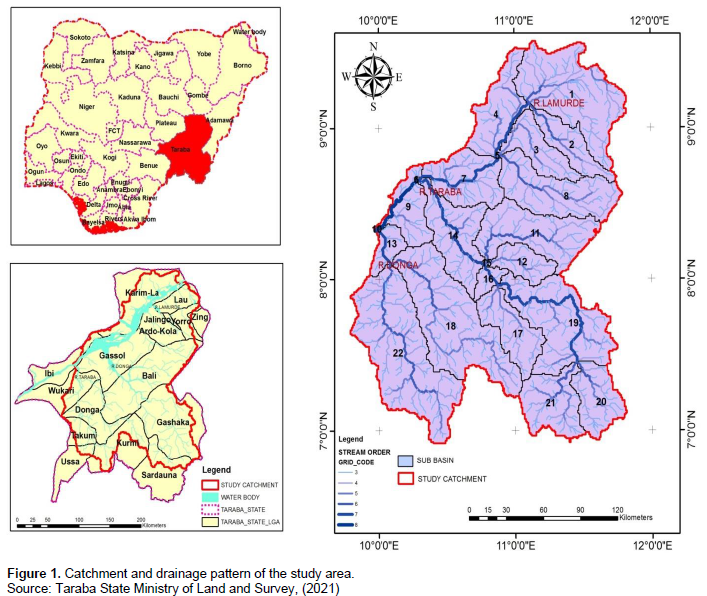
River Lamurde drains only one watershed. River Donga conspicuously drains twelve sub-basins. River Taraba as it transverses from the upland to the downstream of the study area, westward drains nine catchments. The study area is characterized by a tropical continental climate marked by dry and rainy seasons. Commencement of rainfall is around April-May and this ends around September-October. The annual mean is less than 1000 mm in latitude 9? (Adebayo, 2002), and 1350 mm of rainfall has been documented in the Southern part of the State. This typically results in an increase in rainfall on the crest and to the windward and a rain shadow to the leeward side (Bawden and Tuley, 1966).
The study area’s temperature varies from month to month and from place to place reaching the peak at the end of the dry season (Match). Maximum temperature ranges between 26°C to 39°C while minimum temperature ranges between 15 and 18°C. The relief of the study area can be conveniently subdivided into two broad groups-highland and lowland. The highland area consists of the Shebshi Mountain in the northeastern part of the region. Towards the western part of the region is the extensive undulating lowland which forms part of the eastern Muri plains (Oruonye, 2011). River types vary across the state and are often a product of geology, slope, and human intervention. Oruonye (2011) has observed that the northern bank of the river has heavily encroached on occupants irrespective of the devastating effects of recent floods in the area while the southern parts are notably exploited. The vegetation type of the study area has been adversely affected by human activities leading to the clear-cutting of trees in many parts of the area. Artificial vegetation and a few economic trees have replaced natural vegetation especially as we transverse the northern part of the study area. Considering the management and harnessing of natural resources in any area especially water and land resources, the population is a strong factor. The rapid growth of the study area has necessitated the expansion of the settlement and infrastructures to accommodate relative increases in population (Oruonye, 2015). Farming is the main occupation of nearly three-quarters of the people’s population while only ¼ is involved in other vocations. This is so because of the vast expanse of arable land. Also, high water resources in Jalingo town offer great potential for irrigation, especially using simple and inexpensive technologies. To curb this menace of total dependence on rainfall which poses grievous set back on agricultural productivity, especially in the northern part of the state, there are those farmers who exploit the plains of the river Benue in the State (Orunoye, 2011). Among the three tributaries of river Benue in Taraba, river Lamurde is the most exploited. The construction of new roads and bridges along river Lamurde and river Mayogwai, its tributaries, plays a very significant role in opening up large areas for the construction of residential houses and intensification of agricultural activities along the river banks. These changes in uses along the banks of the Lamurde River have resulted in a large-scale transformation of the landscape. This as expected has serious implications for the river regime.
Methodology
The data used for this research include Satellite imagery (Enhanced Thematic Mapper (ETM) and Topographic maps. A set of causative factors concerning the mostly hydrological, geological, and physio-geographical characteristics of the study area that can be measured and evaluated were considered for the analysis (Zele?áková, et.al, 2015). These include: (1) Rainfall (2) Elevation (3) Land use (4) Drainage Density (5) Basin slope (6) Soil types (7) Catchment area.
Rainfall generation data and processing
The spatial distribution of the rainfall intensity was performed. The data were then rasterized and assigned classes. From this raster data, Mean Annual Rainfall (MAR) was generated for the three catchments. This serves as the Z value for interpolation in the Inverse Distance Weighted tool to create the rainfall map of the study area Figure 2. Rainfall data were divided into four classes. In the classification process, an area with higher rainfall is assumed to be very highly affected by flood and then ranked as class 4, which is between (1801.9-2102.2) mm/year. Following the very high hazard class, there is a class high (1501.6-1801.9 mm/year) ranked as class 3, moderate (1201.2-1501.6 mm/year) ranked as class 2, low (900.9-1201.4 mm/year) ranked as class 1.
Elevation generation and slope map
The Elevation and slope map of the study area was extracted from SRTMDEM. The elevation data values were then subdivided into four classes. Categorization was based on the surface topography of the terrain. Thus:
(i)The basin valley which is found along the tributaries with heights between 92 and 323 m above the sea level was classified as “highly vulnerable” to flood.
(ii) The plain with heights ranging from 323 to 646m above sea level was classified as “vulnerable” to flood.
(iii) The upland areas with a range of 645 to 1122m above sea level were classified as “marginally vulnerable”.
(iv)The high land areas with heights range of 1122 to 2244m above sea level as “not vulnerable”.
The slope map was prepared in percent grade using the DEM of the study area. The district's values were subdivided into four classes.
Generation of land use types and processing
Landsat 8 was geo-referenced to the Universal Transverse Mercator (UTM, zone 32° N) Minna datum. A supervised image classification technique was employed in this study. The training site was chosen to represent land use classes such as vegetation, built-up area, bare land, and water body. Classifications were limited to these variables because these are known linkages to the flood hazards of an area. The data were divided into four classes.
Generation of drainage map and processing
Drainage is an essential factor of consideration when an assessment of an area for flood hazard vulnerability is a concern. The drainage map was derived from the DEM. The drainage density was reclassified and their sizes were subsequently identified in Arc GIS into four classes.
Generation of soil types and processing
Soil type was obtained from Worldmap.havard.edu/data/geonade: DSMW_RdY (2015). Reclassification into four classes was on the basis of the content of clay particles. The soil type that has a very high capacity to generate a very high flood rate was ranked as ²class 4², the soil type with a high capacity to generate high flood was ranked as ²class 3², soil type with a moderate capacity to generate moderate flood was ranked as ²class 2², soil type with low capacity to generate low flood was ranked as ²class 1². This was divided on the basis of the content of clay particles into four classes.
The catchment area
The river basin area was divided into sub-catchments and their size was subsequently identified in Arc GIS. Sub-basins were divided into four classes.
Physiographical factors contribution to flood hazard potential
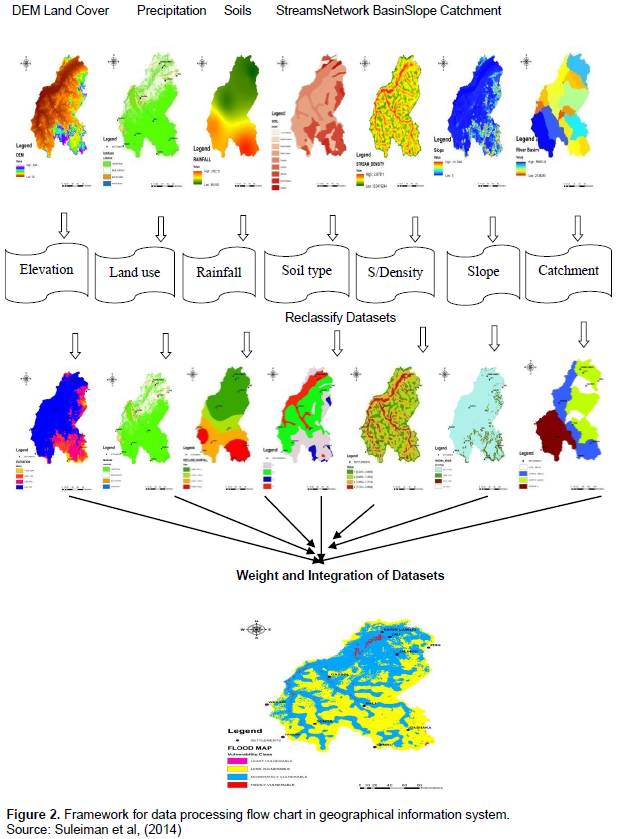
The straight ranking was used to identify factor’s classes, with the most endemic for flood occurrence= 1, next risk = 2, etc (Zele?áková et al., 2015). The conceptual framework for data processing using MCA in GIS is presented in Figure 2.
To generate factor values for each evaluation unit, each factor was weighted according to the estimated significance for causing flooding. The purpose of criterion weighing is to express the importance of each factor relative to other factors.
To obtain numerical weights from this rank order for this research, the researcher adopted the formula provided by Yahaya et al. (2010) see Eq 1. Normalized weights of the criterion were calculated using the equation (Equation 1).
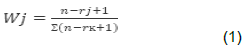
Where: Wj is the normalized weight of each factor; n is the number of factors under consideration (k = 1, 2, 3…n). For this study n = 7
rj is the rank position of the factor.
Each factor is weighted by Equation 2.
Wj = n − rj + 1 (2)
and then normalized by the sum of weights using (Equation 3)
∑(n − rk + 1) (3)
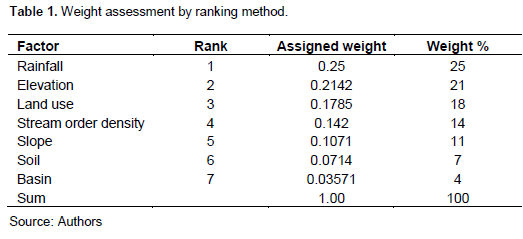
The purpose of criterion weighting is to express the importance of each factor relative to other factors (Table 1). More important factors have a greater weight in the overall evaluation (Yalcin et al., 2004).
To obtain the ?nal composite vulnerability index, these sub-indices were combined using the additive (averaging) approach. Thus:
H = ? (F1 *WJ1 + F2*WJ2 …………… F7*WJ7) (4)
Where: H= Resulting flood hazard; F1, F2…. F7 are respective factors; WJ1, WJ2……. WJ7are the normalized weights for each factor.
RESULTS AND DISCUSSION
This part of the study presents the results of the analyses of the climatic and physiographical factors that contribute to flooding hazard potential in the study area.
Spatial rainfall variability in the catchments area
The results show evidence of a progressive decrease in rainfall from the southern region up to the northern region of the state. This result affirms the submission of Adebayo (2002). Their work on rainfall variation, water resources potential, and implication for flooding in the state, typifies a decrease of rainfall northwards. According to them, daily rainfall at Gembu, river Taraba (Gassol station), river Donga (Donga station), and river Lamurde (Jalingo stations) stood at 220.8 mm, 162.0 mm, 174.0 mm, and 142.9 mm and they all occurred on Month of August. The analysis added that the highest annual rainfall event ever recorded over the period under study was in Gembu and the least from Jalingo (river Lamurde) (Adelalu et al, 2018). In the state, annual rainfall decreases with increasing latitude (Adebayo, 2002).
Elevation range in catchments area
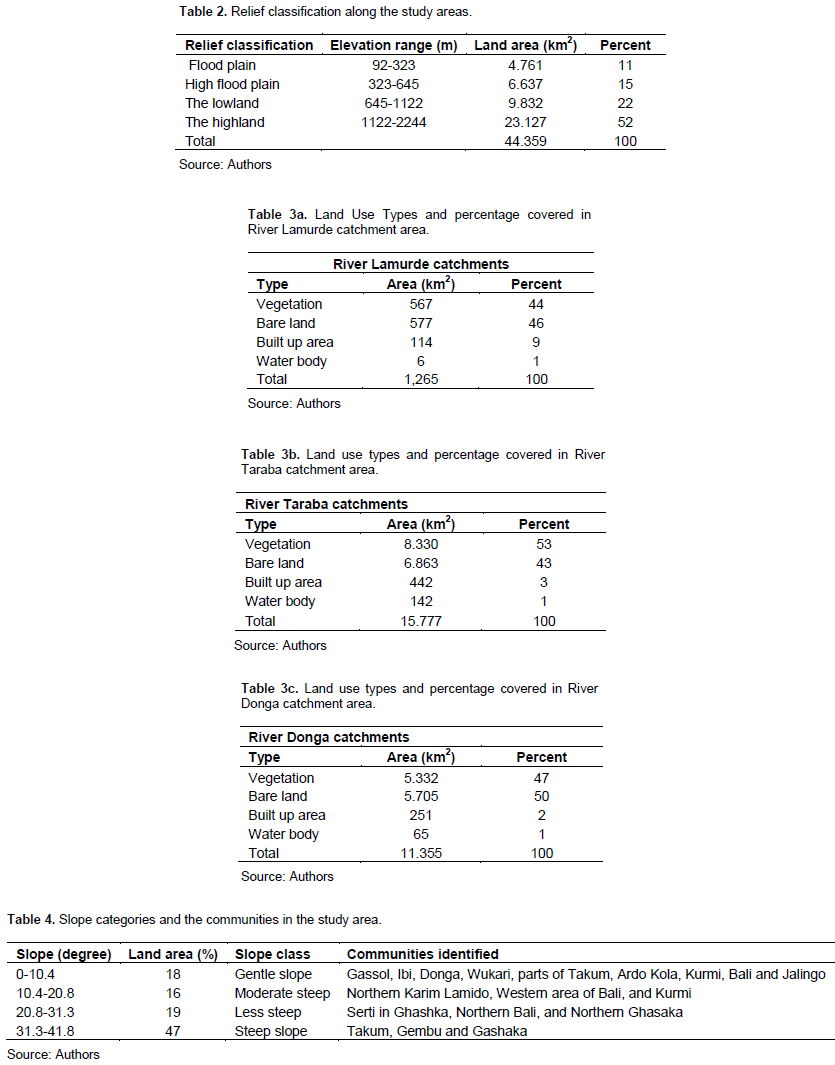
From the analyzed DEM, 11% of the land surface area lies between 92 to 323m, 15% lies between 323 to 645 m, 22% lies between 645 to 1122m, and 52% of the land surface in the study area lies between 1122 to 2244m (Table 2).
Land use and land cover types of the study catchments
From Table 3a to c, the three catchments show natural vegetation cover of about 14,229 km2. This account for 50.1% of the land mass of the catchment area under study. Cultivated area and the bare land in the region amount to about 13,146 km2. This accounts for about 46% of the basin area. The built-up area covers about 807 km2, occupying just 3%.
Stream order density in the catchment area
The automated generated tributaries show 22 sub-basins in the study area. River Lamurde has a lone catchment area. River Taraba has 10 sub-basins while there exist 4 sub-basins in the river Donga catchment area. This implies that there are about 7 other minor basins in the study area outside the studied river catchments. River Lamurde with a 1,264 km2 basin area has 9 stream orders while river Taraba with a basin area of 15,777 km2 and river Donga with a basin area of 11,355 km2 have 7 each. The result from the slope analysis is indicated in Table 4.
Soil types - study area
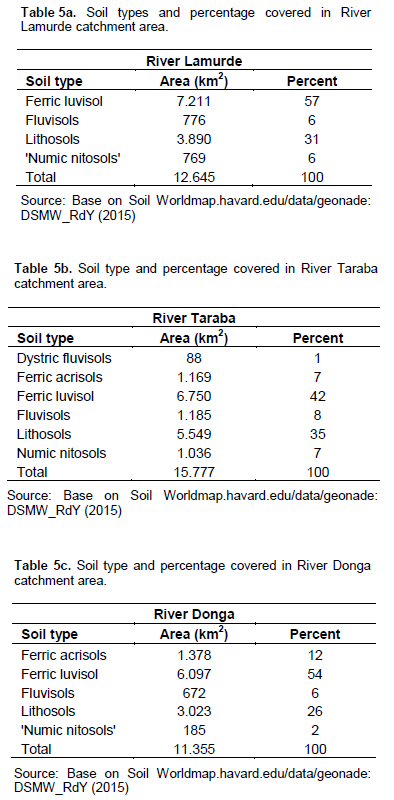
There exist nine groups of soil types in the study area. Vertisols and fluvisols mostly along the river basin are assumed to have a very high flooding capacity ²class 4², Luvisols were next assigned as high ²class 3², Nitisols were assigned as moderate class 2, Acrisols/Leptosols/ Arenosols/Lithosols are assigned as a low ²class 1² and as such have a low flooding capacity.
Table 5a to c shows the soil types and percentage covered in river Lamurde catchment area.
Flood susceptibility map - Taraba State
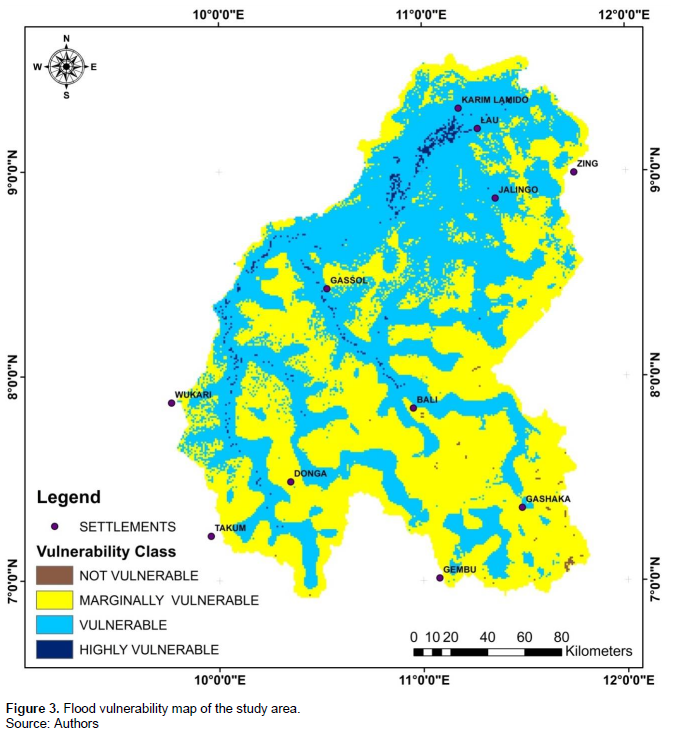
Figure 3 reveals the vulnerability map of the catchment area. The result shows four classes for the whole study area. These classes include highly vulnerable, (deep blue color) vulnerable, (blue color) marginally vulnerable, (yellow color), and not vulnerable, (brown color). The not-vulnerable class occupied an area of about 0.1%, the marginally vulnerable area occupied 50.3%, and the vulnerable area occupied 48.6%, and the highly vulnerable occupied 0.9% of the entire study area of 44,359.2 km2. In terms of the area extent, the highly vulnerable portion covers 410.7 km2 vulnerable portion covers 21,576.7 km2; the marginally vulnerable portion covers 22,306.9 km2, and the area that is not vulnerable covers just 64.9 km2.
Flood vulnerability potential in Taraba State
Rainfall and effect on flooding
It is no longer in doubt that climate change has led to changes in the known patterns of rainfall and other climatic variables as well as increased the frequency and magnitude of natural disasters including floods in different parts of the world. Flood is indeed a global environmental issue that had destroyed lives and property amidst other untold hardships (Rhoda et al., 2017). The establishment of climate change in the study area is no news either (Adebayo, 2012).
Likewise, it is evident that rainfall decreases as we progress northwards while the flooding activities take the reverse case (Figure 3). River Lamurde which is in the northern parts of the three studied rivers is the most vulnerable. Flood is arguably the most common and severe natural disaster in the Taraba especially Jalingo environment along river Lamurde. It has become an annual environmental problem during every rainy season. Umar et al. (2015) have noted that in most parts of the Sudano-Sahelian region of Nigeria, the months of August still remained the rainiest month and that most seasonal floods in the region are likely to occur in the month of August or September. This is also very true in the study area because past records of farm flush, building, and bridge collapse had been in the month of August or September. Although there were notable drastic fluctuations in annual rainfall total from year to year, there has not been a significant increase in annual rainfall total in these areas except at the Upstream-Gembu (Adebayo, 2012). The study area’s- upland catchment, Gembu, has been witnessing an upward trend in rainfall total (Adebayo, 2012). However, the study area’s down streams catchments around Lamurde, Gassol, Donga, have comparatively lower rainfall but there is still a real concern for flooding, especially in the river Lamurde area where there are generally more densely cultivated and populated.
In this research, MCA shows a false representation of the observable pattern of flooding reality in the study area until relief and land use were introduced into the model developed for the assessment of the contributing factors. This conclusion is supported by the recent work of Gelleh et al. (2016), where the author found that land use and relief contributed more to flooding than other factors considered in the model. However, Eguaroje, et al. (2015) admitted that among the causative factors of flooding in Oyo state, rainfall top the list. In Uyo, rainfall intensity, land use, and elevation of an area are strong factors (Saturday et al., 2021). In the study area, however, land use tops the list.
Land use and effect on flooding
The three catchments show natural vegetation cover of about 14229.8 ha which is about 50.1% of the land mass of the catchment area under study. Cultivated area and the bare land amount to about 13146.2 ha which is about 46.3% of the basin area. Built up area is about 806.9 ha which is just about 2.8% is. With a record of vegetation cover, which is more than 50% of the basin area, there will be an expectedly high rate of infiltration. High infiltration suggests low runoff. This provides support evidence of low flooding in some areas and high flooding in some areas that are highly stripped of vegetation. The vulnerability of the study area to flooding seems strongly linked to anthropogenic activities. The extent of built-up or encroachment to the plain, the transformation of the terrain through lumbering and deforestation, displace vegetation, which hampers the free flow of water (Kelemen and Blist’anova, 2014) hence flooding. However, it can be said of the study area the transformation is concentrated in the flood plain. As the rainfall shortens (Adebayo, 2012) it pushes the farming stakeholders to the plain thereby increasing their vulnerability. This implies flood hazards in the study area can be averted since it is not majorly based in nature.
CONCLUSION
This study assessed seven geo-spatial elements in order to determine their influence on flood vulnerability potentials in catchment areas of river Lamurde, river Taraba, and river Donga in Taraba State. The influence of each element was examined step by step by introducing them one after the other in the MCA model.
The composite map of flood vulnerability of the study using weighted overlay analysis in a GIS environment revealed that not vulnerable class occupied an area of about 0.1%, the marginally vulnerable area occupied 50.3%, and the vulnerable area occupied 48.6% while highly vulnerable occupied 0.9% of the entire study area of 44,359.2 km2. In terms of the area extent, the highly vulnerable portion covers 410.6 km2, the vulnerable portion covers 21,576.6 km2, and marginally vulnerable portion covers 22,306.8km2, and the area that is not vulnerable covers 64.9 km2. The towns that are at risk of a high vulnerability to flooding within the study area are Karim Lamido, Gassol, Ibi, Lau, Donga, Wukari, parts of Takum, Ardo Kola, Kurmi, Bali, and Jalingo. These towns are at high risk of flooding mainly because of their change in land use and relative position. These towns occupy the downstream section of the study area. This supports the fact that the relief of an area plays a very significant role in the occurrence of flood disasters in a particular area. The southeastern part of the area has a relatively high elevation which gradually progresses towards the southwestern part of the area. This spatial pattern proves why highly prone areas to flood are more pronounced in the southwestern part of the state and also towards the northwest. An area with minimal flood risk occupies 50.3% of the total land mass. About 22306.8 km2 in area extent and the local governments under this region include Northern Karim Lamido, the Western area of Bali, Kurmi, and Yorro. Others on the list are Ussa, Serti in Ghashaka, and Northern Bali. Only 0.1 % of the study area is at the safety of flood hazards. The area extent of the region covers 64.9km2. The LGAs that fall into this category are Takum, Gembu, and Gashaka.
Recommendations
It is true that the region’s status is vulnerable to climate change. However, the vulnerability has no doubt an alliance with the land use and land cover change. Therefore, there is a need for farmers to adopt the ‘farm forest’ method of the farming system. This will check the adverse effects of flooding and serve as a windbreak and source of additional revenue apart from adding nutrients to the soil. Yearly flooding and the consequent losses of lives and properties in the state are avoidable errors. So, the laws of the land governing siting of residential or industrial buildings must be duly respected. Drains in the towns should be free of debris to allow the free flow of overflow orchestrated during the peak of the rainy season especially the month of September. The people of Karim Lamido, Gassol, Ibi, Lau, Donga, Wukari, parts of Takum, Ardo Kola, Kurmi, Bali, and Jalingo should be enlightened through both electronic and social media to henceforth desist from erecting any form of structure or residential buildings along areas that are waterways to avoid the incidence of flooding.
ACKNOWLEDGEMENTS
This research of reference number (TETF/DR&DICE/UNI/JALINGO/RG/2019/VOL1) was supported by the Tertiary Education Trust Fund (TETFund) research grant. The authors are therefore grateful to the TETFund office Abuja and Taraba State University Management for facilitating the grant. They are also grateful to members of staff of Upper Benue River Basin, Yola for the provision of the data and cannot forget in a hurry Prof. A.A Adebayo, Dean of Post Graduate studies, Moddibbo Addama University of Technology Yola, for his vital contribution to the study. Their unreserved gratitude goes to the TSU Tetfund desk officer for his physical and moral support that saw to the success of the research.
CONFLICT OF INTERESTS
The authors have not declared any conflict of interests.
REFERENCES
|
Adebayo AA (2002). Agro-climatic information for sustainable agricultural planning in Taraba State. Nigerian Journal of Tropical Agriculture 4 p. |
|
|
Adebayo AA (2012). Evidence of climate change in Taraba State: A preliminary report. A paper presented at the faculty of science seminar series, Taraba State in Jalingo 13th of September 2012. |
|
|
Asemota A (2018). Reliving the experience of Kastina flood. Retrieved from: |
|
|
Bawden MG, Tuley P (1966). The land resources of Southern Sardauna and Southern Adamawa Provinces, Northern Nigeria. Land Resources Study No. 2. Land Resources Division, Directorate of Overseas Surveys, Tolworth, Surrey, England. |
|
|
Cozannet GL, Garcin M, Bulteau T, Mirgon C, Yates ML, Mendez M, Baills A, Idier D, Oli-veros C (2013). An AHP-derived method for mapping the physical vulnerability of coastal areas at regional scales. Natural Hazards and Earth System Sciences 13:1209-1227. |
|
|
Eguaroje OE, Alaga TA, Ogbole JO, Omolere S, Alwadood J, Kolawole I S, Muibi KH, Nnaemeka D, Popoola DS, Samson SA, Adewoyin JE, Jesuleye I, Badru RA, Atijosan A, Ajileye OO (2015). Flood vulnerability assessment of Ibadan City, Oyo State, Nigeria. World Environment 5(4):149-159. |
|
|
Gelleh ID, Ibidun OA, Okeke UH (2016). Flood vulnerability assessment in Lagos City using multi-criteria analysis. Greener Journal of Environmental Management and Public Safety. |
|
|
Kazakis K, Kougias I, Patsialis T (2015). Assessment of flood hazard areas at a regional scale using an index- based approach and Analytical Hierarchy Process: Application in Rhodope-Evros region, Greece. Science of the total environment, Science of the Total Environment 538:555-563. |
|
|
Kelemen M, Blist' anova M (2014). Logistic modeling to handle the threat of flood- The Bodva River example In SGEM. 14th International Multidisciplinary Scientific Geo Conference: Conference Proceedings: Volume III: 17-26 June held in Bulgaria. |
|
|
Monica B, Martina Z, Peter B, Vojtech F (2016). Assessment of flood vulnerability in Bodva river basin, Slovakia. Acta Montanistica Slovaca 21(1):19-28. |
|
|
Okada FO, Odhiambo BDO (2019). Households' perception of flood risk and health impact of exposure to flooding in flood-prone informal settlements in the coastal city of Mombasa. International Journal of Climate Change Strategies and Management 11(4):592-606. |
|
|
Oruonye ED (2015). Assessment of the impact of land use changes along the floodplains of River Lamurde, Jalingo LGA, Nigeria. Journal of Forests 2(1):1-13. |
|
|
Ouma YO, Tateishi R (2014). Urban flood vulnerability and risk mapping using integrated multi-parametric AHP and GIS: Methodological overview and case study assessment. Water 6(6):1515-1545. |
|
|
Rhoda O, Buku E, Godwin A (2017). Analysis of rainfall pattern and flood incidences in Warri Metropolis, Nigeria. Geography, Environment, Sustainability 10(4):83-97. |
|
|
Saturday U, Charles U, Akanino E, Anyanime J (2021). Victim's perception of drivers and problem of flash floods in Uyo, Akwa Ibom State.: Proceedings. Of Nigeria Association of hydrological sciences (NAHS) 11th Annual Conference 9-12 August, 2021, pp. 305-313. |
|
|
Suleiman YM, Matazu MB, Davids AA, Mozie MC (2014). The application of geospatial techniques in flood risk and vulnerability mapping for disaster management at Lokoja, Kogi State, Nigeria. Journal of Environment and Earth Science 4(5):1-4. |
|
|
Taraba State Ministry of Land and Survey (2021). Map Taraba (Nigeria). Taraba State outline: hydrography, main cities, roads, names 2007-2003. |
|
|
Umar AT, Eniolorunda NB, Dangulla M, Bello N (2015). The changing frequency of extreme daily rainfall events and its implications for flood Occurrence in Northern Nigeria. International Conference & 29th Annual General Meeting of the Nigerian Meteorological Society held at Sokoto, Nigeria on 23rd - 26th November 2015. |
|
|
Zele?áková M, Bliš?an P, Purcz P (2015). Assessment of flood vulnerability in the Bodva catchment using multicriteria analysis and geographical information systems. River Basin Management 8:51-59. |
|
Copyright © 2024 Author(s) retain the copyright of this article.
This article is published under the terms of the Creative Commons Attribution License 4.0


