In this study, we worked on the modelling and the simulation of atmospheric conditions impact on photovoltaic production in Saint Louis area. Using Ineichen's model based on the disorder factor of Link, an assessment of sunshine in the study area was made. A characterization of the irradiation is elaborated by modelling the radiation and by simulating outputs of a photovoltaic power plant. We can estimate aerosols impact on photovoltaic production in the river area thanks to results obtained. We evaluated the sunshine rate of this area by using the modelling process. We chose an irradiation model to estimate the outputs of a photovoltaic power plant subjected to an atmosphere disturbed by aerosols. This work enabled us to set up a system of alerts and specific warnings for populations benefiting from this type of resource.
In Saint Louis, the atmosphere is influenced by desert dust (D'Almeida 1986). This Sahelian area near Sahara Desert is a climatic area, which is subjected throughout the year to dust episodes (Kaly, 2015). During the rainy season, heavy clouds appear which unfortunately produce few rains (Chamani et al., 2018) and can disturb the area insolation. During the dry season, Saint Louis area is exposed to dust occurrences. These dust occurrences in most cases are mineral aerosols commonly called "desert dust", have a very marked seasonal cycle and whose timing coincides partially with that of Harmattan (Martiny et al., 2016). Thus, if the dry season extends from October to March, we can distinguish a period "without" dust from July to December and a period "with" dust from January to June. The latter can be split into two sub-periods: from January to March and from April to June (Martiny et al., 2016). It is in the dry season that the continental trade winds in the North / Northeast direction speed increase in the lower atmospheric layers and bring with them significant amounts of desert dust from the Sahara to the Sahel (Senghor, 2017).
With the advent of photovoltaic energy and the urgent need to control global warming (Arent et al., 2011) power plants are being created everywhere (Laines-Canepa et al., 2017), including in Saint-Louis area, with the 20-megawatt solar center of Bokhol (Maillard, 2017).
However, a major problem remains with the use of photovoltaic energy. This technology uses solar radiation to produce energy (Gratzel, 2005). These radiations must cross the atmosphere before reaching the sensor. Saint Louis area is an area with high concentration of dust and cloud cover more or less important depending on the period of year and seasons. This radiation will necessarily be subject to disturbances (Dickinson 1975) that have been discussed in this work.
So the objective of this work was to correlate the impact of certain atmospheric conditions, notably aerosols and the variability of photovoltaic production in Saint Louis.
According to the Bouguer-Lambert law, better known as Beer's Law, the attenuation of light through a medium is proportional to the distance covered in the medium and the radiation flux where k is an attenuation coefficient (Abitan et al., 2008).
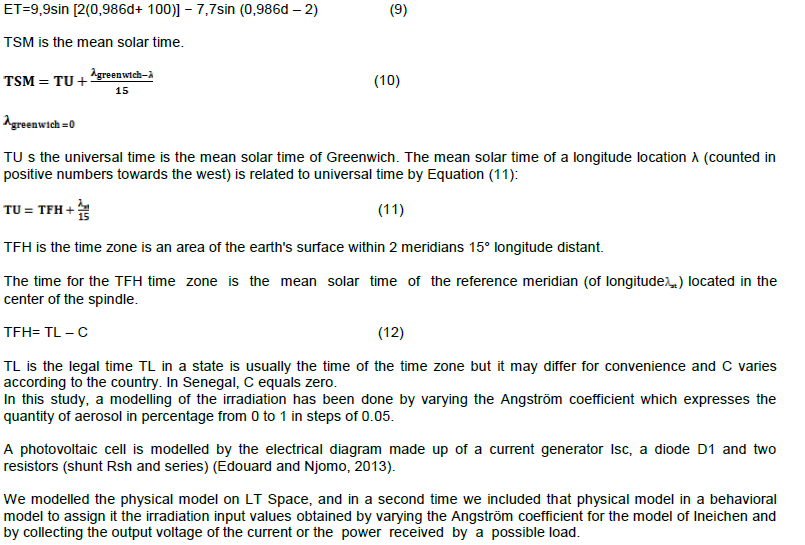
After doing the modelling on Matlab by varying the Angström coefficient which expresses the quantity of aerosols in percentage from 0 to 1 in steps of 0.05, we have the variation of the global radiation as a function of the Angström beta coefficient (Figure 4).
Figure 4 shows the variation of the radiation power as a function of time for different Angström coefficients. We find that the maximum radiation for a beta equals zero and the order is 772.8525W / m2. The minimum value of the radiation is 127.2792 W / m2 for a beta equals one (Dyer and Hicks, 1965).
These maximum and minimum values ​​given in Figure 4 are obtained at around 12 Am.
Table 1 gives us the variation of the global radiation max as a function of the Angström beta coefficient. We notice in this table that there are strong values for weak coefficients.
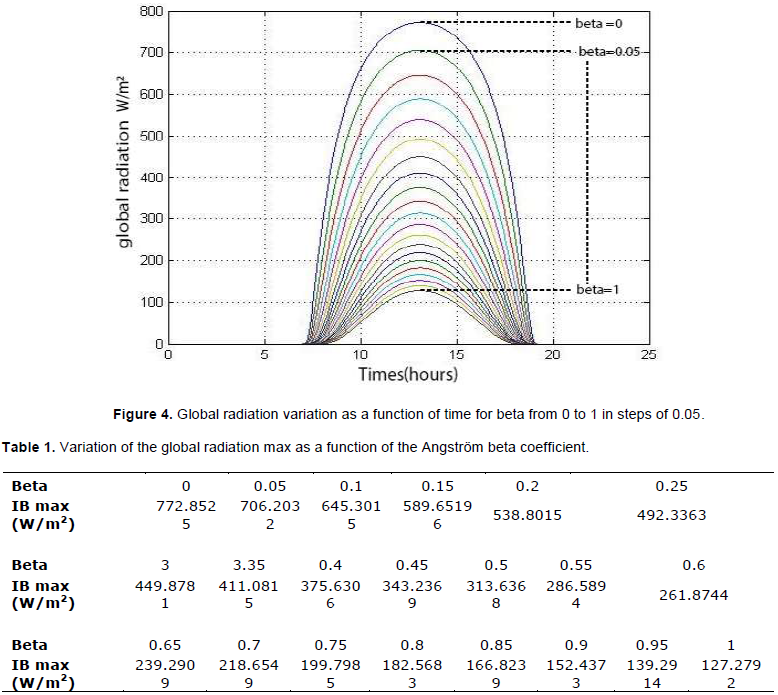
Figure 5 reflects the variation of the maximum radiation as a function of the Angström coefficient. There is a decrease in the maximum power as a function of beta.
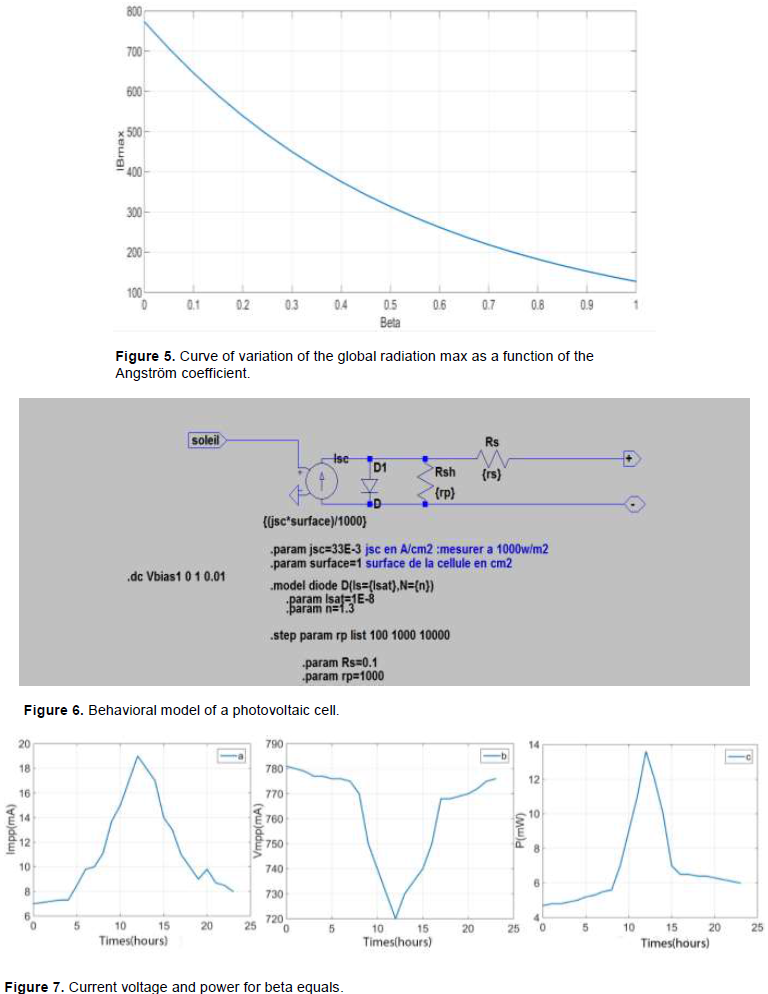
Figure 6 reflects a photovoltaic cell. That cell is modelled by the electrical diagram made up of a current generator Isc, a diode D1 and two resistors (shunt Rsh and sériers).
This physical model is in a second time included in a physical model to assign it values of irradiation inputs and temperature, as well as to collect the voltage output of the current or the power received by a possible load.
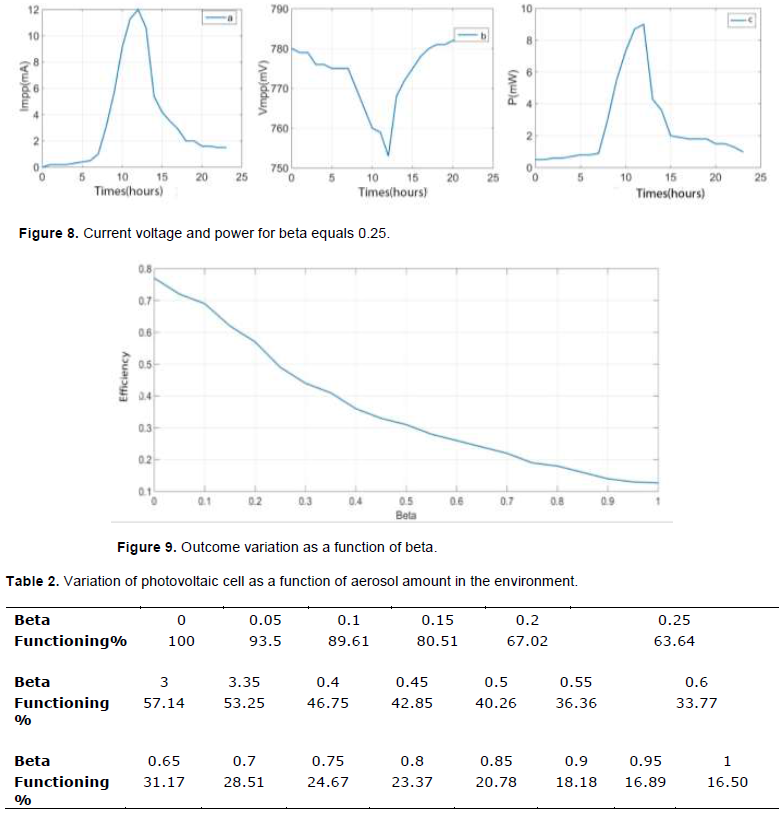
Figures 7 and 8 show the curves obtained from the simulation of different values of angström beta coefficient.
In the abscissa, there is the duration of the day. In ordinate, there are the powers in Impp (maximum power current) and in Vmpp (maximum power voltage). Note that the maximum power is obtained at about 12 Am and the voltage as well as the current is in phase opposition.
Figures 7a and 8a which show the current evolution indicate the beginning of the current growth at about 7 Am. We noticed that around 6 Pm we have a near zero current.
In Figures 7b and 8b, there was a decrease from 7 Am with a minimum at about 12 Am.
For Figures 7.c and 8.c, the maximum power is obtained at about 12 Am and the voltage as well as the current is in phase opposition.
Similar phenomenon occurs for beta and for all other Beta values. Figure 9 shows for a cell of 10 cm2 the outcome variation as a function of beta. We notice that there are outcomes higher than 0.7 for beta less than 0.05.
There is outcome decrease. It seems normal that the atmosphere is milder with a high beta.
From this point, an operation mode of the photovoltaic cell is drawn as a function of the aerosol quantity in the atmosphere (Table 2).
We modelled a town of 40 houses, with an extension to 50 houses, 1 hydraulic pump, a mosque (Figure 10).
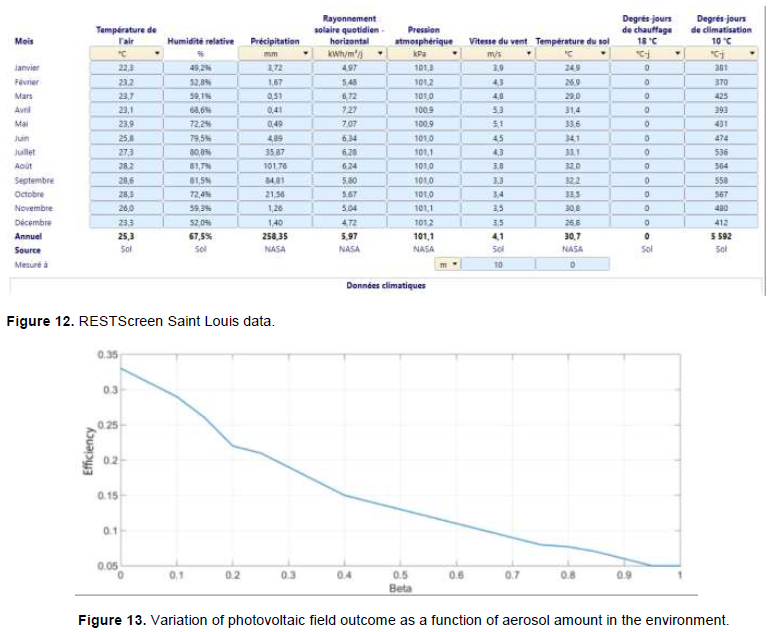
The solar energy potential of the area is provided by RESTSCREEN (Figures 11 and 12).
The energy needs of the town are estimated at 255.53 KWh for a total power of 24.16 KW. The peak power (PC) required for the photovoltaic system is 71.34 KWp. The number of 250W / 24V panels required is 288.
The photovoltaic field outcome under optimal conditions, without aerosols, is 0.33.
By applying the photovoltaic cell operation to the photovoltaic field and considering the field as a much larger cell, we have the Figure 13 which expresses the variation of the photovoltaic field outcome as a function of beta.
Analyses and interpretations of the results
The results obtained allowed us to highlight the evolution of the irradiance compared to the atmospheric disorders,
characterized by the Link factor, in which the Angström coefficient, which we called beta, is found.
Step 1
In Figure 4, we have the variation of the global daily radiation as a function of time for beta ranging from 0 to 1 in steps of 0.05. We are left with a "superposition of 21 curves" of different colors. Minimum was seen for each curve around 6 am and 6 pm; maximums around 12.
A difference of 645.5733 W / m2 between beta = 0 and beta = 1 is noted at the maximum overall radiated level (Figure 4). This difference shows the influence of the Angstrom coefficient in the radiative transfer.
The first results show the reduction of irradiance according to the beta coefficient increase, which is nothing other than a Link Factor variable which gives us information on the quantity of aerosols in the atmosphere. This is consistent with the literature (DIOP 2012) because solar energy is attenuated (diffusion and absorption) by the presence of dust in the atmosphere.
Step 2
We modeled a CdTe cell on LTspace with the characteristics as shown in Figure 6. It is assigned the irradiation values ​​obtained in "step 1". Note that the efficiency of cadmium telluride cell (CdTe) after simulation decreases. We go from an R (efficiency)> 0.7 to a R <0.2. The efficiency of the cell is affected by the presence of aerosols in the atmosphere. This is evidenced by the evolution of the maximum overall irradiation with respect to the Link factor.
The impact of aerosols on solar radiation results in lower cell efficiency. From the yields obtained, an operating mode of the photovoltaic sensor is obtained (Table 2) as a function of the Angstrom coefficient.
Step 3
The photovoltaic power plant that we have developed from a sizing of the village of Ndiawdoun-Pont provides for an atmosphere free of aerosols (beta = 0) a yield of 0.33 corresponding to a power of 71.34 KWc sufficient to supply Ndiawdoun-Pont.
By applying the operating mode (Table 2) to the photovoltaic field, considering the photovoltaic field as a macroscopic sensor, we observe:
For beta greater than 0 and less than 1 the yields are between 0.21 and 0.08. The plant operates less than 63.64%. This will impact the comfort of the village and concessions. We have shown that atmospheric conditions impact photovoltaic production in the river region. The sunshine in the study area was made with an interactive beta coefficient. A characterization of the irradiation elaborated by modeling the radiation and a simulation of the yields of a photovoltaic power plant showed that there is a correlation between the output of the model and the renderings of the simulation.
The beta coefficient here makes it possible to determine the impact of aerosols on photovoltaic production in the area in question; the maximum sunshine rate of this zone is of the order of 127.2792 W/m2 for beta equals 1. For low Beta we have a maximum of 772.825 W/m2. This highlights the effect of aerosols. The link between the outputs of the irradiation model for two values ​​of beta (1 and 0) when considering the maximums gives estimated yields at 0.05 and 0.33 of
the photovoltaic plant subjected to a more or less disturbed by aerosols.
With known limit values ​​it is possible to allow the informed population to make arrangements with regard to the devices consuming electrical energy at their disposal.
It is important to note that climate change will be one of the biggest environmental issues of the 21st century. Global warming impacts, which are visible over the past few years, demonstrate the urgent need for the international community to act in a concrete way for future generations and for countries vulnerable to climate change, and this by making the decrease as quickly as possible of greenhouse gases emissions.
Fossil energies are used abusively. Their transformation steps and their use raise a lot of environmental problems such as climate change with the phenomenon of global warming, which is the increase of temperatures over most of the oceans and the Earth's atmosphere, measured globally over several decades, and reflecting an increase heat retained on the earth's surface.
Senegal has a medial electrification level (Kande, 2018), with a good coverage in urban areas while it remains low in rural areas.
Thus, the issue raised is in relation with the improvement of people's living conditions by avoiding fossil fuels. The promotion and the use of renewable energies as well as photovoltaics are good solutions since we have an area with very strong sunlight.
The fact that photovoltaic technology uses solar radiation to produce energy is mentioned in this study. The atmosphere impacts affected by aerosols on radiation are also discussed in this study.
We highlighted the atmospheric conditions on photovoltaic production in the river area. An assessment of sunshine in the study area has been made. A characterization of the irradiation is elaborated by modelling the radiation and a simulation of photovoltaic power plant outcomes.
Based on the results obtained, we can estimate aerosols impact on photovoltaic production in the river area; we evaluated the sunshine rate of this zone through modelling. We chose an irradiation model to estimate the photovoltaic plant outcomes subjected to an atmosphere disturbed by aerosols.
Thanks to this work, it is possible to launch alerts and specific warnings to population benefiting from this type of resource concerning their consumption and their electricity consumption devices.
Perspective
On one hand, for a more effective alert model, we will have to consider the evolution of atmospheric conditions (clouds, rain). An advanced study of the factor of Link in the day, the month or even the season will refine the recommendations and tips for the use of electrical devices powered by the plant.
On the other hand, the plant outcome will be better apprehended by considering meteorological parameters and aerosols deposit on the plant solar panels. The study will also continue on production and costs.