Full Length Research Paper

ABSTRACT
Increasing trend in the frequency of natural events like floods and drought, etc. due to increasing urbanisation has led to degradation of the ecosystems. A major flood in year 1981 in Jaipur district resulted into huge erosion of the top fertile soil and leaving the land unproductive for agriculture production. The present study was carried in Jaipur district of Rajasthan state to measure physical characteristics of the soil samples from different districts of Jaipur. Soils samples were taken at 5 and 15 cm below the top surface and have taken 3 samples per site in each month. The soil physical parameters like sieve analysis, dry density, liquid limit, specific gravity and moisture content were analysed by standard techniques for different months in a year. Analysed results revels that, land cover having different characteristics has an impact on the temporal variability of soil moisture and other physical variables. The result of this will help to understand the variation of physical properties and thus to better planning to work in agricultural field. Further to say that, findings of the study can be used for altered case studies, concentrating on the soil variability effects for geotechnical issues.
Key words: Flood, physico-chemical, water content, specific gravity, geotechnical.
INTRODUCTION
Soils which are of prime concern for many individuals are regarded as a great extent of unevenness because of interaction of physical, chemical and anthropogenic practises, which function with diverse concentrations and at different magnitude (Goovaerts, 1998). Conserving the soil feature can deliver economic gain in more competent use of nutrients and insecticides, growth in yield, enhancements in quality of water and air (USDA-ERS, 1997). The application of organic matter to the soils providing nutrients to the plants and playing a key role in the soil’s water holding capacity, its porosity and water infiltration rate (Krause et al., 2016; Yazdanpanah et al., 2016). The properties of dry soil along with its type have a great importance in agriculture (Ahire et al., 2013). In this sense, there are several studies that show the resistance of organically-amended soils to wet/dry cycles (Mamilov and Dilly, 2002; Pascual et al., 2007; Hueso et al., 2012; Hueso-Gonzalez et al., 2014). Therefore, water availability and drought stress are intimately linked with the terrestrial carbon (C) cycling, negatively affecting the mineralization of organic C (Muhr et al., 2010; Hueso et al., 2011; Wang et al., 2014).
The dynamic behaviour of soil defines the form of a soil due to land management which can be quantified by various biological, physical and chemical parameters (Karlen et al., 2003). In order to better land management, evaluating the soil physical behaviour to identify variations in soil is very important and prime importance (Campos et al., 2007).
Degradation of environment is now a concern in developing countries like India. In developing countries like India, amongst forest, water, and soil, soils plays an important element of environmental deprivation. The physical characteristics of soil affect the lushness with help of movement of water and wind, whereas the chemical characteristics of soil affects the nutrients of soil because of poor cultivation practices, desertification and severe/frequent irrigation, excess use of pesticides. Soil is one of the most significant gift of nature to mankind, which should be utilized carefully. However, most of our present environmental problems originate from ecological misbehaviour, demographic explosion, technological excess development process, ever increasing needs and man’s ability to transfer and utilize the land at his will. Consequently, these have changed the chemical and physical characteristics of soil and thus led to its deterioration. Agricultural productivity is considered as a good measure and indictor of optimum use or misuse of land.
At different spatio-temporal scales, forest cover along with the agricultural shield are beneficial in shielding the soil from tough climatic settings. The existence of these forest and dense vegetation gives the soil suitable cover there by decreasing the damage of micronutrients that are important for growth of plants and energy changes (Iwara et al., 2011). Nevertheless, with the steady degradation of agricultural cover to non-agricultural have diminishes soil efficiency because of amplified erosion of soil and changes in moisture content of soil mass. Indeed, various anthropogenic actions such as cutting of forest for infrastructure development and land preparation for agricultural production, depletes the presence of nutrient in the soil (Thornley and Cannel, 2000; Elliot, 2003).
Numbers of literature have observed the consequences of land use alteration on soil property (physical and chemical) (Lal, 1996; Evrendileka et al., 2004; Zhao et al., 2008). Above studies nevertheless considered variations in soil physical characteristics in relations to developing land use alteration in their networks. Therefore, more research are essential to recognise the effect of changing land use practices. According to Government of India (2009), land administration deal with necessary evidence for evaluating environmental impacts and its sustainability.
Different researchers have focused on the description and estimation of spatial variability of physical characteristics. Probably the most well-known among them are Chiles and Delfiner (1991), Journel and Huijbregts (1978) and Deutsch and Journel (1998) from the field of geo-statistics; in the field of geotechnical engineering (Vanmarcke, 1984; Fenton and Griffiths 2008; Phoon, 2008) have published important contributions. The effects of spatially variable soil properties are still topics of ongoing research in soil sciences (Webster and Oliver, 2007) or hydrology (Christakos, 1992) amongst other disciplines. Therefore an attempt has been made to understand the spatio-temporal variation of soil characteristics of different locations of Jaipur districts of Rajasthan. Soils were tested to acquire necessary information for design and different construction work such as
1. To disclose and make provision for problems because of construction.
2. To assess the appropriateness of the location for construction project.
3. To calculate the different type of soil properties like moisture content, specific gravities etc.
Study area
Jaipur district of Rajasthan has been selected for the study which covers total geographical area of 11.1 ×1000 km2 and spreading between N 26° 25’ - 27° 51’ and E 74° 55’ -76° 15’ (Figure 1).
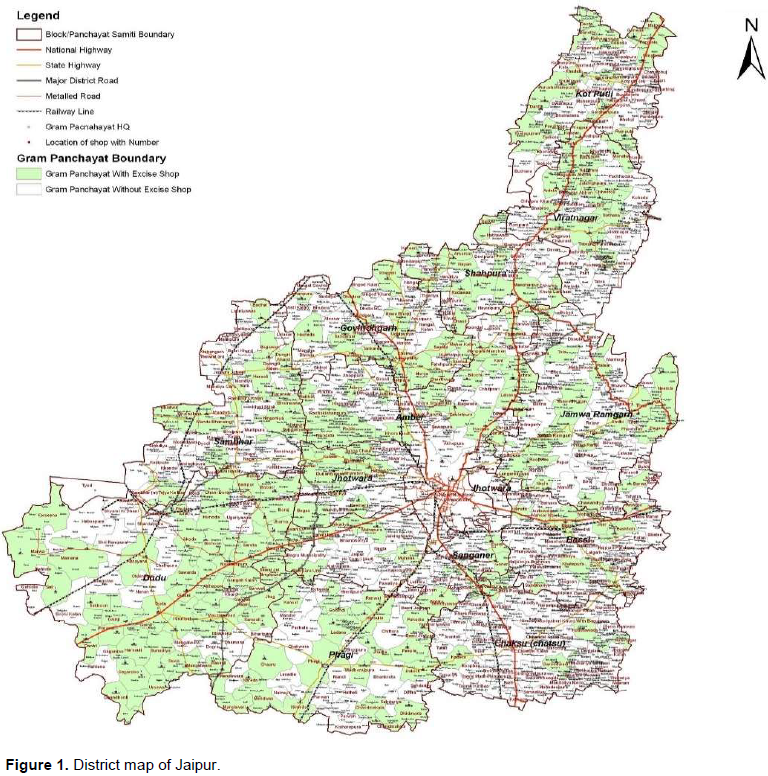
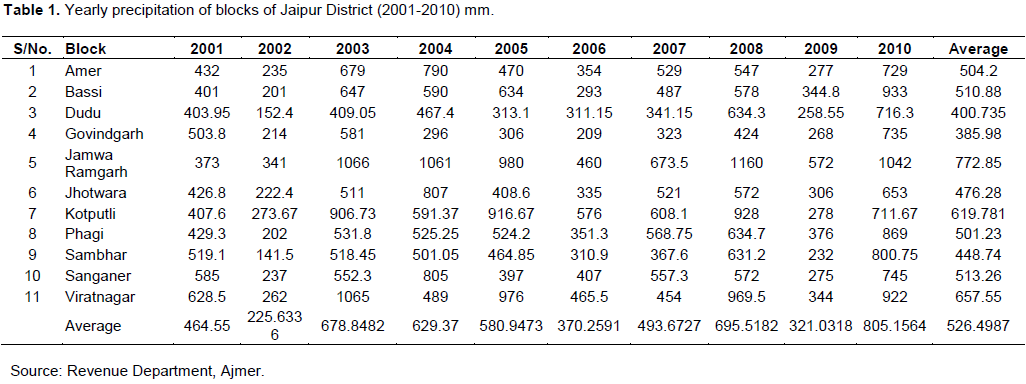
The Jaipur district gets average annual precipitation in the form of rainfall of 527 mm (1901-71) while average yearly precipitation for (1977-2006) is 565 mm. Annual average precipitation for the period (2001 to 2010) has been recorded as 527 mm (Table 1). Major portion of precipitation, over 85% of total precipitation is received during July to August. Overall yearly potential evapotranspiration (PET) for Jaipur district is found 1744.7 mm. The coefficient of variation in precipitation is reasonable at32.6% which is indicating slightly unpredictable arrangement of precipitation. Though, Jaipur is the capital of Rajasthan and often called as pink city has experienced vast floods in year 1981, even though the Jaipur district is susceptible to famine as perceived in year (1984-1989) and (1999-2002).
The Jaipur district is drained by small seasonal streams such as Sota, Dhund, Bandi, Mashi, and Sabi and with their small branches. District is further categorised by extensive variety of backgrounds which includes hills, rising and falling plains, dune turfs, etc. Main mounts of the districts include Jaigarh, Nahargarh, Manoharpura and Bichum whose elevation varies between (599m – 747 m amsl). Majorly soils that found in the district are sand and sandy clay loam and in minor portion of River sand.
Central and Rajasthan Ground Water Board together have assessed the ground water potential of the district on the basis of GEC-97 methodology and found 9994.67 km2 area in non-command area and 340.06 km2 in saline. The average yearly replaceable resource has been calculated to be around 750 mcm and yearly ground water ease of use has been assessed to be around 680 mcm.
METHODOLOGY
The foremost and utmost precarious stage in testing of soil is collecting representative soil sample. The most widely recognized and sparing technique for inspecting a range is composite testing, where sub-tests are gathered from haphazardly chose areas in a field, and the subsamples are composited for examination. The investigative results from composite testing give normal qualities to the examined range.
The real number of sub-tests relies on upon field size and consistency. For the most part, a bigger field or a less uniform field ought to be more seriously examined than one that is little and even. Five different location has been identified on different parts of districts viz. Jawahar Circle (JC) near Sanganer, Poornima University (PU) near Sitapura, Jawahar Nagar (JN), Sitapura (S) and Shivdaspura (SP) near Goner Phatak . Ideally, samples from these sites have been collected with an auger from different depth. Care has been considered while taking sample from the same profundity every time. A soil is tested, with the goal that month to month tests can be straightforwardly contrasted with screen changes after some time. Soil tests ought to be air-dried or taken to a test lab as quickly as time permits. It is best not to warmth or dry soil tests in a stove since soil compound properties might be changed.
Soil analysis
Once soil samples are gotten at a lab, various tests can be performed. A general comprehension of soil testing will help us to know, how the outcomes can be deciphered and to value the precision of diagnostic results.
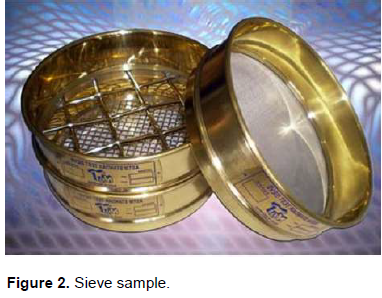
Sieve analysis and procedure
The mass of test ought to be adequate for soil particle size investigation. The base sum of material required held on the 425 µm sieve relies upon the greatest molecule size. All sieve sizes required by the particular material were acquired (Figure 2). Stack strainers in descending order with the sieve having the biggest opening on top and a pan on the base. Utilize a mechanical shaker and shake the sieve for five minutes subsequent to putting soil test on the top sieve. In the wake of shaking, expel the top sifter from the stack without losing any of the held material. Over a spotless container, hand strainer until not more than one percent, by weight, of the material held on the sifter keeps on going through the strainer. Consolidate any material passing the sieve with the material held on the following littlest size sieve. Measure the segment held on the main sieve and record the mass as W1 and rehash the above strategy for the following biggest sieve size and afterward add the material held to the segment held on the primary sieve and record the consolidated weight as W2. Proceed with hand sieving and recording the consolidated masses, as W3, W4, and so on until all sieving is finished.
a) Determine the aggregate mass of the sample:
Wt = Ws + W
Where: Wt = aggregate weight of sample, g
Ws = weight of material passing through the sieve size 425 µm, g
W = aggregate weight of smallest sieve size, g.
b) Determine aggregate % reserved on each sieve:
Aggregate % reserved on 1st sieve = 
Aggregate % reserved 2nd sieve =  and so on
c) Compute individual % held on every sieve by subtracting the aggregate percent held of one sieve size bigger from the total percent held of the sifter size.
Individual % retained = Cumulative % of W2 - Cumulative % of W1.
Specific gravity of soil
The term particular gravity of soil really alludes to the particular gravity of the strong matter of the soil or sediment, which is assigned Gs. Take specific consideration to acquire delegate tests for a particular gravity test. It is less demanding to start the test with a stove dried specimen. Be that as it may, a few soils, especially those with a high natural substance, are hard to rewet. Test these at their normal water content and decide the oven dried weight toward the end of the test.
Steps:
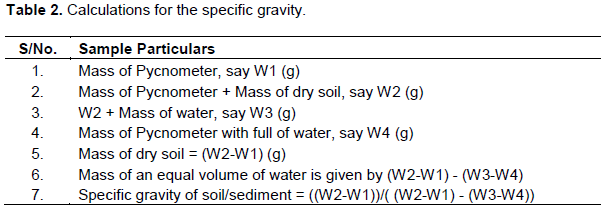
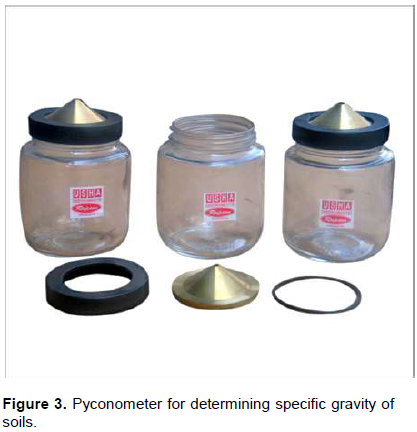
a. Measure a perfect, dry pycnometer to the closest 0.01 gram, record the essential data concerning the examples being tried and the pycnometer number.
b. Fill the pycnometer with room-temperature and with distilled water. Guarantee that the base of the meniscus is even with the alignment mark.
c. Take weight of water with pycnometer, Wbw.
d. Determine the temperature of water, Ti .
e. Below format describe the rest calculation for the specific gravity (Table 2).
Moisture content in soil
Water content in soil is identical to the extent of the heaviness of pores to the heaviness of the strong particles, and more often than not ascertain in rate.
a) Select a delegate test of the mass as proposed by norms.
b) Determine the tare mass of a clean, dry holder and cover, and record as WC.
c) Place the clammy example in the holder and secure the top onto the compartment.
d) Determine and record the mass of the holder, top, and clammy example as W1.
e) Remove the cover and place the holder with the example in the drying stove.
f) Dry for at least 16 h or to a steady mass.
g) To stove dry vast test examples, put the material in holders having a huge surface region, and break into littler collections.
h) After the material has dried to a consistent mass, expel the compartment from the broiler and supplant the top immovably.
i) Allow the material and compartment to cool to room temperature or until the holder can be taken care of serenely with uncovered hands and the operation of the parity would not be influenced by the convection streams.
j) Determine the mass of the compartment, cover, and dry example utilizing the same equalization.
Mass of the water:
Ww = W1 − W2
Mass of the solid particle:
Ws = W2 − Wc
Water Content (%):
WC = 100* (Ww/ Ws)
Where:
Wc = mass of container and lid, g
W1 = mass of container, lid, and moist specimen, g
W2 = mass of container, lid, and oven-dried specimen, g.
Standard Proctor Test
The Proctor Test is a research facility strategy for tentatively deciding the ideal dampness content at which a given soil sort will turn out to be most thick and accomplish its greatest dry thickness The term Proctor is out of appreciation for R Proctor, thickness of a soil for a given compactive exertion relies on upon the measure of water the soil contains amid. The lab tests comprise of compacting soil at known dampness content into a barrel shaped mold of standard measurements utilizing a comp dynamic exertion of controlled extent. The soil is then generally compacted into the mold to a specific measure of equivalent layers, each getting a number blows from a standard weighted mallet at a predefined stature. This procedure is then rehashed for different dampness substance and the dry densities are resolved for each. The graphical relationship of the dry thickness to dampness substance is then plotted to set up the compaction bend. The greatest dry thickness is at last acquired from the crest purpose of the compaction bend and its comparing dampness content, otherwise called the ideal dampness content.
RESULTS AND DISCUSSION
Increase in flood becomes common in most places of Jaipur which results change in physical characteristics of soils particles depending on rainfall amount and soil type. Result of analysis of different soil characteristics are described below.
Sieve analysis
Soil samples were collected from five different sites during 2012 - 2013. After painstakingly expelling surface natural materials and fine roots, soil tests were gathered at profundity 10–20 cm, and visible roots and pebbles were expelled preceding further handling. Analysis of soil sample is then done as earlier prescribed. The result obtained from sieve analysis are as shown in Table 3.
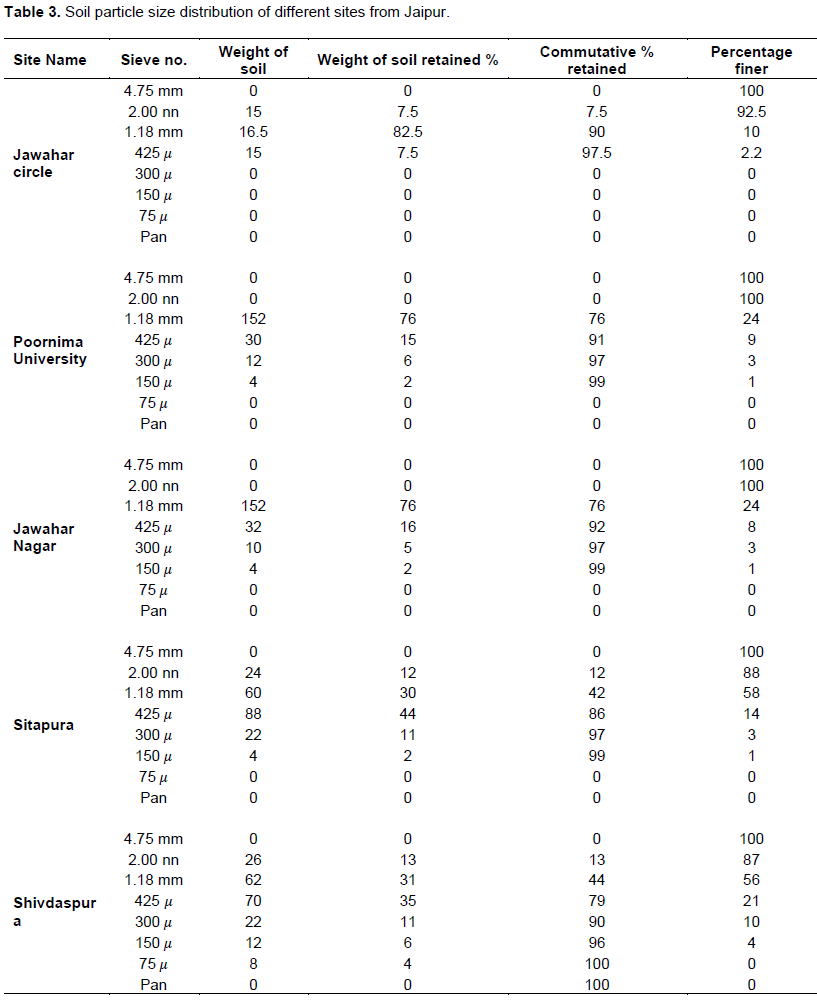
From Table 3, irrespective of different locations, soil portions showed factually same qualities among all the five destinations. Varieties happened just for the sediment part which demonstrated lower esteem in the Shivdaspura and Jawahar Nagar compared to the other three locations. Generally, the percentage of silt content in the soil of the study site is small. This means the soils are exceptionally weathered and is subsequently poor in weatherable minerals.
Specific gravity
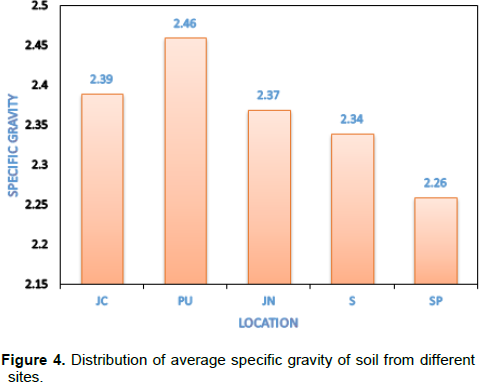
The particular gravity of a substance, assigned as Gs, is characterized as the proportion of the thickness of that substance to the thickness of refined water at a predetermined temperature. Since it is a proportion, the estimation of Gs does not rely on upon the arrangement of units utilized and is a numerical worth having no units. The particular gravity of soil solids refers only to the solid phase of the three phase soil system, it does not include the water and air phases present in the void space. Evaluation of specific gravity is as aforementioned. From Figure 3, results indicated that, the maximum value was found for PU (2.46) and minimum for site SP (2.26). As shown in Figure 4, the range of specific gravities for all soil samples are in good agreement with the previous studies.

Less value of specific gravity in SP indicates the high percentage of silica content in the soil as compared to PU and vice versa. Probably as important as the variations of specific gravity of soil is the fact that soil varies rapidly with depth. The admixture of soil from below the surface with surface soil is taking place constantly in excavating for pipes, paving, basements, and in agricultural operations. Thus, extreme surface variations may arise locally due to admixture with subsurface soil of the same region.
Moisture content
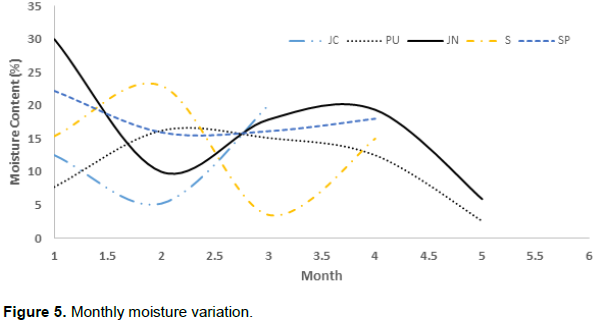
Soil moisture temporal variability is explored in wet and dry periods because of intra-annual variability of climate conditions. The dry seasons, from September to November 2012, is characterized by no rainfall, whereas wet season from January to February 2013 characterized by rainfall and accordingly soil moisture varies. The average soil moisture at each soil location for the entire sampling period were positively correlated with the total rainfall for each month. Soil moisture were relatively high in June, reached a peak in July, and then significantly decreased with the decrease in rainfall and again in winter rainfall it starts increasing (Figure 5). The variation in soil moisture content between each month was in the order of JN > S > JC> PU > SP. Dampness content has a tendency to be generally mind boggling and variable because of the high energize of soil water from precipitation and evapotranspiration. A high fluctuation in soil dampness has been connected with wet periods.
The reaction of the soil framework appears to be then not to be interesting, but rather conceivably changing from month-to-month, contingent upon the dispersion of cumulate yearly precipitation amid the year. This finding has essential ramifications for soil dampness progression models execution and for occasional precipitation overflow models that frequently utilize variable model parameters as indicated by predefined seasons or dampness stages.
Standard proctor test
Compaction of soil by mechanical mean is a common soil modification method to improve the engineering properties of soils. The effectiveness of the compaction is measured by soil moisture content and dry density in reference to maximum dry density (MDD) and optimum moisture content (OMC). Understanding of the soil compaction properties (MDD and OMC) is important in construction project such as earth dams, road and railway embankments, landfill liners and backfills of retaining structure.
From the investigation it is observed a general behaviour of the soils’ maximum dry density related to the water content of soil. The plot of maximum dry density versus optimum moisture content for five different soil samples is presented in Figure 6. The maximum dry density reduces as the optimum moisture content increases. The correlation of the maximum dry density and the optimum moisture content is strong varies between (0.41-0.92) and the relationship can be well represented as a linear equation. As water is added to a dirt (at low water content) it gets to be less demanding for the particles to move past each other amid the utilization of the compacting strengths. As the soil compacts the voids are diminished and this causes the dry unit weight to increment. Nonetheless, the expansion cannot happen uncertainly on the grounds that the soil state approaches the zero air voids line which gives the greatest dry unit weight for given water content. In this manner as the state approaches the no air voids line further water content increments must result in a decrease in dry unit weight. As the state approaches the no air voids line a most extreme dry unit weight is come to and the water content at this greatest is known as the ideal water content.
The ratio of the minimum and the maximum dry density is statistically constant for all soil samples since the coefficient of the variation is very small. The result implies linear correlations between the water content and the dry density data.
CONCLUSION
Variation in profile characteristics and temporal dynamics of soil moisture content were studied in Jaipur district. Soil physical properties was monitored and compared for five different locations having different types of land cover. Based on mean soil moisture content and soil moisture variability, JN is best able to conserve soil-moisture resources, followed by S, JC, PU, SP. Moisture content tends to be relatively complex and variable due to the high recharge of soil water from precipitation and evapotranspiration. The study also illustrated the soil moisture dynamics for the five types at different soil. Temporal changes in soil moisture correlated with rainfall. Maximum dry density was well correlated with optimum moisture content.
The study can characterize and acquire quantitative information for detecting and monitoring variability of soil properties. These results would provide further knowledge for soil management strategies that may decrease risk of erosion and land degradation. This study has provided support for the management of soil-water conservation and hydrological processes in arid areas.
CONFLICT OF INTERESTS
The authors have not declared any conflict of interests.
REFERENCES
|
Ahire DV, Chaudhari PR, Ahire VD and Patil AA, (2013). Correlations of Electrical Conductivity and Dielectric Constant with Physico-Chemical Properties of Black Soils. Int. J. Sci. Res. Pub. 3(2):1-16. |
|
|
Campos CA, Oleschko LK, Etchevers BJ, Hidalgo MC (2007). Exploring the effect of changes in land use on soil quality on the eastern slope of the Cofre de Perote Volcano (Mexico). For. Ecol. Manage. 248:174-182. |
|
|
Chiles JP, Delfiner P (1999). Geostatistics–modeling spatial uncertainty. WileyInterscience. |
|
|
Christakos G. (1992). Random field models in earth sciences. Academic Press. |
|
|
Deutsch CV, Journel AG (1998). GSLIB - Geostastical Software Library and Users's Guide. Oxford University Press. |
|
|
Elliot WJ (2003). Soil Erosion in Forest Ecosystems and Carbon Dynamics, In: Kimble, J.M.; Heath, L.S.; Birdsey, R.A. and Lal, R. (Eds.), The Potential of US Forest Soils to Sequester Carbon and Mitigate the Greenhouse Effect. CRC Press, Boc Raton, FL. pp. 175-190. |
|
|
Evrendileka F, Celik I, Kilic S (2004). Changes in Soil Organic Carbon and Physical Soil Properties along Adjacent Mediterranean Forest, Grassland and Cropland Ecosystems in Turkey. J. Avid. Environ. 59:743-752. |
|
|
Fenton GA, Griffiths DV (2008). Risk assessment in geotechnical engineering. John Wiley & Sons. |
|
|
Goovaerts P (1998) Geostatistical tools for characterizing the spatial variability of microbiological and physico -chemical soil properties. Biol. Fertil. Soil 27(4):315-334. |
|
|
Hueso S, Garcia C, Hernandez T (2012). Severe drought conditions modify the microbial community structure, size and activity in amended and unamended soils. Soil Biol. Biochem. 50:167-173. |
|
|
Huesoâ€González P, Martínezâ€Murillo JF, Ruizâ€Sinoga JD (2014). The impact of organic amendments on forest soil properties under Mediterranean climatic conditions. Land Degrad. Dev. 25(6):604-612. |
|
|
Iwara AI (2011). Soil Erosion and Nutrient Loss Dynamics in Successional Fallow Communities in a part of the Rainforest Belt, South-Southern Nigeria. Ph.D. Proposal Presented at the Staff/Postgraduate Seminar, University Of Ibadan, Nigeria. |
|
|
Journel AG, Huijbregts CJ (1978). Mining geostatics. Academic Press, London. |
|
|
Karlen DL, Ditzler CA, Andrews AS (2003). Soil quality: why and how? Geoderma 114:145-156. |
|
|
Krause A, Nehls T, George E, Kaupenjohann M (2016). Organic wastes from bioenergy and ecological sanitation as a soil fertility improver: a field experiment in a tropical Andosol. Soil 2:147-162. |
|
|
Lal R (1996). Deforestation and Land-Use Effects on Soil Degradation and Rehabilitation in Western Nigeria. I. Soil Physical and Hydrological Properties. Land Degrad. Dev. 7:19-45. |
|
|
Mamilov AS, Dilly OM (2002). Soil microbial eco-physiology as affected by short-term variations in environmental conditions. Soil Biol. Biochem. 34(9):1283-1290. |
|
|
Muhr J, Franke J, Borken W (2010). Drying–rewetting events reduce C and N losses from a Norway spruce forest floor. Soil Biol. Biochem. 42(8):1303-1312. |
|
|
Pascual I, Antolín MC, García C, Polo A, Sánchez-Díaz M (2007). Effect of water deficit on microbial characteristics in soil amended with sewage sludge or inorganic fertilizer under laboratory conditions. Bioresour. Technol. 98:29-37. |
|
|
Phoon KK (2008). Reliability-Based Design in Geotechnical Engineering- Computations and Applications. Taylor & Francis. |
|
|
Thornley JHM, Cannel MGR (2000) Managing Forests for Wood Yield and Carbon Storage: A Theoretical Study.Tree Phys. 20:477-484. |
|
|
USDA-ERS (1997). Agricultural resources and environmental indicators 1996–1997. Agric. Handbook (U.S. Gov. Print. Office, Washington,D. C.,). |
|
|
Vanmarcke EH (1984). Random fields: analysis and synthesis. MIT Press. |
|
|
Webster R, Oliver MA (2007). Geostatistics for environmental scientists. John Wiley & Sons Inc. |
|
|
Yazdanpanah N, Mahmoodabadi M, Cerda A. (2016) The impact of organic amendments on soil hydrology, structure and microbial respiration in semiarid lands. Geoderma 266:520 58-65. |
|
|
Zhao Q, Zeng DH, Fan ZP, Lee DK (2008). Effect of Land Cover Change on Soil Phosphorus Fractions in Southeastern Horqin Sandy Land, Northern China. Pedosphere 18(6):741-748. |
|
Copyright © 2024 Author(s) retain the copyright of this article.
This article is published under the terms of the Creative Commons Attribution License 4.0


