Full Length Research Paper

ABSTRACT
This study investigated the use of effective microorganisms (EM) to enhance cost-effective biogas purification at household-level application. It involved experimental setups for biogas purification in two different runs: 4 L activated EM and 1 L dormant EM by bubbling biogas through EM purification units. Biogas composition was analyzed using an industry-standard biogas analyzer. The results indicated that EM has the potential for biogas purification through a biological process, to remove H2S and CO2 by involving photosynthetic bacteria (Rhodopseudomonas palustris) in the presence of light. The raw biogas average composition was 62.2% CH4, 37.4% CO2 and 1359.3 ppm H2S. The 4L activated EM batch solution purified the raw biogas to 80.2% CH4, 19.5% CO2 and 786.1 ppm H2S. The corresponding purification efficiencies are 60% for CO2 and 49% for H2S. Purified biogas could be used by the household to cook for 1.82 h (85%) while raw biogas could cover only 55%. The designed biogas purification system can cost only Tshs 91,010/= and purify about 15,000 L of biogas at EM cost of Tshs 9,100/month.
Key words: Biogas composition, photosynthetic bacteria, anaerobic digestion, biochemical processes, Rhodopseudomonas palustris, biological desulphurization.
INTRODUCTION
Biogas is among the fuels from biomass which has great importance and can effectively replace fossil fuels for obtaining electricity and heat, also in the field of transport (Z?bav? et al., 2019). In recent years, there has been an increasing desire for use of biogas because it is a renewable source of energy, which is less expensive, reduce environmental pollution, reducing problems of power energy, environmental vandalism, loss of resources, climate change and promote better public health (Ilyas, 2006). Many communities especially those who live in rural areas meet 90% of their energy needs with biomass, particularly by wood fuel and this dependency on fuelwood has led to a rapid deterioration of Tanzania’s ecosystems (Felix and Gheewala, 2011). Biogas is produced biologically through the process of anaerobic digestion by which organic material is transformed into gaseous products, mainly methane and carbon dioxide, ammonia, hydrogen sulphide and water vapour. Biogas contains methane (60%) and carbon dioxide (40%) as its principal constituents (Adnan et al., 2019). Other biogas constituents are in small amounts of other compounds like ammonia (NH3), water vapour (H2O), hydrogen sulphide (H2S), methyl siloxanes, nitrogen (N2), Oxygen (O2), halogenated volatile organic compounds (VOCs), carbon monoxide (CO) and hydrocarbons (Awe et al., 2017; Mann et al., 2009). The composition and properties of biogas vary to some degree depending on feedstock types, digestion systems, temperature and retention time (De Hullu, 2008). Weiland (2010) reported that from the biogas, methane gas is of particular interest because it is a fuel that can be used for several applications while the main biogas impurities that may require removal in upgrading systems are CO2, H2S, NH3, water and solid particles. These components are impurities that pose major impediments to the commercial use of biogas (Nallamothu et al., 2013). High CH4 purity biogas has the same properties as natural gas, especially in terms of heating value; therefore, this clean biogas is qualified to be injected into a natural gas grid (Adnan et al., 2019). CO2 has no energy yield through combustion and greatly reduces the energy yield per volume of biogas due to its high concentration. H2S is toxic and highly corrosive, often damaging machinery/equipments used to transport and produce energy from biogas. It also forms a harmful pollutant, Sulphur dioxide, upon combustion (Kapdi et al., 2005). Removal of these impurities is necessary to make biogas an effective energy source.
A number of technologies are available for biogas upgrading. Carbon dioxide is mainly removed by water scrubbing, pressure swing adsorption (PSA) and polyethylene glycol scrubbing (Weiland, 2010; Mann et al., 2009). Several techniques available for the removal of hydrogen sulphide from biogas are out of reach for common end-users due to lack of knowledge, higher running costs, and insufficient operational skills (Kulkarni and Ghanegaonkar, 2019). Using water scrubbing systems, H2S can be removed simultaneously with CO2, whereas for PSA systems adsorption columns with activated carbon are usually employed for H2S removal. These methods are expensive and often environmentally hazardous due to the nature of the chemicals used (Adnan et al., 2019). Problems associated with cost and sustainability prevents biogas from becoming a competitive alternative energy source. H2S can be removed internally to the digestion process by biological desulphurization performed by microorganisms of the family Thiobacillus or by iron chloride dosing to the digester (Weiland, 2006). Phototrophic bacteria (Chlorobium limicola) can also be responsible for the oxidation of H2S under anaerobic conditions in the presence of CO2 and sunlight. Most thiobacteria are autotrophic, consuming CO2 and generating chemical energy from the oxidation of reduced inorganic compounds such as H2S (Zhao et al., 2010).
In Tanzania, the amount of biogas produced is used up without being purified and as a result, it fails to meet the energy demand of the people. This is due to the lack of affordable and reliable purification technology because most of the biogas purification technologies are very expensive and hazardous to the environment (Ng’wandu et al., 2009). These problems associated with cost and sustainability prevents biogas from becoming a competitive alternative energy source that is why it is not widely spread in Tanzania. Thus, there is underutilization of biogas.
Effective microorganism is a media solution composed of different types of microorganisms such as photosynthetic bacteria, lactic acid bacteria, yeast, actinomycetes and fermenting fungi (Olle and Williams, 2013). These microorganisms usually synchronize with other microbes in any natural environment. The types of bacteria which are responsible for biogas purification are the photosynthetic bacteria (Rhodopseudomonas palustris) which are capable of oxidizing H2S by using carbon from CO2 as a source of energy (Agriculture and Lokare, 2007). Although R. palustris is a purple non-Sulphur bacterium, it is flexible to switch among any of the four modes of metabolism that support life. It can grow with or without oxygen, and uses light, inorganic compounds, or organic compounds, for energy (Kernan et al., 2015). The amount of H2S conversion to elemental Sulphur or sulphate depends on the amount of light the bacteria receive (Pokorna and Zabranska, 2015). EM has a history of being used for different applications, including wastewater treatment, agriculture, livestock, gardening and landscaping, composting, bioremediation, cleaning septic tanks, algal control and household uses (Zakaria et al., 2010). Mwegoha (2012), reported the highest methane composition of 69% was observed from the study conducted on anaerobic composting of pyrethrum waste with effective microorganisms at an optimal mixing ratio of the substrate to EM of 1:250 V/V at a dilution ratio of 1:4 m/m. According to the study conducted by Selele (2009), EM has been effective in the enhancement of biogas production and composition using food remains whereby the biogas production rate increase to about 32% as well as the percentage of methane in biogas composition increased to about 82%. However, the use of EM in the purification of biogas has not been investigated although EM contains photosynthetic bacteria (R. palustris) which are capable of oxidizing H2S by using carbon from CO2 as a source of energy to purify biogas. Therefore, this study aims at investigating the use of effective microorganisms to enhance cost effective biogas purification at household level.
MATERIALS AND METHODS
Experimental set up for purification of biogas
Biogas to be purified was produced from an existing 1 m3 floating dome biogas plant (Figure 1) fed with kitchen waste from the Cafeteria at Ardhi University, Dar es Salaam, Tanzania. It involved the use of effective microorganisms (EM) as the media for biogas purification. Two different runs of biogas purification units (1 L dormant and 4 L effective microorganisms) were used. Biogas analysis was achieved by using a biogas analyser (GIR5500) manufactured by Hitech Instruments. EM used for this experiment was obtained from Ardhi University, Laboratory of Environmental Engineering, but initially, it was imported from EM Technology Limited (P. O. Box 1365-60100 Embu, and Nairobi, Kenya). The activation of EM solution was made by mixing 1 L of dormant EM, 1 L of molasses and diluted into 18 L de-chlorinated water at a ratio of 1:1:18 (v/v/v). The mixture had a pH of 4.09 and it was left to ferment for 7 days in a 20 L bucket at an ambient temperature between 28 and 31°C where at the end the pH dropped to 2.76.
Purification of biogas involved two units each containing EM solution as a media for purification. One of these batch units contained 1 L of dormant EM and the other one had 4 L of activated EM. The first unit used a 1 L batch of dormant EM because it contained a large number of microorganisms that react with both hydrogen sulphide and carbon dioxide but not with methane. In this case, 1.5-L container with dimensions 5 cm × 10 cm × 30 cm was used. The second unit was of a 4 L batch of activated EM in a 5-L container with dimensions 10 cm x 16.7 cm x 30 cm. During purification, biogas was tapped from the gasholder of a floating drum anaerobic digester to the purification units where it was allowed to bubble through EM batch solutions using a 0.635 cm diameter hose pipe in both units by monitoring the time taken by a specific amount of biogas to pass through the purification media (Figure 2).
During the purification of biogas, there was a variation in the time and the amount of biogas passed through because of the pressure difference from the biogas plant. The amount of pressure from the biogas plant was determined by the amount of biogas present and the mass of the loads added on top of the biogas holder. As the biogas passes to the gas analyzer, the moisture was trapped in the moisture trap unit as shown in (Figure 2). This experiment was conducted for 37 days until when the media was exhausted; that is, it lost the ability to purify the biogas. At this stage of media exhaustion, the concentration of gases in the composition of biogas in terms of percentage (CH4 and CO2) and ppm (H2S) for the purified gas was almost the same as the raw gas, that is, 62.2% CH4, 37.4% CO2 and 1359.3 ppm H2S.

Biogas composition analysis using Gas analyser GIR 5500
The GIR5500 (Gas analyser) was used to measure the percentage composition of biogas in terms of % CH4, % CO2 and H2S ppm before and after purification as shown in Table 1. The analysis was performed by discrete sensors connected in series. Basic sample conditioning was supplied as standard along with a sampling pump, sample flow indication and a low sample flow alarm.
Purification mechanism for the removal of biogas impurities using EM
EM is made up of photosynthetic bacteria, lactic acid bacteria, yeasts, actinomycetes and fermenting fungi which consume CO2 and generates chemical energy from the oxidation of reduced inorganic compounds such as H2S (Higa, 1998). Photosynthetic bacteria play the leading role in the activity of EM. The unique characteristic of the phototrophic bacteria is their ability to oxidize H2S to elemental Sulphur under anaerobic conditions using sunlight and CO2 as sources of energy (Equation 1). Hence, when biogas is passed through EM batch reactor, mainly CO2 is consumed by phototrophic bacteria as a source of energy in the presence of sunlight to produce formaldehyde, water and Sulphur. Carbon dioxide is assimilated into cell material.

Lactic acid bacteria act on sugars and other carbohydrates produced by photosynthetic bacteria and yeast to produce lactic acids which result in the lowering pH below 2. Lowering pH might create an un-conducive environment for the photosynthetic bacteria. A study conducted by Sakurai (1997) reported that lactobacillus increased acidity of the media which was not conducive to photosynthetic bacteria and streptomyces during the co-existence of photosynthetic bacteria, streptomyces and lactic acid bacteria in solutions of effective microorganisms. However, the biochemical processes shown above (Equation 1) leads to the production of formaldehyde (CH2O), Formaldehyde is the simplest of all aldehydes and is highly cytotoxic (i.e., highly toxic to microbes). Therefore, though biogas purification using batch EM solutions remove both CO2 and H2S the purification process over time leads to the accumulation of formaldehyde which is toxic to photosynthetic bacteria. As the concentration of photosynthetic bacteria gets reduced over time due to the toxicity of formaldehyde, the removal rate of CO2 and H2S gets reduced with time.
Biogas utilization on cooking test
Both raw and purified biogases were utilized to test their efficiency in terms of cooking time. 100 L of biogas was burnt in a gas stove and the time taken to be utilized for cooking was monitored.
Data analysis
Data analysis was done using Microsoft Excel and the instant program. Statistical analysis was used to compare the performances of each biogas purification unit using different batch volumes of EM solution. The t-test was used to determine the differences in percentage removal of CO2 from each of the biogas purification units.
RESULTS AND DISCUSSION
Biogas purification using 1 L Dormant EM and 4 L Activated EM batch media to remove CO2
Performance of 1 L Dormant EM batch media in purifying biogas
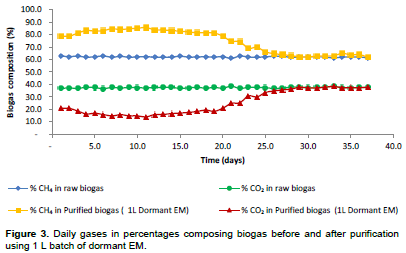
Biogas purification using 1 L dormant EM batch media has shown that the percentage composition of CO2 in the purified biogas kept on decreasing from 36.8 to 20.8%, whereas the percentage composition of CH4 content kept on increasing from 62.9 to 79%. Removal of CO2 and the percentage increase in the CH4 content started from the beginning of the experiment from 36.8 to 20.8% for CO2, and 62.9 to 79% for CH4. As time went on, both respective percentages for removal of CO2 and methane upgrade in the biogas kept on increasing. The reason for that might be due to the fact that from day 1 to day 3, the microorganisms were acclimatizing to the environmental conditions created by the introduction of biogas; however, as times went by, they got acclimatized and started acting on CO2 as a source of energy resulting into more of them being reproduced. The percentage reduction of CO2 in the purified biogas was a result of the mediation of the raw biogas by the photosynthetic bacteria (R. palustris) as shown in Equation 1. As reported by Hansen and Gemerden (1972), that R. palustris is capable of converting sulphide into sulphate without intermediate accumulation of elemental Sulphur. Therefore, during purification of biogas using effective microorganisms, hydrogen sulphide may have been converted into elemental Sulphur or sulphate depending on the mode of metabolisms in which Rps. palustris is switched on.
The R. palustris bacteria in the purification media (that is, dormant and activated EM) were capable of oxidizing hydrogen sulphide present in the biogas to elemental Sulphur by using only light and CO2 which is also present in the raw biogas for their growth. The process went on well until day 18 when there was a drop in the percentage increase of CH4 although on day 19 there was a slight percentage increase in CH4. Then from day 20 to day 26, there was a significant drop in percentage CO2 removal whereby the concentration of CO2 in purified gas was nearly equal to the concentration of CO2 in raw biogas that ranged between 36.8 to 34.8%. Thereafter, there was no further removal of CO2 as shown in Figure 3. This shows that at this point most of the phototrophic microorganisms might have been dead due to accumulation in the batch solution of formaldehyde over time that is toxic to photosynthetic bacteria. This could also be the main cause for the observations made on day 25 of the experimental run when the removal efficiency was almost zero. At this stage, the media was exhausted due to the absence of phototrophic bacteria to mediate the purification process. The overall average composition of biogas after purification was 74.8% CH4 and 25.0% CO2. By considering the time before exhaustion, the average biogas composition was 83.0% CH4 and 16.7% CO2 which was observed during the first 17 days before the media (EM) started to lose its efficiency in biogas purification (Figure 3).
Biogas purification process using 4 L activated EM
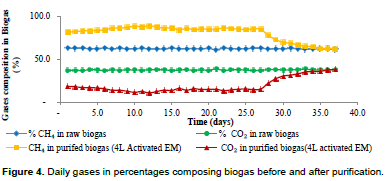
Biogas purification process using 4 L of activated EM showed that EM could remove CO2 from the beginning of the experiment and it kept on increasing as time went by. This could be due to the reasons already mentioned above. The results have shown that percentage CO2 composition in purified biogas was decreasing from 37.4% to an average percentage CO2 by composition of 14.8% before exhaustion and 19.5% after exhaustion while percentage average methane composition was increasing from 62.9 to 85.6% before exhaustion and 80.2% after exhaustion before it began to lose its purification ability on day 27. From day 27, the removal of CO2 started to decrease until it reached a point whereby the percentage CO2 composition in raw biogas was equal to the percentage CO2 content in purified biogas on day35 as shown in Figure 4. At this stage, the media for purification (EM) had reached its exhaustion stage and the predominant reason for the exhaustion is due to the accumulation of formaldehyde over time in the batch solution that is toxic to photosynthetic bacteria over time.
Comparison of the biogas composition between the two purification units after purification
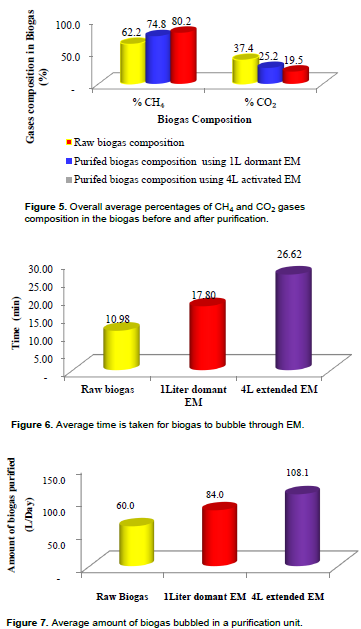
The results have shown that the overall average percentage CO2 content in the purified biogas using 4 L activated EM is lower (about 19.8%) than that purified by using 1 L dormant EM (about 25.1%) (Figure 5), with the average removal efficiency of 47.9 and 34.2% in 4L activated EM and 1 L dormant EM respectively. The average percentage CH4 content by the composition of purified biogas that went through the 4 L of activated EM was higher (about 80.3%) than the CH4 gas content in the biogas purified using the 1 L dormant EM (74.8%) (Figure 5).
This might be due to the fact that the average time taken by the biogas to bubble through 4 L EM to the biogas analyser was longer (about 26.4 min) than that used by 1 L dormant EM (about 17.4 min) (Figure 6).
The average amount of biogas passed through the biogas analyser for raw biogas was about 60 L/day at an average flow rate of 5.5 L/min, and 108 L/day at an average flow rate of 4.1 L/min in a 4L activated EM batch media and about 84 L/day with an average flow rate of 4.7 L/min in 1 L activated EM (Figure 7). Therefore, a longer time provided more retention time for biogas to stay in the system, that is, biogas had more time to get in contact with the phototrophic microorganisms when the biogas was bubbling through the EM batch solution. The other reason could be that there were more phototrophic bacteria in the 4 L activated EM batch solution than in the 1 L dormant EM batch solution. The results from this paper have shown lower performance in terms of CO2 removal as compared to the results reported by Ramaraj and Unpaprom (2016), that purification of biogas using microalgae resulted in purified biogas which contains about 96% CH4 and 4% CO2. The reason for this could be due to the use of different materials and methods.
Statistical analysis on the biogas purification performance from all units
The results have shown that the 4 L activated EM has shown high performance in biogas purification in terms of CO2 removal efficiency as compared to 1 L dormant EM. A paired T-test statistical analysis shows the p-value between the two paired t-test was less than 0.0001 which is less than 0.05. Therefore, the difference between the two experimental runs was considered to be extremely significant.
Biogas purification processing batch media exhaustion rate
Determination of the purification processing batch media exhaustion rate is a function of the volume of biogas purified and the volume of the purification media through which the gas was passed. Therefore, the more the biogas was passed through the purification media the more the purification efficiencies got lowered (Figure 8). During the experimental run for a while, the biogas purification efficiency was observed to increase over time but later on, after some day’s efficiency declined. By comparing the two purification processing batch media (Figure 8), the purification efficiency of the 1 L dormant EM batch media started to drop after 17 days at the average removal efficiency of 55.2% whereas the 4 L dormant EM batch media started to drop after 27 days at the removal efficiency of 59.95%. Although both purification batch media reached a point where their respective removal efficiencies started to drop, the results have shown that the 4 L activated EM batch media took a long time (about 27 days) to lose its ability to purify than the 1 L dormant EM batch media which took only 17 days. Considering the amount of biogas purified during those days, 1 L dormant EM batch media could purify about 1409.5 L of biogas at a removal efficiency of 44.6% before exhaustion while the 4 L activated EM batch media could purify about 3002.5 L of biogas at a removal efficiency of 60% before exhaustion. Therefore, the longer the retention time the more the gas allowed to pass for purification.

Biogas purification using 1 L Dormant EM and 4 L Activated EM batch media for Hydrogen Sulphide Removal
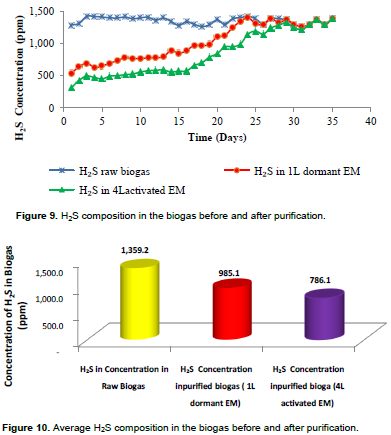
The average concentration of hydrogen sulphide in raw biogas was 1353 ppm. During purification, the concentration of hydrogen sulphide in purified biogas was lowered to 539 ppm when purified in a purification unit of 1 L dormant EM batch solution and 313 ppm in 4 L activated EM batch solution at the beginning of the experiment. The results have revealed that the removal of H2S in the purification units kept on decreasing gradually from day 1 to day 23 (1 L Dormant EM) and from day 1 to day 31 (4 L Activated EM); as a result, the daily concentration of hydrogen sulphide in purified biogas kept on increasing gradually before it was equal to the concentration of raw biogas (Figure 9).
Results have shown that more hydrogen sulphide was removed in the 4 L EM batch solution purification units with an average concentration of 786.1 ppm (Figure10) at an overall removal efficiency of 43.0% after exhaustion but the removal efficiency before exhaustion was 59.7%. In the purification unit of 1 L dormant EM batch solution, the average concentration of hydrogen sulphide was about 985.1 ppm at an overall removal efficiency of only 28.8% after exhaustion but the removal efficiency before exhaustion was 42.4%. The results from this study revealed that the removal efficiency of H2S from biogas is low (59.7%) as compared to the study reported by Zhao et al. (2010), that Acidithiobacillus thiooxidansAZ11 are capable of reducing H2S concentrations of 2200 ppm at a very high removal efficiency ranging from 94 to 99.9%. It was also reported by Cherosky (2012) that Thiobacillus bacteria operated in a fixed-film reactor were capable of removing 74% of the H2S in biogas containing as high as 24000 ppm hydrogen sulphide concentration. At the same time, Choo et al. (2013)observed high H2S removal efficiency of more than 98% in biogas purification using isolated Thiobacillus thioparus from swine wastewater. The lower performance observed in this study was attributed to the use of low light intensity (sunlight only) during the experiment as it was stated by Pokorna and Zabranska (2015), that the amount of H2S conversion to elemental Sulphur or sulphate depends on the amount of light the bacteria receive. Hence, sufficient light is necessary for optimal performance. When only sunlight was used, the sulphide removal rate was four times less than when the light bulb was used (Zhao et al., 2010).
Relationship between the amounts of biogas purified using EM and the extent of biogas purification achieved
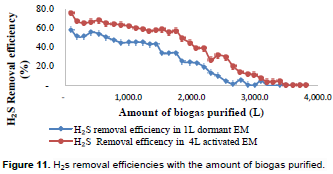
The amount and nature of EM as a purification media is the one that determines the rate of removal of H2S present in the same amount of biogas being purified. For example, during the experimental run, it was observed that 1000 L of biogas was purified using a 4 L activated EM at an average H2S removal efficiency of 61.9% whereas a 1 L dormant EM could purify the same amount of biogas but at an average H2S removal efficiency of 45%. Therefore, the overall biogas-H2S removal efficiency using the 4 L activated EM was about 49% while that of 1 L dormant EM was only about 35% (Figure 11). Thus, 4 L activated EM has shown high removal efficiency of H2S than the 1 L dormant EM for the same amount of biogas purified. However, in all the cases discussed below, the removal efficiency of biogas contents namely CO2 and H2S are governed by Equation 1. The biochemical processes shown above (Equation 1) leads to the production of formaldehyde (CH2O). The Formaldehyde is the simplest of all aldehydes and is highly cytotoxic (i.e. highly toxic to microbes). Therefore, though biogas purification using EM removes both CO2 and H2S removal rates are declining when using EM batch media since the accumulation of formaldehyde over time is toxic to photosynthetic bacteria over time.
Comparison of CO2 and H2S removal with respect to the amount of biogas purified
During the experimental run, it was observed that biogas purification using a 4 L activated EM batch media could remove about 60% of CO2 content at a cumulative biogas amount of about 3000 L whereas the corresponding H2S removal efficiency by the same 4 L activated EM batch media was less than 10% (Figure 12). These results show that activated EM has a high affinity for CO2 removal compared to H2S. This observation is attributed to the presence of a lot of photosynthetic bacteria that are capable of reducing CO2 to cell material with concomitant stoichiometric oxidation of reduced Sulphur compounds under anaerobic conditions in the presence of light as shown by Equation 1. Figure 12 emphasizes the fact that CO2 and H2S removal rates are in declining rate when using EM batch media since the accumulation of formaldehyde over time is toxic to photosynthetic bacteria.
The experimental run also observed that 1 L dormant EM batch media could remove both CO2 and hydrogen sulphide, but this could be achieved when the cumulative amount of biogas was low. Figure 13 show that 1 L dormant EM batch media could remove neither CO2 nor Hydrogen Sulphide at a cumulative biogas amount of 3000 L. This suggests that 1 L dormant EM batch media was suitable for purification of biogas not more than 2031 L at a removal efficiency of 51.1%. The reason for this observation is that CO2 and H2S removal rates are declining rate when using EM batch media since the accumulation of formaldehyde over time is toxic to photosynthetic bacteria over time. However, comparing the 4 L activated EM batch media and the 1 L dormant EM batch media, the former has a higher removal capacity for both CO2 and H2S for the same cumulative amount of biogas purified.

Comparison of biogas utilization for cooking between raw and purified biogas
The amount of biogas produced from the biogas plants was burned using a biogas stove. The time required toburn 100 L of biogas was determined by testing both purified and raw biogas. Purified biogas recorded an average burning time of about 34.5 min for 100 L of biogas. This might be due to a high composition of methane of about 80.2% compared to raw biogas which took an average of 21.2 min to burn the same volume of biogas. A burning test was conducted to see how much cooking can be done by the purified gas. From this study, the average biogas production was 337.1 L/day. Based on the study conducted by Voegeli et al. (2009), it was reported that Tanzania average cooking time was estimated to be 2.15 h/day. Therefore, purified biogas could take about 1.82 h which is about 85% of the daily cooking hours, while raw biogas could take about 1.191 h equivalent to 55.4% of the total daily cooking hours.
Design of the household biogas purification unit using effective microorganisms
Results of this research have shown that 4 L activated EM can purify about 3000 L of biogas at an average CO2 removal efficiency of 60.8%. Also, considering the amount of biogas to be generated from 2 kg of kitchen waste at a household level was 337.1 L/day, the design of the household biogas purification unit is demonstrated by assuming that all the amount of biogas generated must be purified and utilized.
Production of activated EM
Activated EM can be generated from the extension of 1 L dormant EM to produce 20 L of activated EM.
Number of 4 L activated purification units
=20 L of activated EM / 4 L activated EM
= 20/4
= 5 units
Amount of biogas to be purified by 20 L of activated EM
4 L of activated EM could purify 3000 L, taken as a design criterion.
Since 20 L of activated EM can produce 5 units of purification (Each unit is of 4 L),
= Amount of biogas purified in a 4 L × number of purification units
= 3000 × 5
= 15,000 L of biogas.
Number of days that 20 L of activated EM can be used at the household level
= Total amount of biogas to be treated/Average daily
production of biogas
= 15,000/337.1
= 44.5 days
Cost associated with purchasing EM to be applied in the purification system
Cost of activated EM
1 L of Dormant EM = 12,000 Tshs
1 L of morasses = 1,500 Tshs
Total = 13,500 Tshs
Monthly cost for EM
=Total EM cost × 30 days of a month/Number of days activated EM could be used
= 13500 × 30/44.5
= 9,101.1 Tshs
Therefore, the monthly cost of using EM purified biogas is about Tshs 9101.1.
Cost estimation of the biogas purification unit
The total initial cost of the purification units was estimated to be Tshs. 96,500. This cost covers the initial cost for purchasing dormant EM and Molasses which is about Tshs 13,500 and the cost for fabricating a purification unit which is about Tshs. 83,000.
CONCLUSION
It can therefore be concluded that both dormant and activated EM can be used for biogas purification to remove both CO2 and H2S at low cost for the household application. The purification process takes place through a biochemical reaction involving photosynthetic bacteria (R. palustris) in the presence of light, with a high affinity for CO removal compared to H2S. This process results in the formation of formaldehyde (CH2O) as one of the products, the accumulation of which lowers the purification efficiencies due to its toxicity to photosynthetic bacteria. The 4 L activated EM batch solution showed high removal efficiency of about 60 and 48% for CO2 and H2S respectively. Purified biogas with 80.3% methane content could take about 85% of the daily cooking hours, while raw biogas with a methane content of 62.2% could take only 55.4% of the total daily cooking hours. Therefore, the use of EM for biogas purification can be achieved at a low cost as a biogas purification unit using EM at the household level. The installation cost at the household level is about Tshs 83,000 and a monthly EM cost of about Tshs 9,101.1. With this biogas purification system application, the biogas user is enabled to use biogas with fewer impurities (CO2 and H2S) and high calorific value.
CONFLICT OF INTERESTS
The authors have not declared any conflict of interests.
ACKNOWLEDGEMENT
The authors appreciate the Tanzanian Ministry of Higher Education, Science and Technology through the World Bank Project for the financial support for development of this research.
REFERENCES
|
Adnan AI, Ong MY, Show PL, Nomanbhay S, Chew KW (2019). Technologies for biogas upgrading to biomethane. A review, Bioengineering 6(4):1-23. |
|
|
Agriculture N, Lokare C (2007) Effective Microorganisms?: Myth or reality??' 14(2):315-319. |
|
|
Awe OW, Zhao Y, Nzihou A, Minh DP, Lyczko N (2017). A Review of Biogas Utilisation, Purification and Upgrading Technologies', Waste and Biomass Valorization. Springer Netherlands 8(2):267-283. |
|
|
Cherosky P (2012). Anaerobic Digestion of Yard Waste and Biogas Purification by Removal of Hydrogen Sulfide.Doctoral dissertation, The Ohio State University. |
|
|
Choo HS, Lau LC, Mohamed AR, Lee KT (2013). Hydrogen Sulfide Adsorption by Alkaline Impregnated Coconut Shell Activated Carbon 8(6):741-753. |
|
|
De Hullu J, Maassen J, van Meel P, Shazad S, Vaessen J (2008). Biogas upgrading, comparing different techniques. Eindhoven, Netherlands. |
|
|
Felix M. Gheewala SH (2011). A review of biomass energy dependency in Tanzania. Energy Procedia 9(2):338-343. |
|
|
Hansen TV, Gemerden H (1972). Sulfide Utilization by Purple Nonsulfur Bacteria'. Archiv für Mikrobiologie 86(1):49-56. |
|
|
Ilyas SZ (2006). A case study to bottle the biogas in cylinders as a source of power for rural industries development in Pakistan. World Applied Sciences Journal 1(2):127-130. |
|
|
Kapdi SS, Vijay VK, Rajesh SK, Prasad R (2005). Biogas scrubbing, compression and storage: perspective and prospectus in the Indian context. Renewable energy 30(8):195-202. |
|
|
Kernan C, Chow PP, Christianson RJ, Huang J (2015). Experimental and computational investigation of biofilm formation by Rhodopseudomonas palustris growth under two metabolic modes. PloS one 10(6):e0129354. |
|
|
Kulkarni MB, Ghanegaonkar PM (2019). Hydrogen sulfide removal from biogas using chemical absorption technique in packed column reactors. Global Journal of Environmental Science and Management 5(2):155-66. |
|
|
Mann G, Schlegel M, Schumann R, Sakalauskas A (2009). Biogas-conditioning with microalgae. Agronomy Research 7(1):33-38. |
|
|
Mwegoha W (2012). Anaerobic composting of pyrethrum waste with and without effective microorganisms. African Journal of Environmental Science and Technology 6(8):293-299. |
|
|
Nallamothu RB, Abyot T, Rao BVA (2013). Biogas purification, compression and bottling. Global Journal of Engineering Design and Technology 2(6):34-38. |
|
|
Olle M, Williams IH (2003). Effective microorganisms and their influence on vegetable production-a review. The Journal of Horticultural Science and Biotechnology 88(4):380-386. |
|
|
Pokorna D, Zabranska J (2015). Sulfur-oxidizing bacteria in environmental technology. Biotechnology Advances 33(6):1246-59. |
|
|
Ramaraj R, Unpaprom Y (2016). Effect of temperature on the performance of biogas production from Duckweed. Chemistry Research Journal 1(1):58-66. |
|
|
Sakurai M (1997). Co-existence of photosynthetic bacterias streptomyces and lactic acid bacteria in solutions of effective microorganisms. International Conference on Kyusei Nature Farming 5:379-385. |
|
|
Selele M (2009). Enhancement of the Biogas Plant Performance by Addition of Effective Microorganisms. M.Sc. Dissertation. Environmental Technology and Management. Ardhi University. |
|
|
Voegeli Y, Lohri C, Kassenga G, Baier U, Zurbrügg C (2009). Technical and biological performance of the Arti compact biogas plant for kitchen waste-case study from Tanzania. In12th International Waste Management and Landfill Symposium, S. Margherita di Pula, Cagliari, Italy pp. 5-9. |
|
|
Weiland P (2006). Biomass digestion in agriculture: a successful pathway for the energy production and waste treatment in Germany. Engineering in life sciences 6(3):302-309. |
|
|
Weiland P (2010). Biogas production: current state and perspectives. Applied microbiology and biotechnology 85(4):849-60. |
|
|
Z?bav? B?, Voicu G, Ungureanu N, Dinc? M, Paraschiv G, Munteanu M, Ferdes M (2019). Methods of Biogas Purification-A Review. Acta Technica Corviniensis-Bulletin of Engineering 12(1):65-68. |
|
|
Zakaria Z, Gairola S, Shariff NM (2010). Effective microorganisms (EM) technology for water quality restoration and potential for sustainable water resources and management. |
|
|
Zhao Q, Leonhardt E, MacConnell C, Frear C, Chen S (2010). Purification technologies for biogas generated by anaerobic digestion. Compressed Biomethane, CSANR, Ed, 24. |
|
Copyright © 2024 Author(s) retain the copyright of this article.
This article is published under the terms of the Creative Commons Attribution License 4.0


